
On Apr 3, 2019, XRP reached a high close to $0.386 and €0.338. Subsequently, XRP began dropping. By Apr 15, lows near $0.313 and €0.278 were reached.
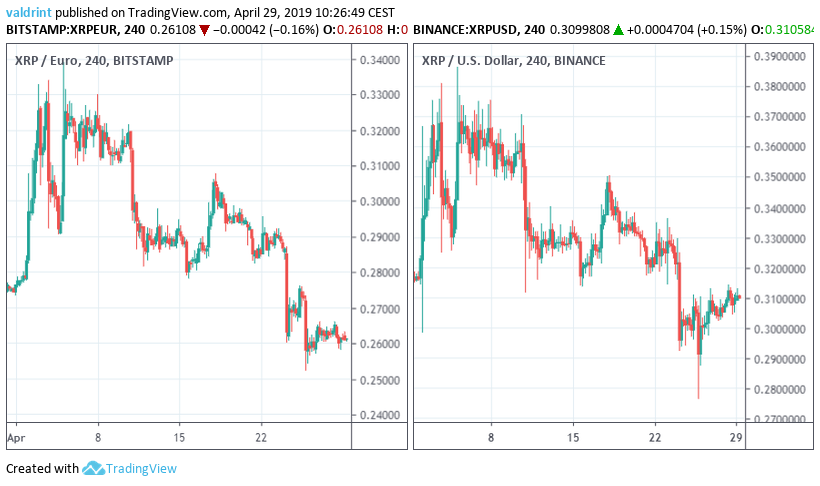
XRP subsequently rebounded but was unable to recover from the losses earlier in April. After reaching levels near $0.35 and €0.338, price losses intensified with a low below $0.30/ reached on Apr 25 and a low below €0.27 on Apr 25.
Over the last several days, price began rising again. Will this rebound lead to a successful recovery or will XRP drop further?
Let’s find out:
XRP (XRP): Highlights and Trends For April 29, 2019
- The price of XRP has been on a downtrend since Apr 6.
- It is trading inside a short-term ascending channel and a long-term descending channel.
- Bullish divergence is developing in the RSI.
- There is resistance near $0.35 and €0.31.
Ascending Channel
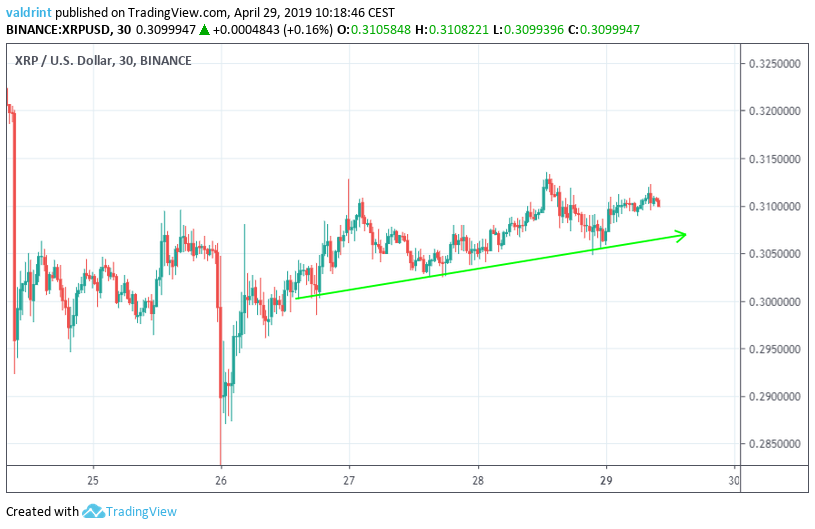
On Apr 26, the price reached a low of $0.296. Several market cycles were subsequently completed. The price has created higher lows each time.
Tracing these lows gives us an ascending support line:
On Apr 24, the price reached a high of $0.306. It has continued to increase, reaching several higher highs.
An ascending resistance line is created by tracing these highs. Taken together, the resistance and support lines combine to create an ascending channel:
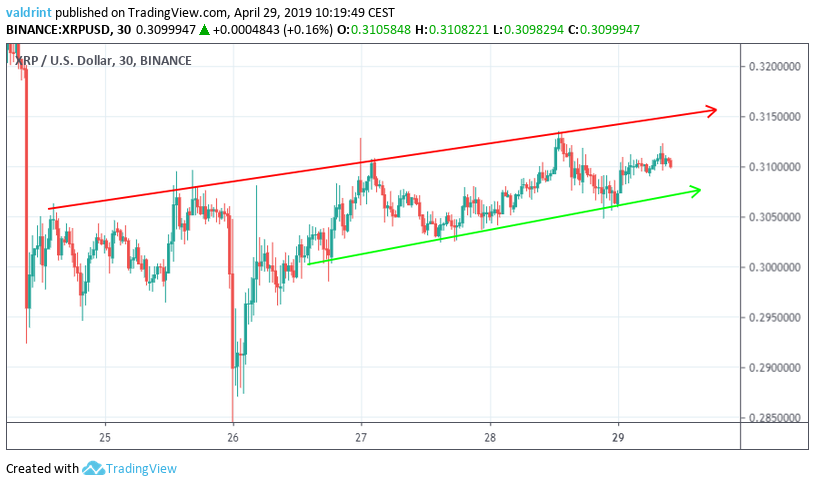
It is likely that the price will continue trading inside the confines of the channel until a decisive move occurs.
In order to predict the direction of the move, a look at technical indicators in a longer time-frame is required.
Technical Indicators
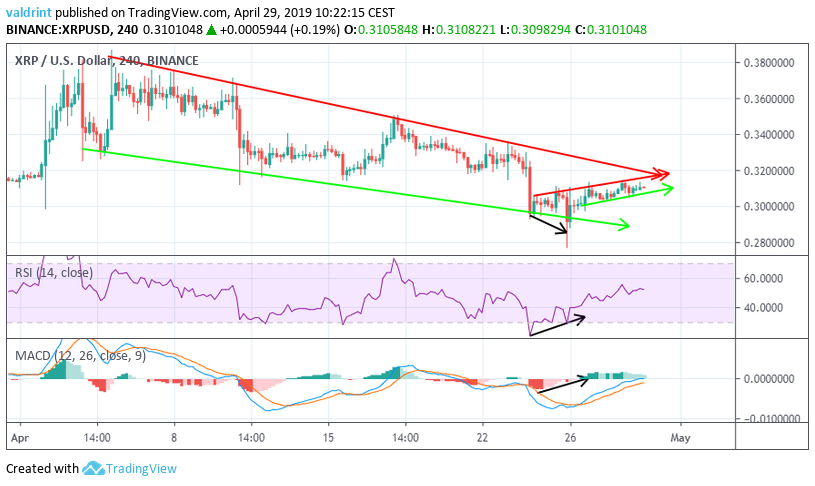
On Apr 24, the price made a low of $0.315. It made a lower low of $0.276 on Apr 24.
Similarly, the RSI and the MACD made the first low on Apr 24. However, they have continued to generate higher values. This is known as bullish divergence and often precedes price increases.
Furthermore, we can see that the price is trading inside a descending channel since Apr 2.
Based on these indicators, we believe that the price of XRP will increase at the rate predicted by the short-term ascending channel until it reaches the resistance line of the long-term descending channel. A breakout is possible.
Reversal Areas
We now incorporate resistance areas into our analysis to better determine future price fluctuations.
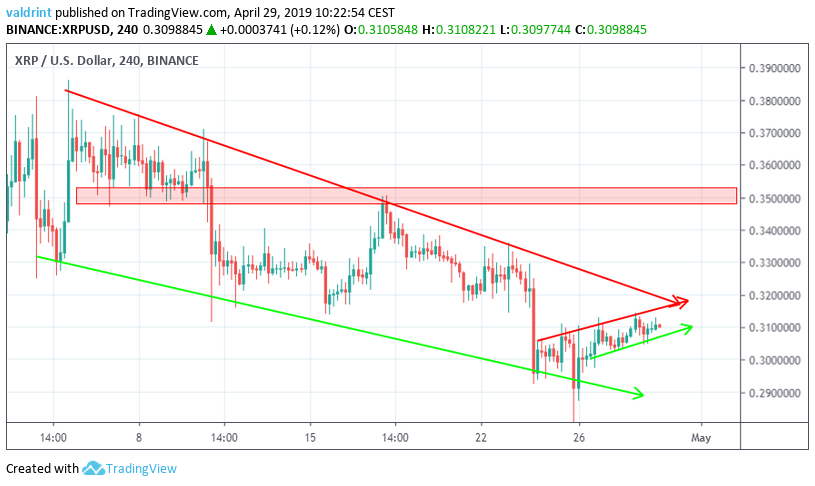
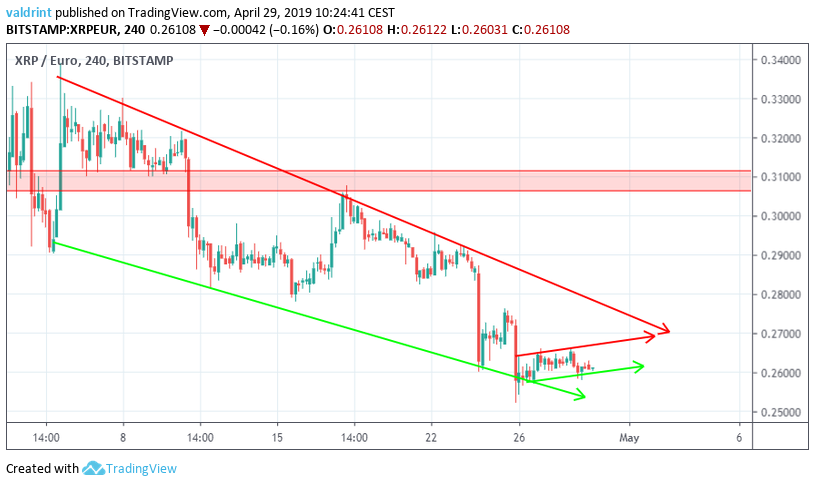
The closest resistance area is found near $0.35 and €0.31. We believe that the price will eventually reach this levels. However, this may not be a short-term target.
On the contrary, the price of XRP may rise within the descending channel to reach the long-term resistance line and fall back toward the support. At some point in the future, we do believe a breakout is likely, but we cannot determine exactly when this will occur or how low prices will drop prior to a breakout.
Summary of Analysis
Based on this analysis, XRP is likely to increase toward the resistance line of the wedge. We believe that the price will eventually break out, but it is possible that greater prices losses may occur before this time. Once the price of XRP reaches the resistance line, the price may drop back toward support rather than break out.
For price 2019, 2020, and five-year Ripple price predictions click on the green button below:
Disclaimer: This article is not trading advice and should not be construed as such. Always consult a trained financial professional before investing in cryptocurrencies, as the market is particularly volatile.
