
At BeInCrypto, we publish regular price analyses and predictions for XRP. In our Apr 23 analysis of XRP/USD, we predicted that XRP—also known as Ripple— would experience price decreases. Our prediction was validated on Apr 24. To learn more, take a look at our most recent XRP/USD($) and XRP/EUR(€) analysis below:
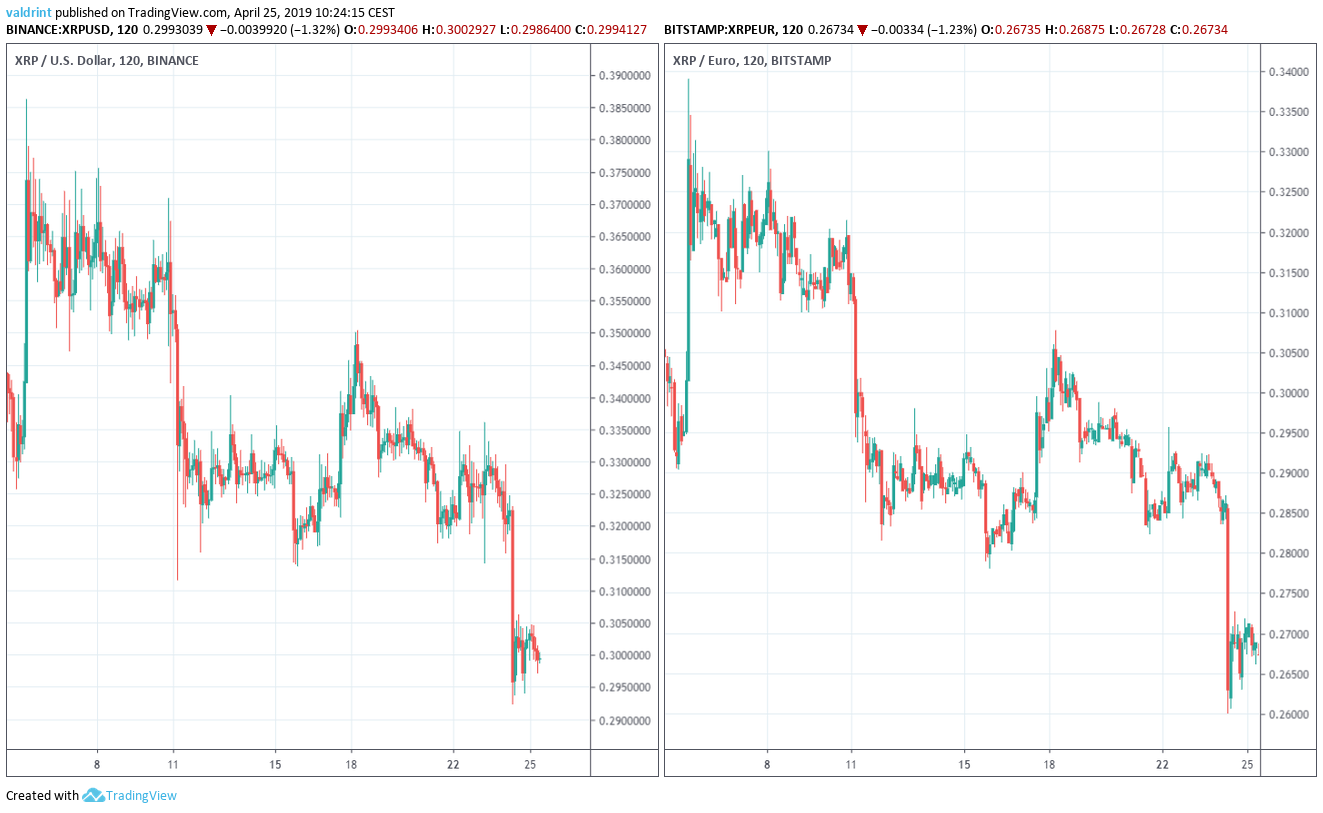
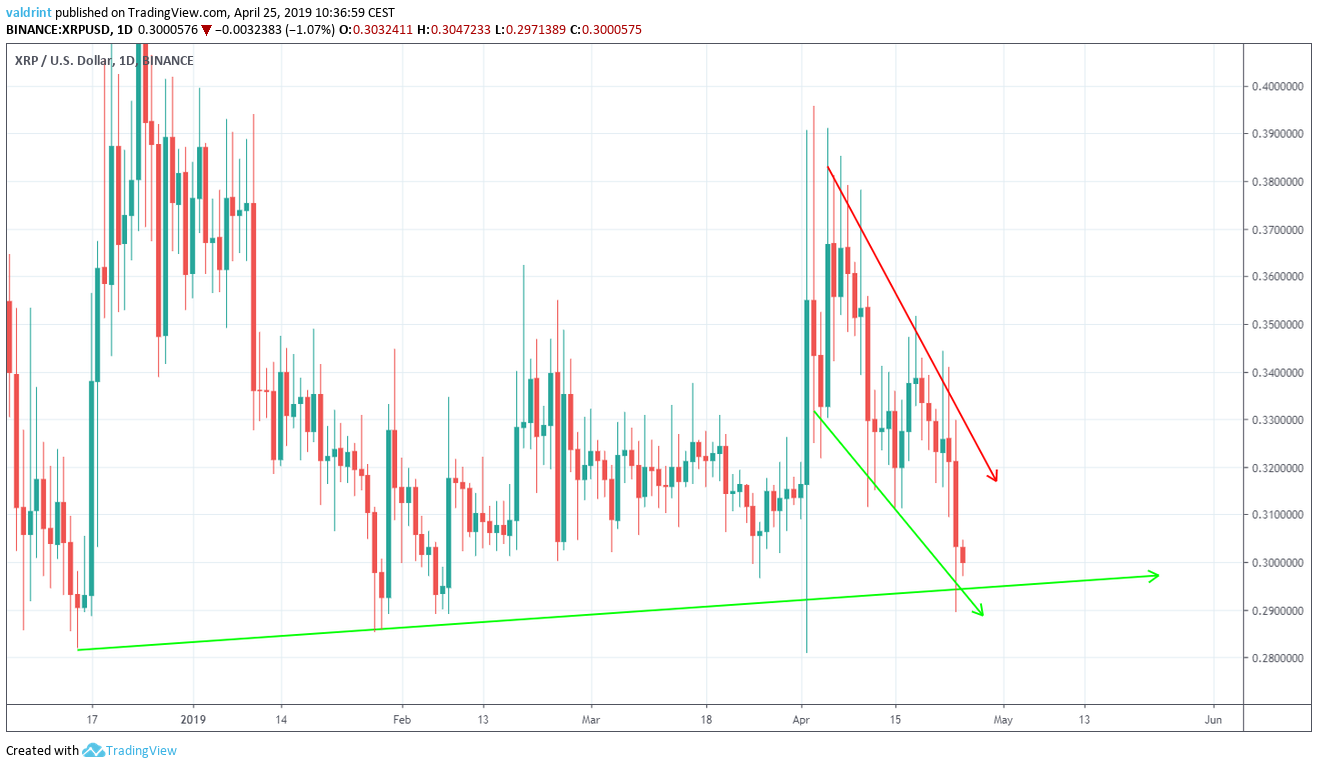
On Apr 3, 2019, Ripple reached a high close to $0.386 and €0.338. A rapid drop followed. Lows close to $0.313 and €0.278 were reached on Apr 15.
A rapid increase was followed by a gradual decrease. The decrease intensified on Apr 22.
Lows below $0.30/€0.27 were reached on Apr 24 and 25. At the time of writing, XRP was still struggling to rise above this level.
XRP (XRP): Highlights and Trends For April 25, 2019
- The price of XRP has been on a downtrend since Apr 6.
- It is trading inside a descending wedge.
- Bullish divergence is developing in the RSI.
- Ripple is trending along a long-term support line.
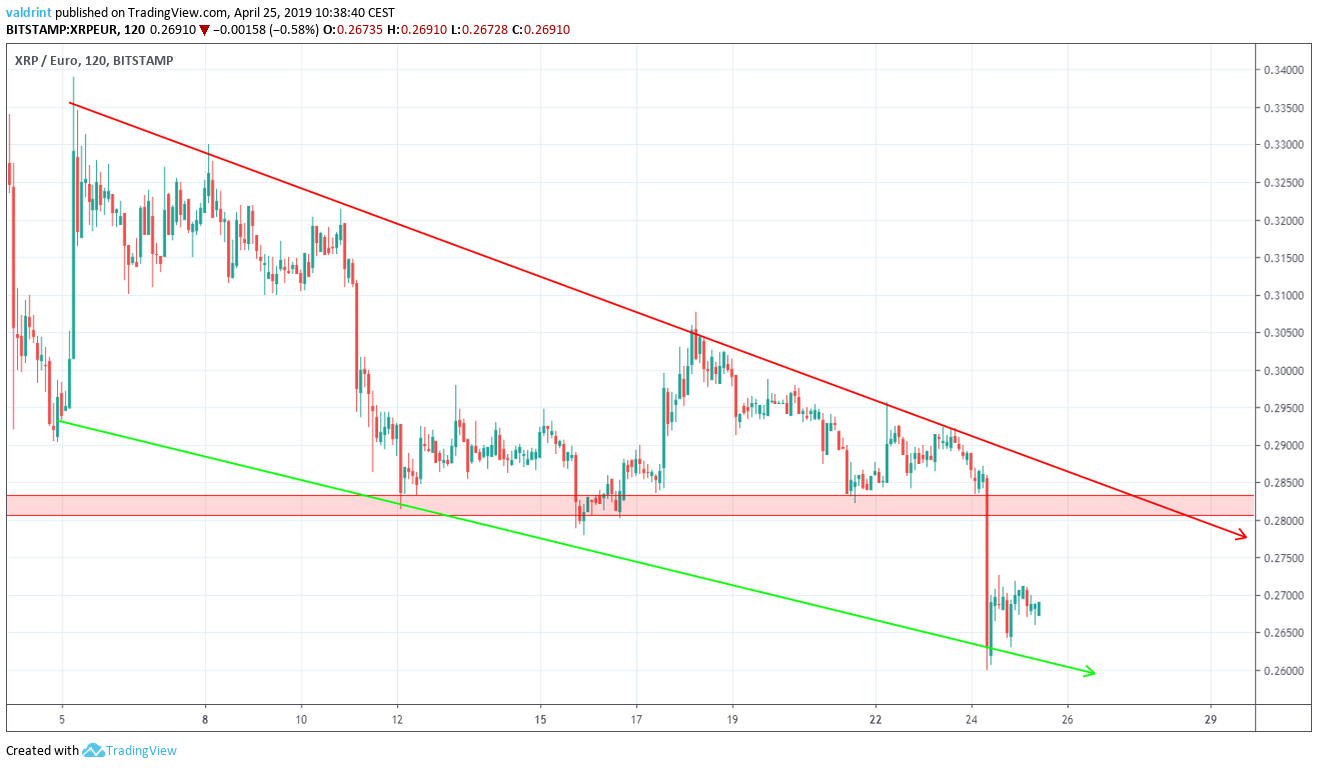
- There is resistance near $0.315 and €0.285.
Descending Channel
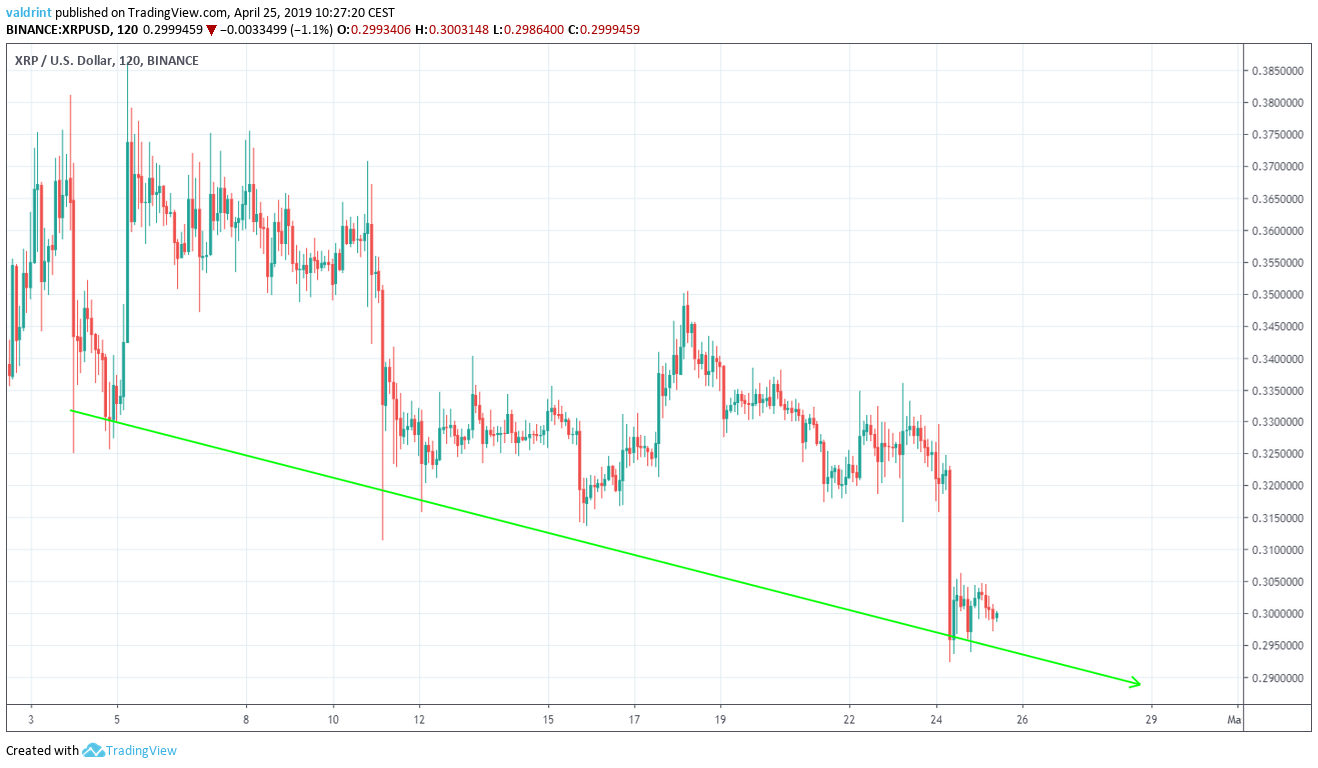
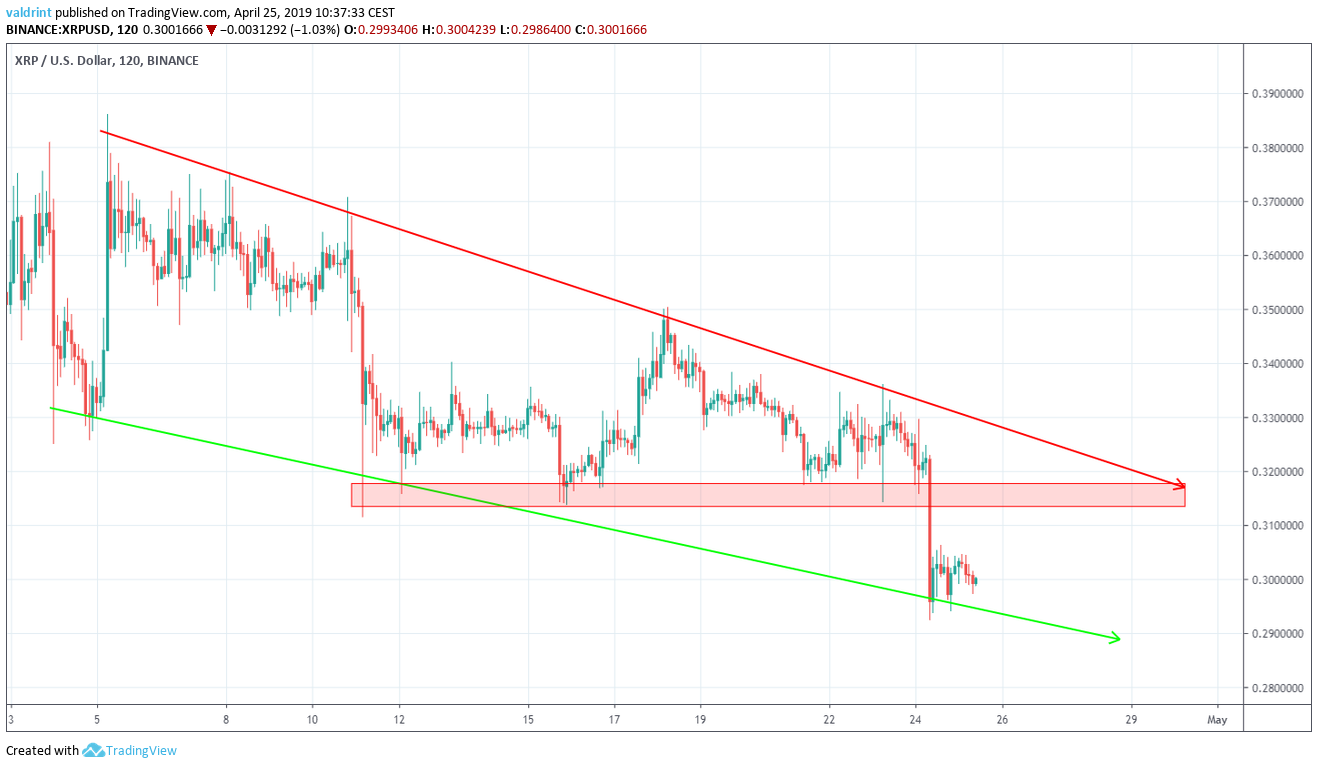
The price of XRP/USD on Binance is analyzed at two-hour intervals from Apr 4 to Apr 25 to help determine current trading patterns. We do not include euros in this section because only one trading pair is needed to generate the current trading pattern. Both XRP/USD and XRP/EUR are discussed in the final two sections.
On Apr 4, the price reached a low of $0.325. Several market cycles were subsequently completed. The price has created lower lows each time.
Tracing these lows gives us a descending support line:
 On Apr 5, the price reached a high of $0.386. At the time of writing, several lower highs had been reached.
A descending resistance line is created by tracing these highs.
Taken together, the resistance and support lines combine to create a descending channel:
On Apr 5, the price reached a high of $0.386. At the time of writing, several lower highs had been reached.
A descending resistance line is created by tracing these highs.
Taken together, the resistance and support lines combine to create a descending channel:
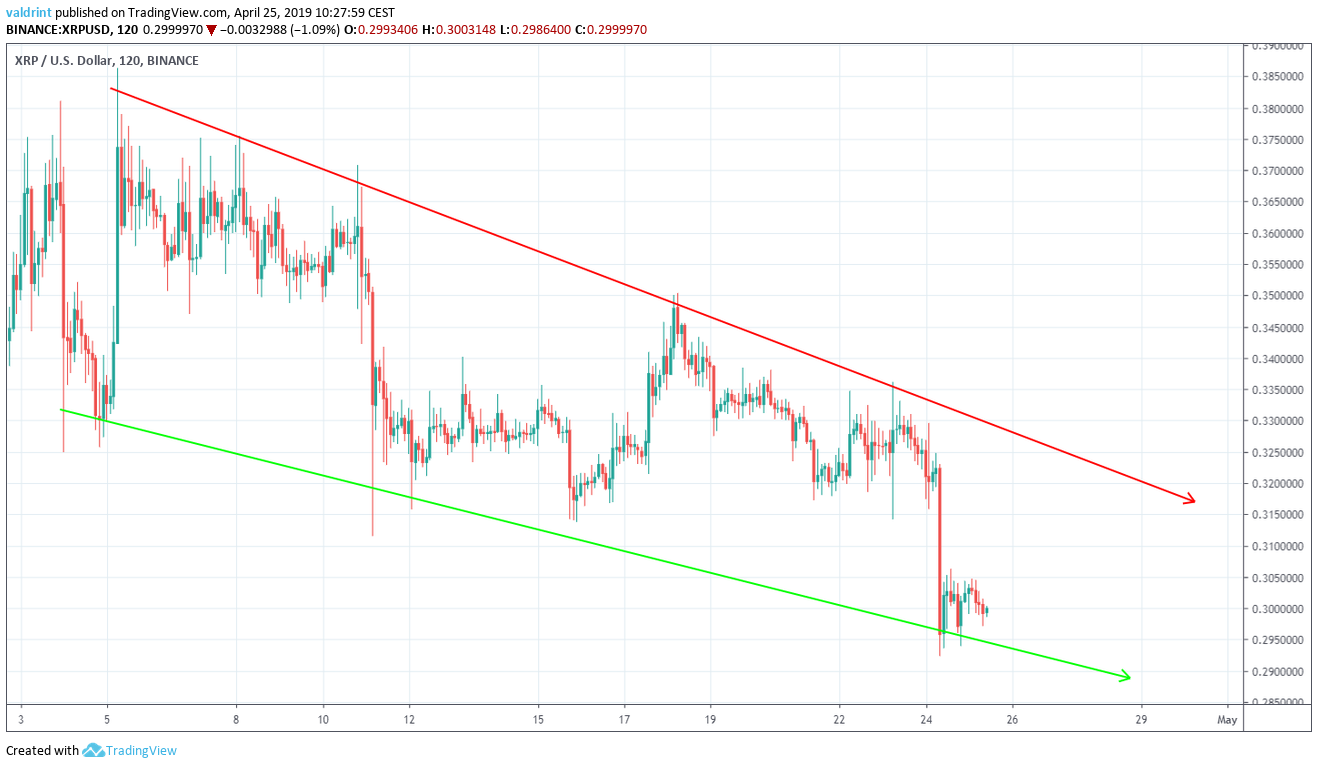 It is likely that the price will continue trading inside the confines of the channel until a decisive move occurs.
In order to predict the direction of the move, a look at technical indicators is required.
It is likely that the price will continue trading inside the confines of the channel until a decisive move occurs.
In order to predict the direction of the move, a look at technical indicators is required.
Technical Indicators
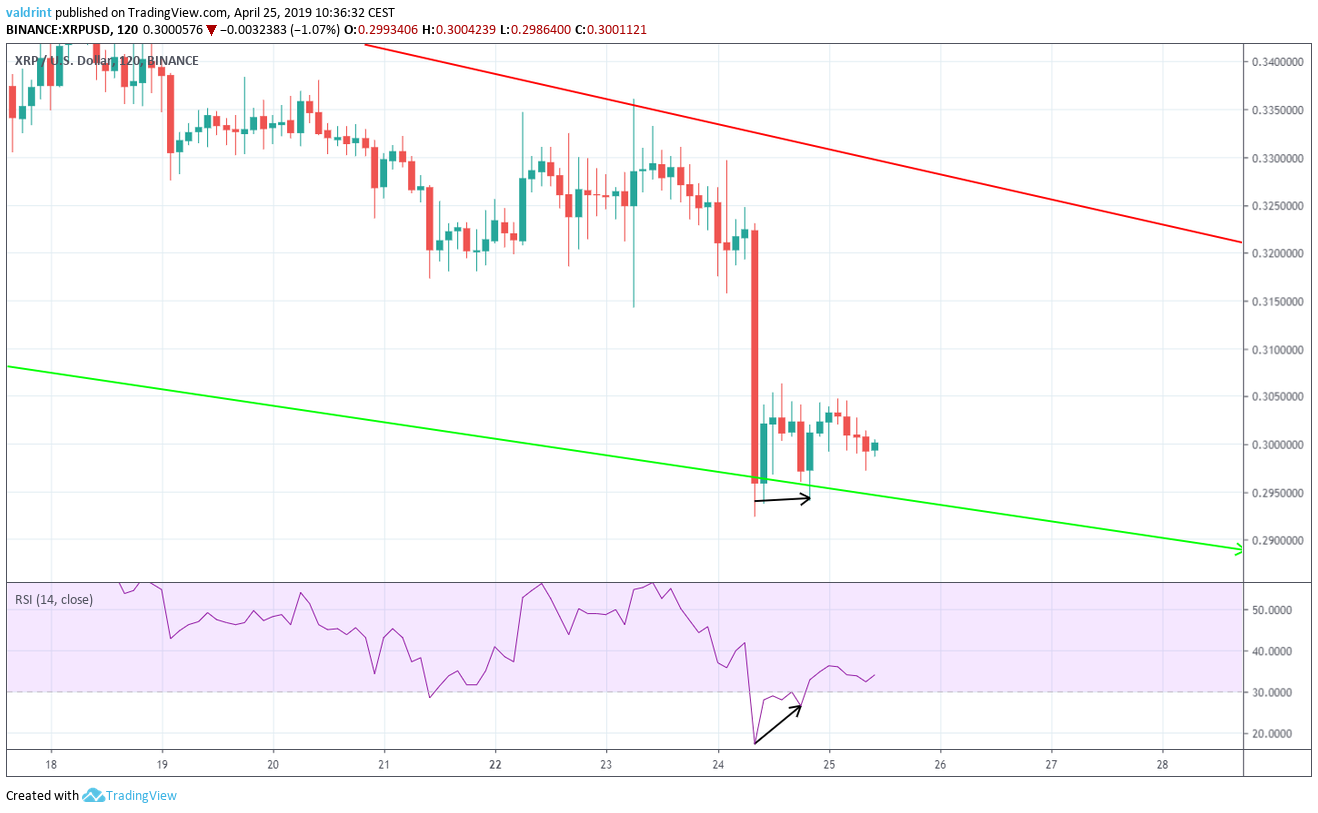
In this section, we incorporate RSI to predict possible future price movements for XRP.
The relative strength index (RSI) is an indicator which calculates the size of the changes in price in order to determine oversold or overbought conditions in the market.
The price of XRP/USD is analyzed alongside the RSI below:
 The price has been following an ascending support line since Dec 2018.
Based on this indicator and previous price movements, we believe that XRP may make a reversal and move toward the resistance line. Nonetheless, the price may continue dropping after the resistance is reached.
The price has been following an ascending support line since Dec 2018.
Based on this indicator and previous price movements, we believe that XRP may make a reversal and move toward the resistance line. Nonetheless, the price may continue dropping after the resistance is reached.
Reversal Areas
We now incorporate resistance areas into our analysis to better determine future price fluctuations.Resistance and support areas are created when the price visits the same level several times. They can act as an area of reversal in case a breakdown or a breakout occurs.
One resistance area is traced below for both XRP in both dollars and euros in the graphs below:
Summary of Analysis
Based on this analysis, XRP is likely to increase toward the resistance line of the wedge. Prices of over $0.31 and €0.28 may be expected in the near future. After these levels are reached, the price may drop back to current levels or lower. For price 2019, 2020, and five-year Ripple price predictions click on the green button below: Disclaimer: This article is not trading advice and should not be construed as such. Always consult a trained financial professional before investing in cryptocurrencies, as the market is particularly volatile.
Top crypto platforms in the US
Disclaimer
In line with the Trust Project guidelines, this price analysis article is for informational purposes only and should not be considered financial or investment advice. BeInCrypto is committed to accurate, unbiased reporting, but market conditions are subject to change without notice. Always conduct your own research and consult with a professional before making any financial decisions. Please note that our Terms and Conditions, Privacy Policy, and Disclaimers have been updated.

Valdrin Tahiri
Valdrin discovered cryptocurrencies while he was getting his MSc in Financial Markets from the Barcelona School of Economics. Shortly after graduating, he began writing for several different cryptocurrency related websites as a freelancer before eventually taking on the role of BeInCrypto's Senior Analyst.
(I do not have a discord and will not contact you first there. Beware of scammers)
READ FULL BIO
Sponsored
Sponsored