


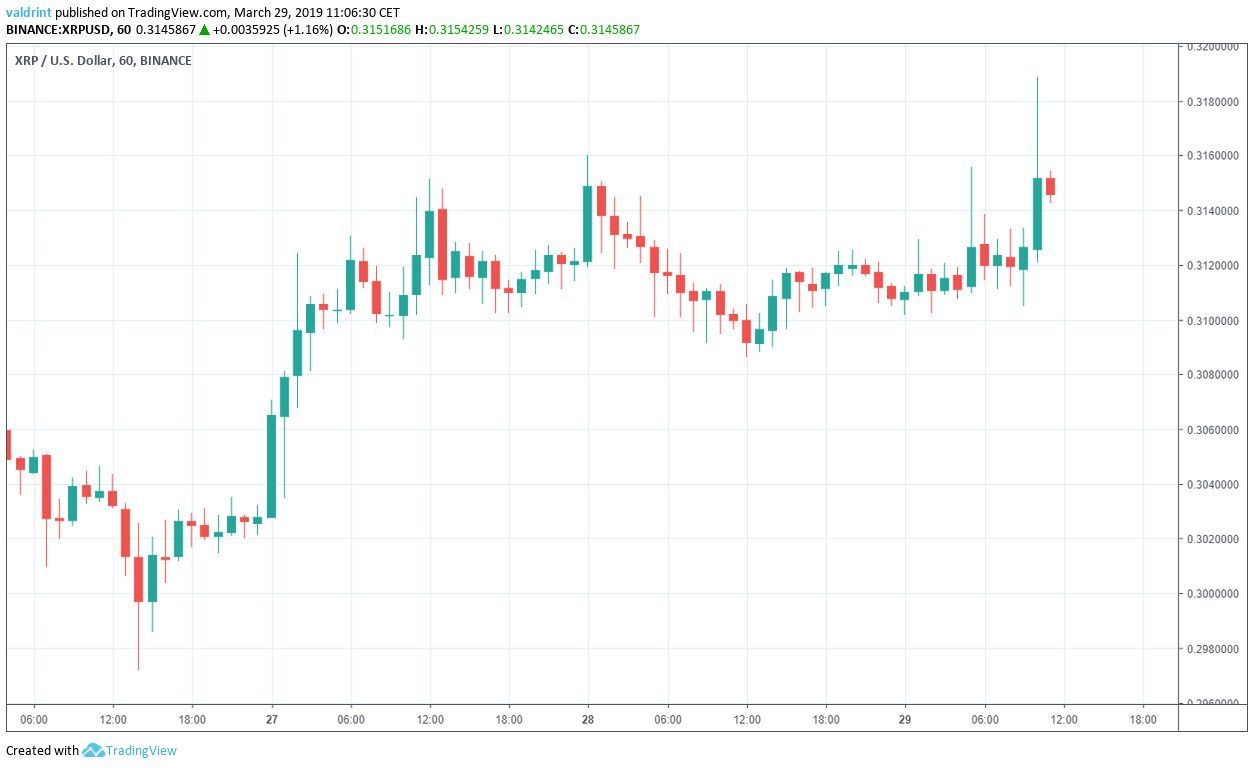
On March 26, 2019, the price of XRP (XRP) reached a low of $0.297. Since then, it has been gradually increasing.
Highs of nearly $0.32 were reached on Mar 28.
Can we expect XRP to reach $0.35 or will it fall back under $0.30 again?
XRP (XRP): Trends and Highlights for March 29, 2019
- The price of XRP has been on an uptrend since Mar 26.
- XRP is trading inside a horizontal channel.
- There is bearish divergence developing in the RSI and the MACD.
- There are resistance areas near $0.325 and $0.316.
- There is support near $0.302.
Horizontal Channel
The price of XRP on Binance is analyzed at one-hour intervals from Mar 25 to Mar 28.
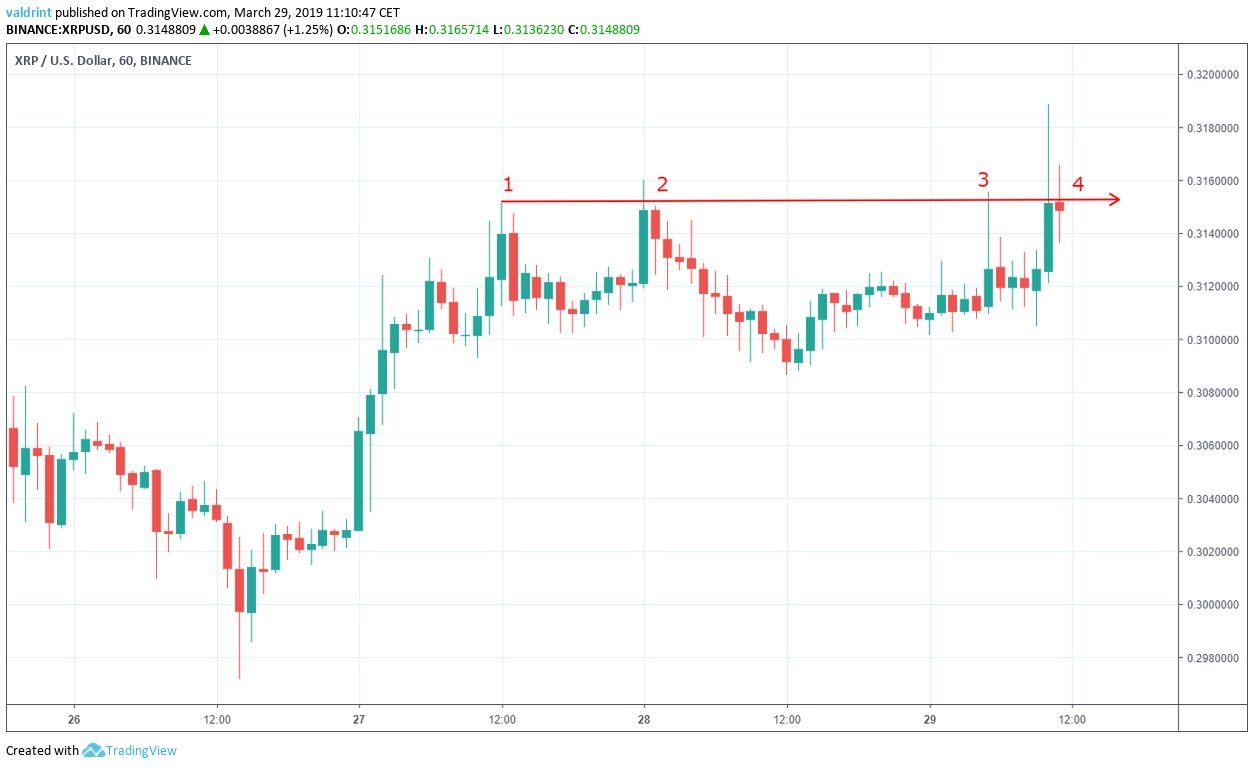
The price reached a high of $0.315 on Mar 27. A gradual downtrend followed. The price has reached the same level four times.
Tracing these highs gives us a horizontal resistance line:
XRP reached a low of $0.309 on Mar 27. A gradual uptrend ensued. Since then, the price has revisited the same level three times.
Tracing these lows gives us a horizontal support line.
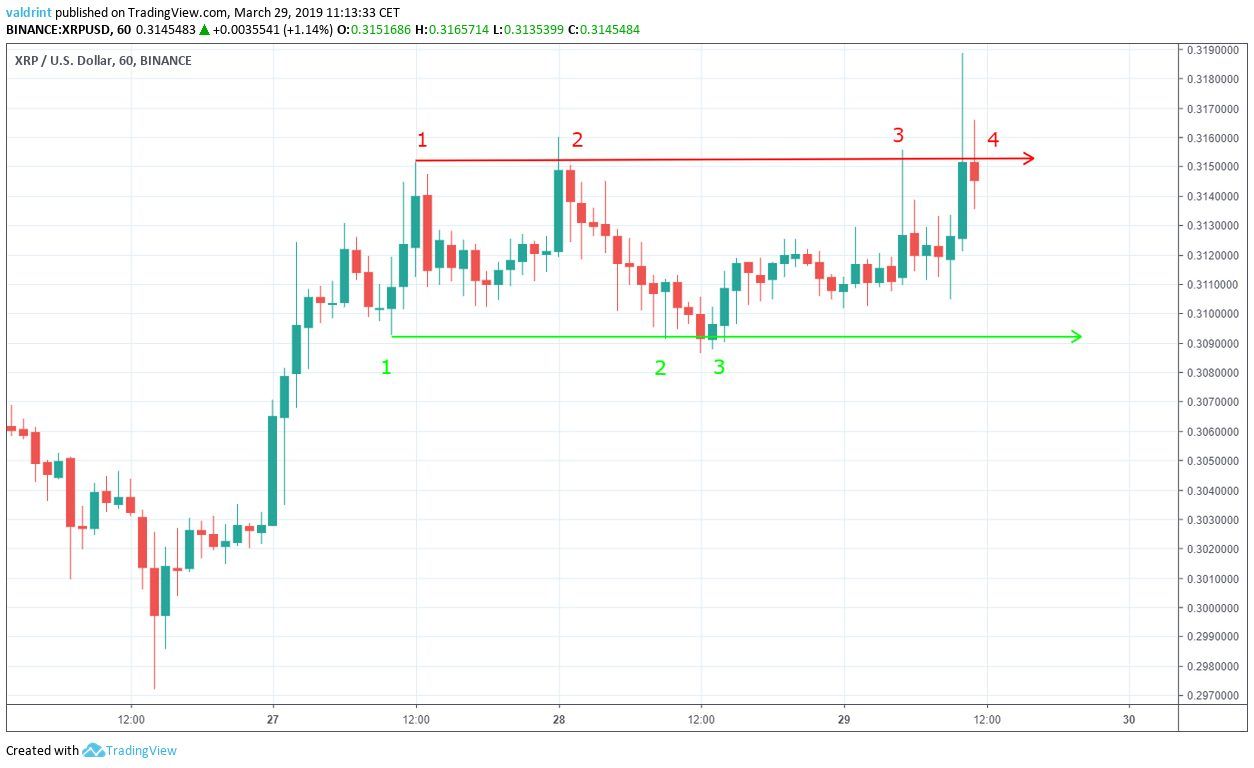
The resistance and support lines combine to create a horizontal channel. This is a neutral pattern with long-term price gain and losses expected within the channel. If XRP continues trading within this channel, a high of $0.35 appears unlikely.
It is likely that the price will continue trading within the confines of the channel until a decisive upward or downward move occurs.
Future Movement
To better determine future possible price fluctuations for XRP, we integrate technical indicators into our analysis.
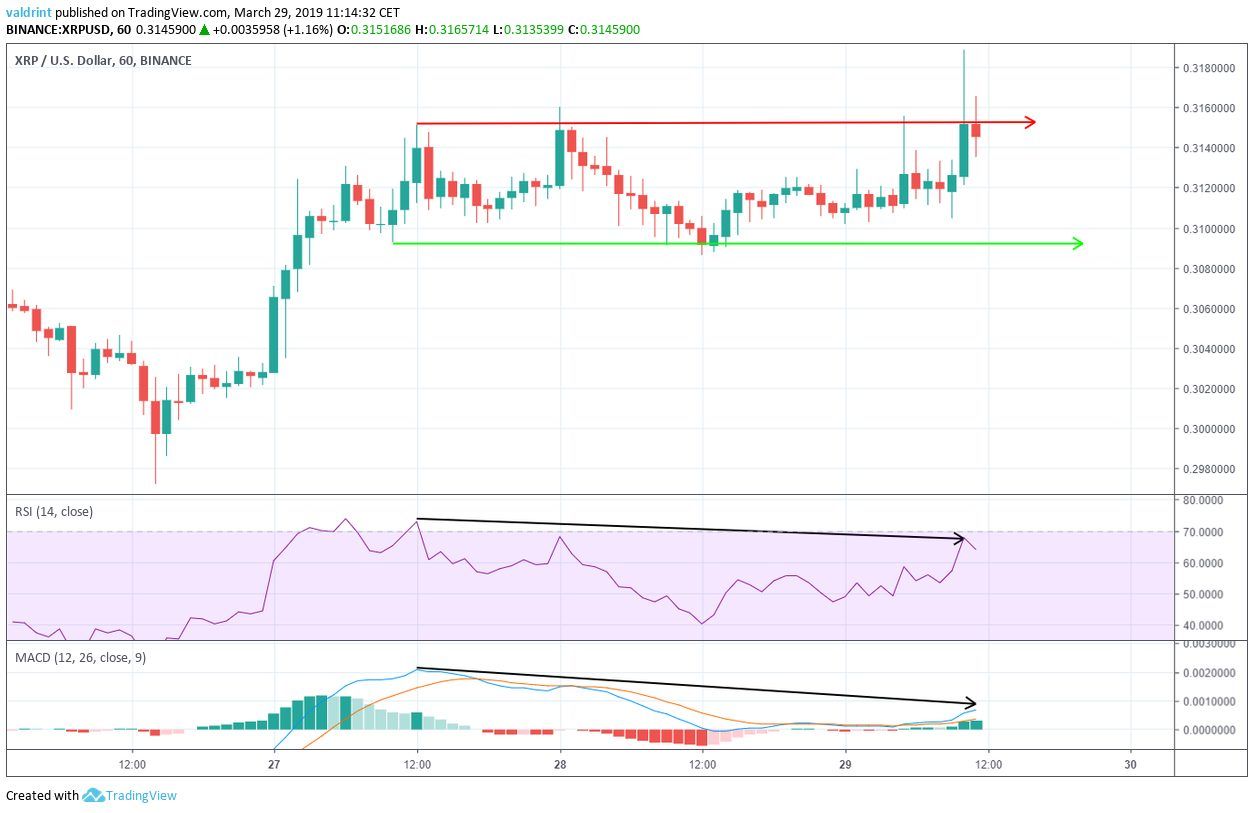
On Mar 27, the price reached a high of $0.315. On Mar 29, it made a higher high of $0.319, before closing at $0.315
Similarly, the RSI and the MACD made the first high on Mar 27. However, they have proceeded to generate lower values since.
This is known as bearish divergence and often precedes price decreases. The possibility of a drop toward support appears likely.
Resistance and Support
To better assess possible reversal areas in the future, the price of XRP on Binance is analyzed at six-hour intervals from Feb 25 to Mar 29
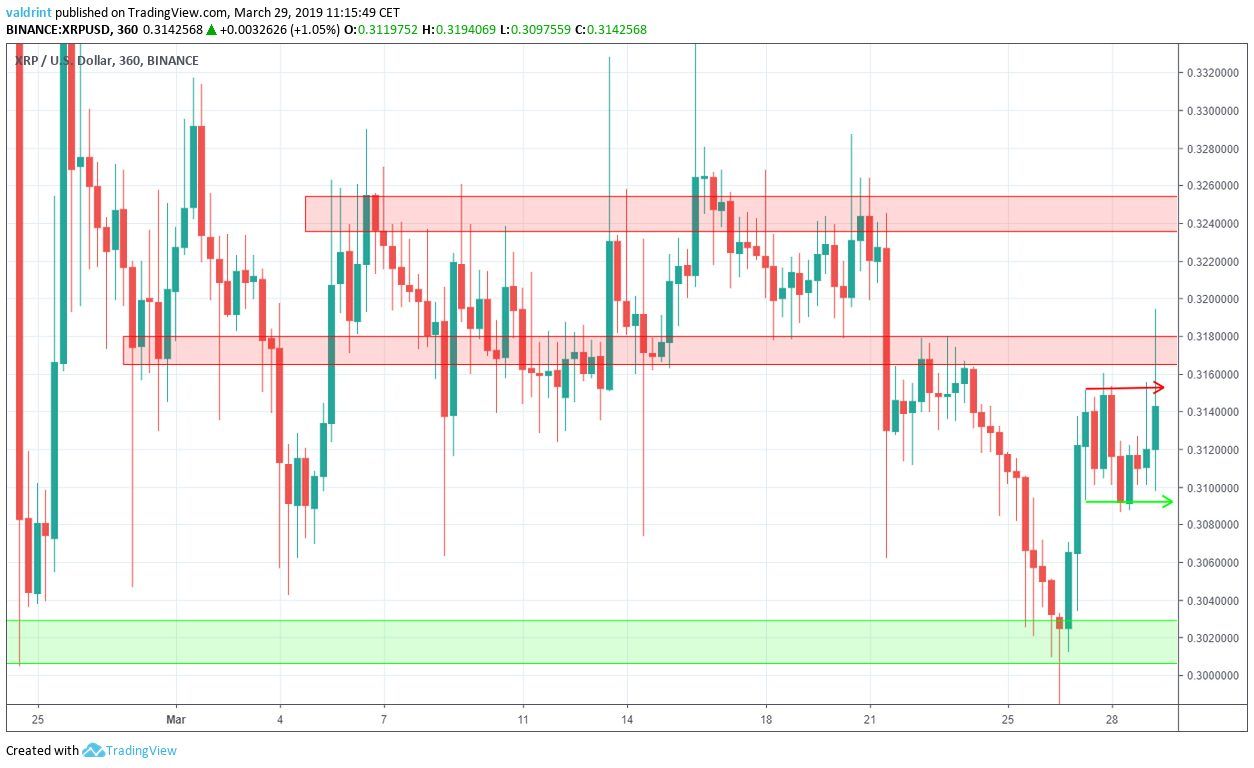
There are two visible resistance areas, near $0.325 and $0.317. If the price continues to increase, XRP may reach these areas. According to our analysis, this is unlikely.
The closest support area is found near $0.302. If the price breaks down from the channel, it is likely that it will reach this area.
Summary of Analysis
Based on this analysis, the price of XRP is likely to drop to the support area of the channel and possibly break down. A high of $0.35 does not appear likely. On the contrary, price may drop closer to $0.30 before a subsequent rise back toward the resistance line.
Do you think the price of XRP will break down from the channel? Let us know in the comments below.
Disclaimer: This article is not trading advice and should not be construed as such. Always consult a trained financial professional before investing in cryptocurrencies, as the market is particularly volatile.


