
XRP price has dropped nearly 14% in the past week and 3.6% in the last 24 hours, even as exchange outflows jump sharply. At first glance, that looks like an accumulation — but deeper signals suggest the latest buying wave could be a trap.
While retail enthusiasm is clear, the largest investor groups and key technical patterns are sending a warning that XRP’s bounce might not last.
Key Groups Are Reducing Exposure, Not Accumulating
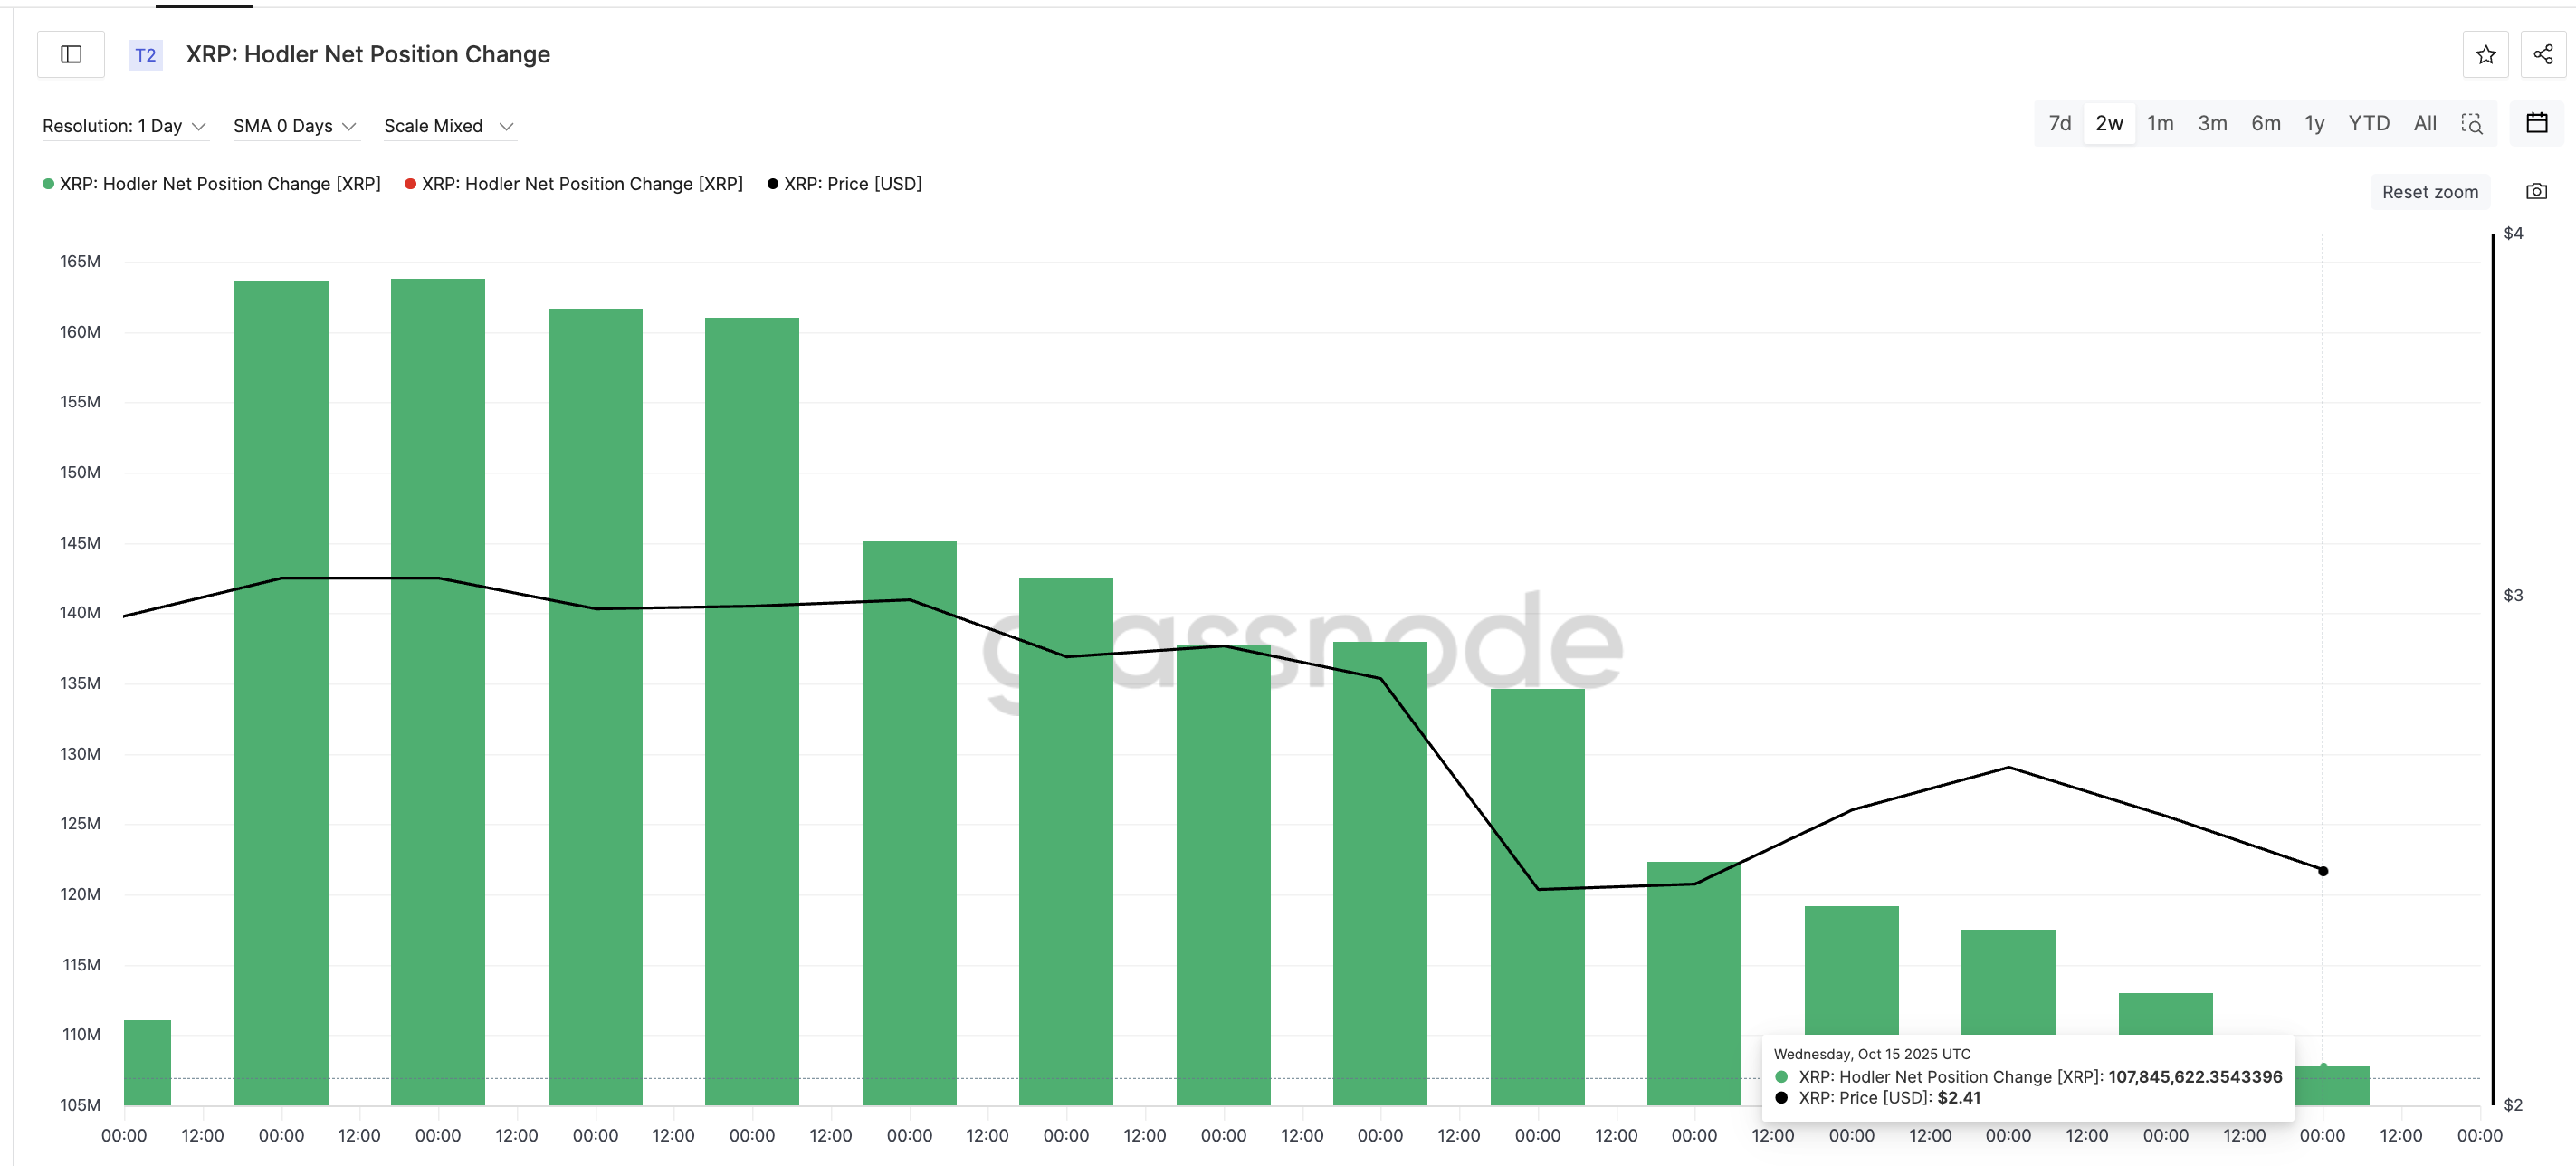
The Hodler Net Position Change, which tracks how much long-term investors are adding or selling, has declined sharply in the past two weeks. Between October 2 and October 15, holdings dropped from 163.68 million XRP to 107.84 million XRP, a 34% fall. This means long-term holders are exiting rather than positioning for recovery.
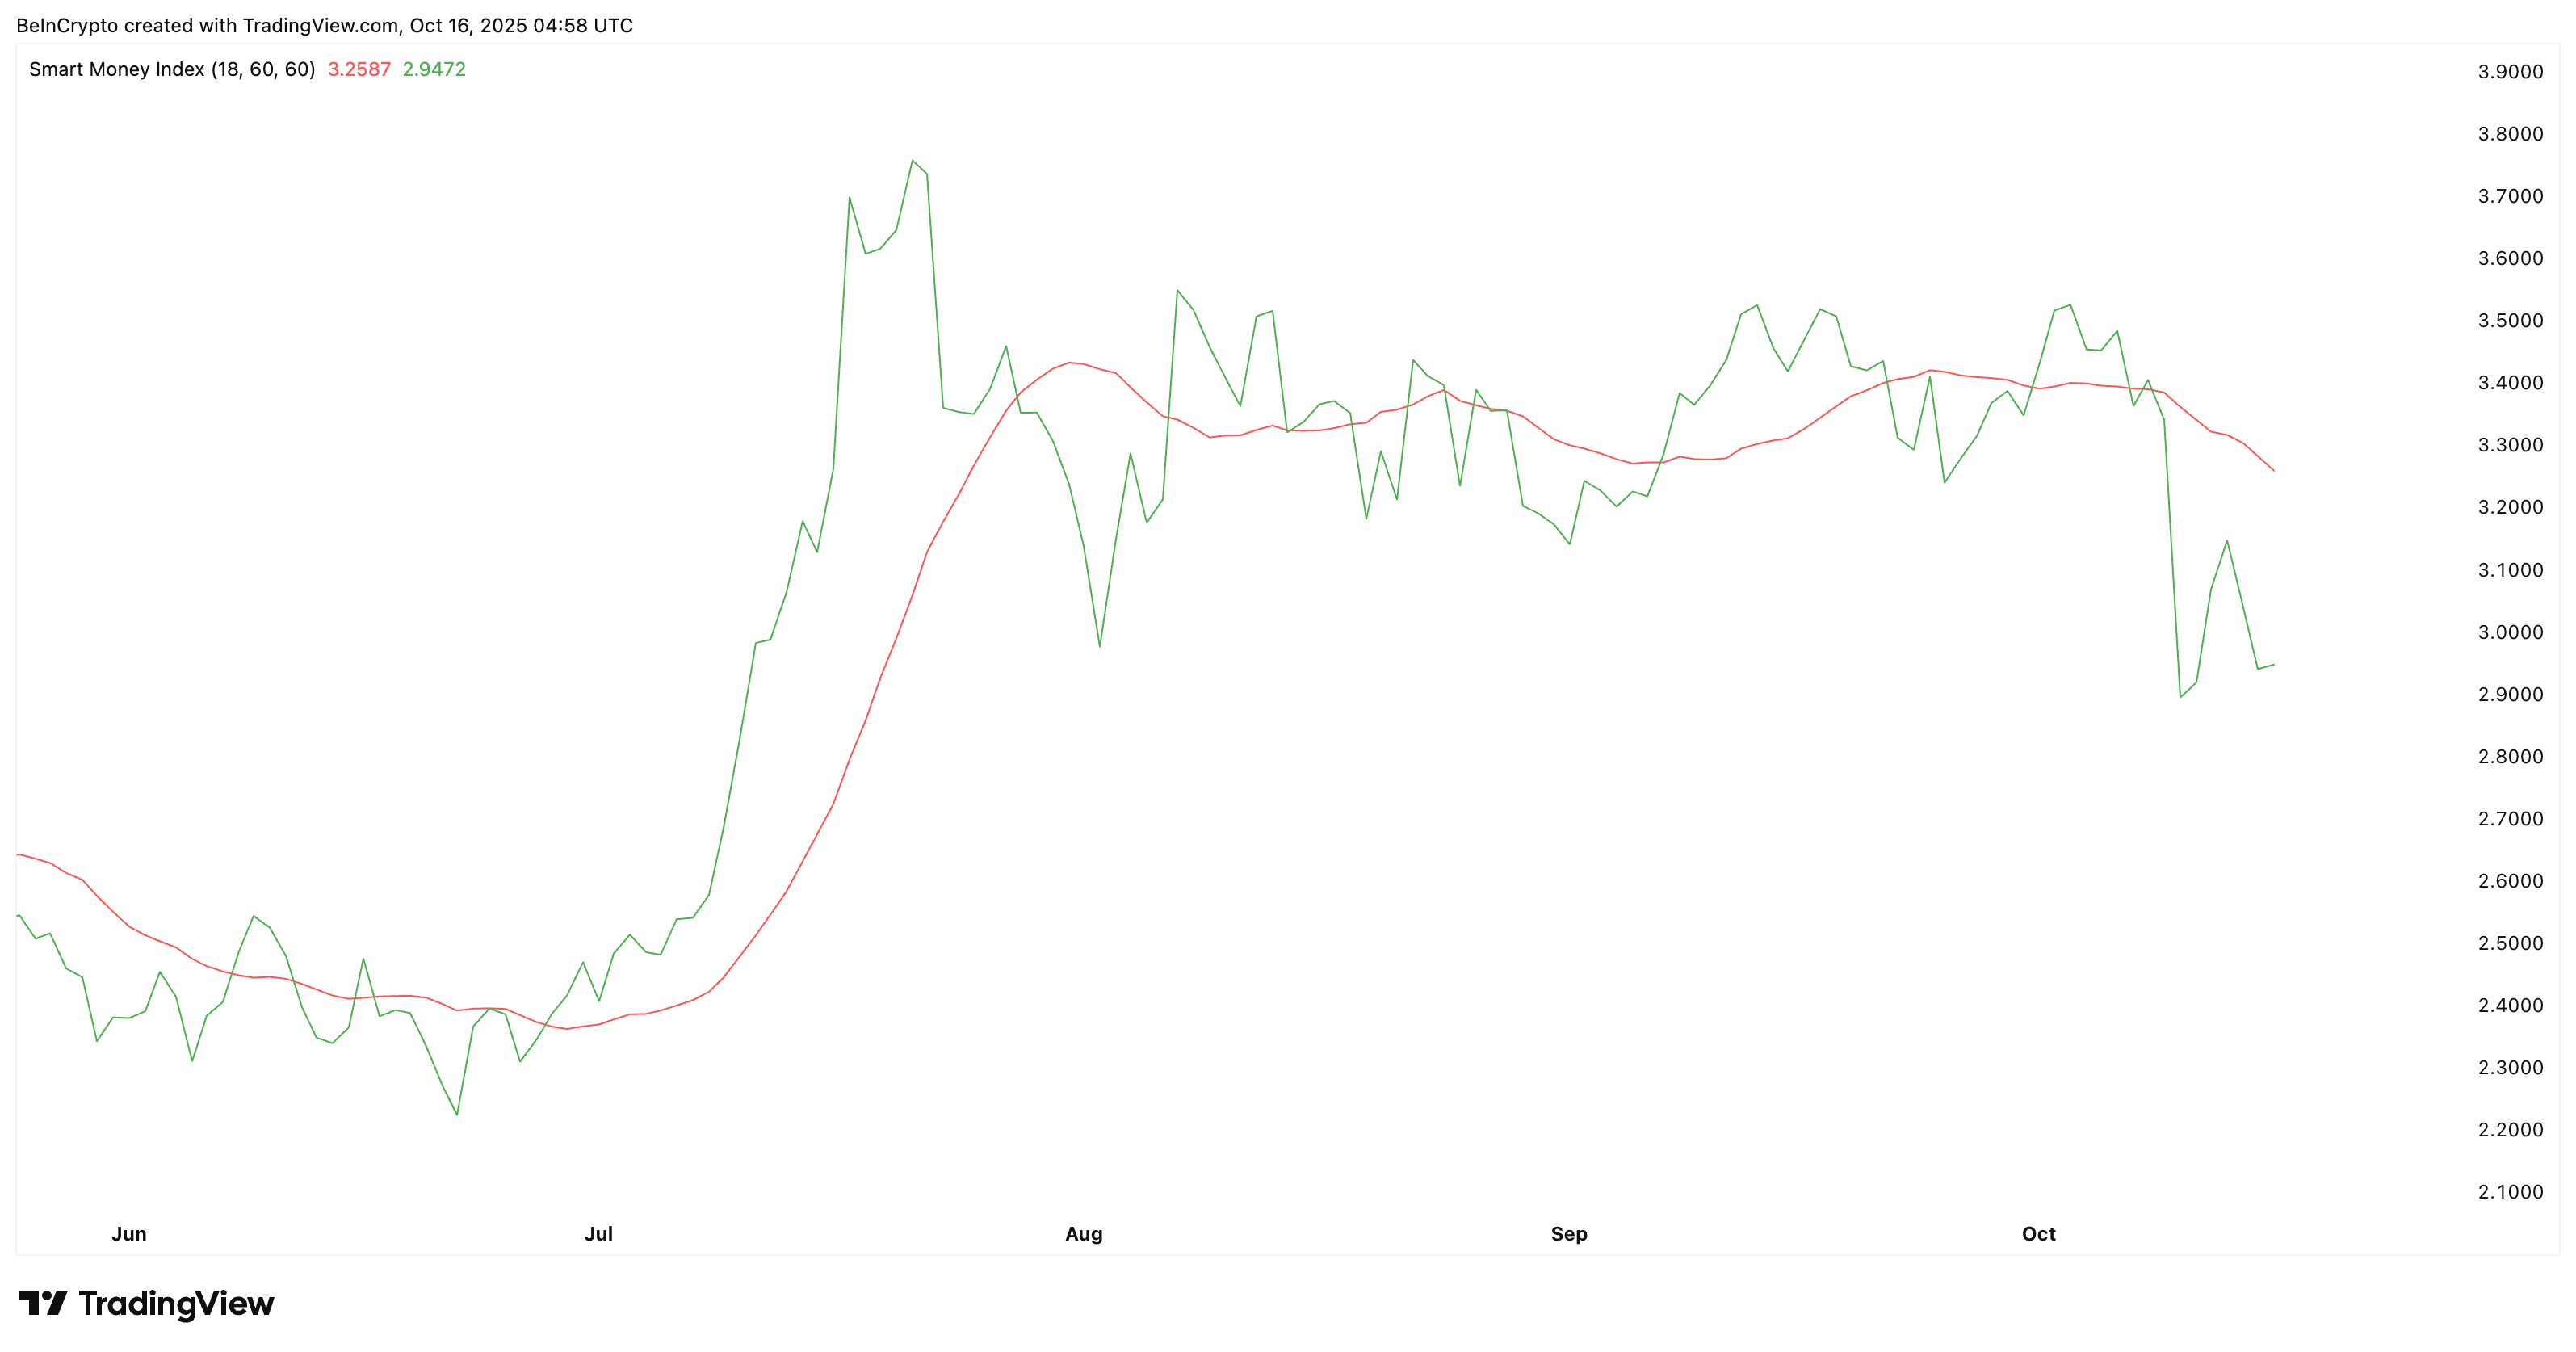
Two additional metrics back this up. The Smart Money Index (SMI), which tracks how experienced traders are positioning, has dropped to its second-lowest level since early October. This shows that rebound confidence is fading.
Want more token insights like this? Sign up for Editor Harsh Notariya’s Daily Crypto Newsletter here.
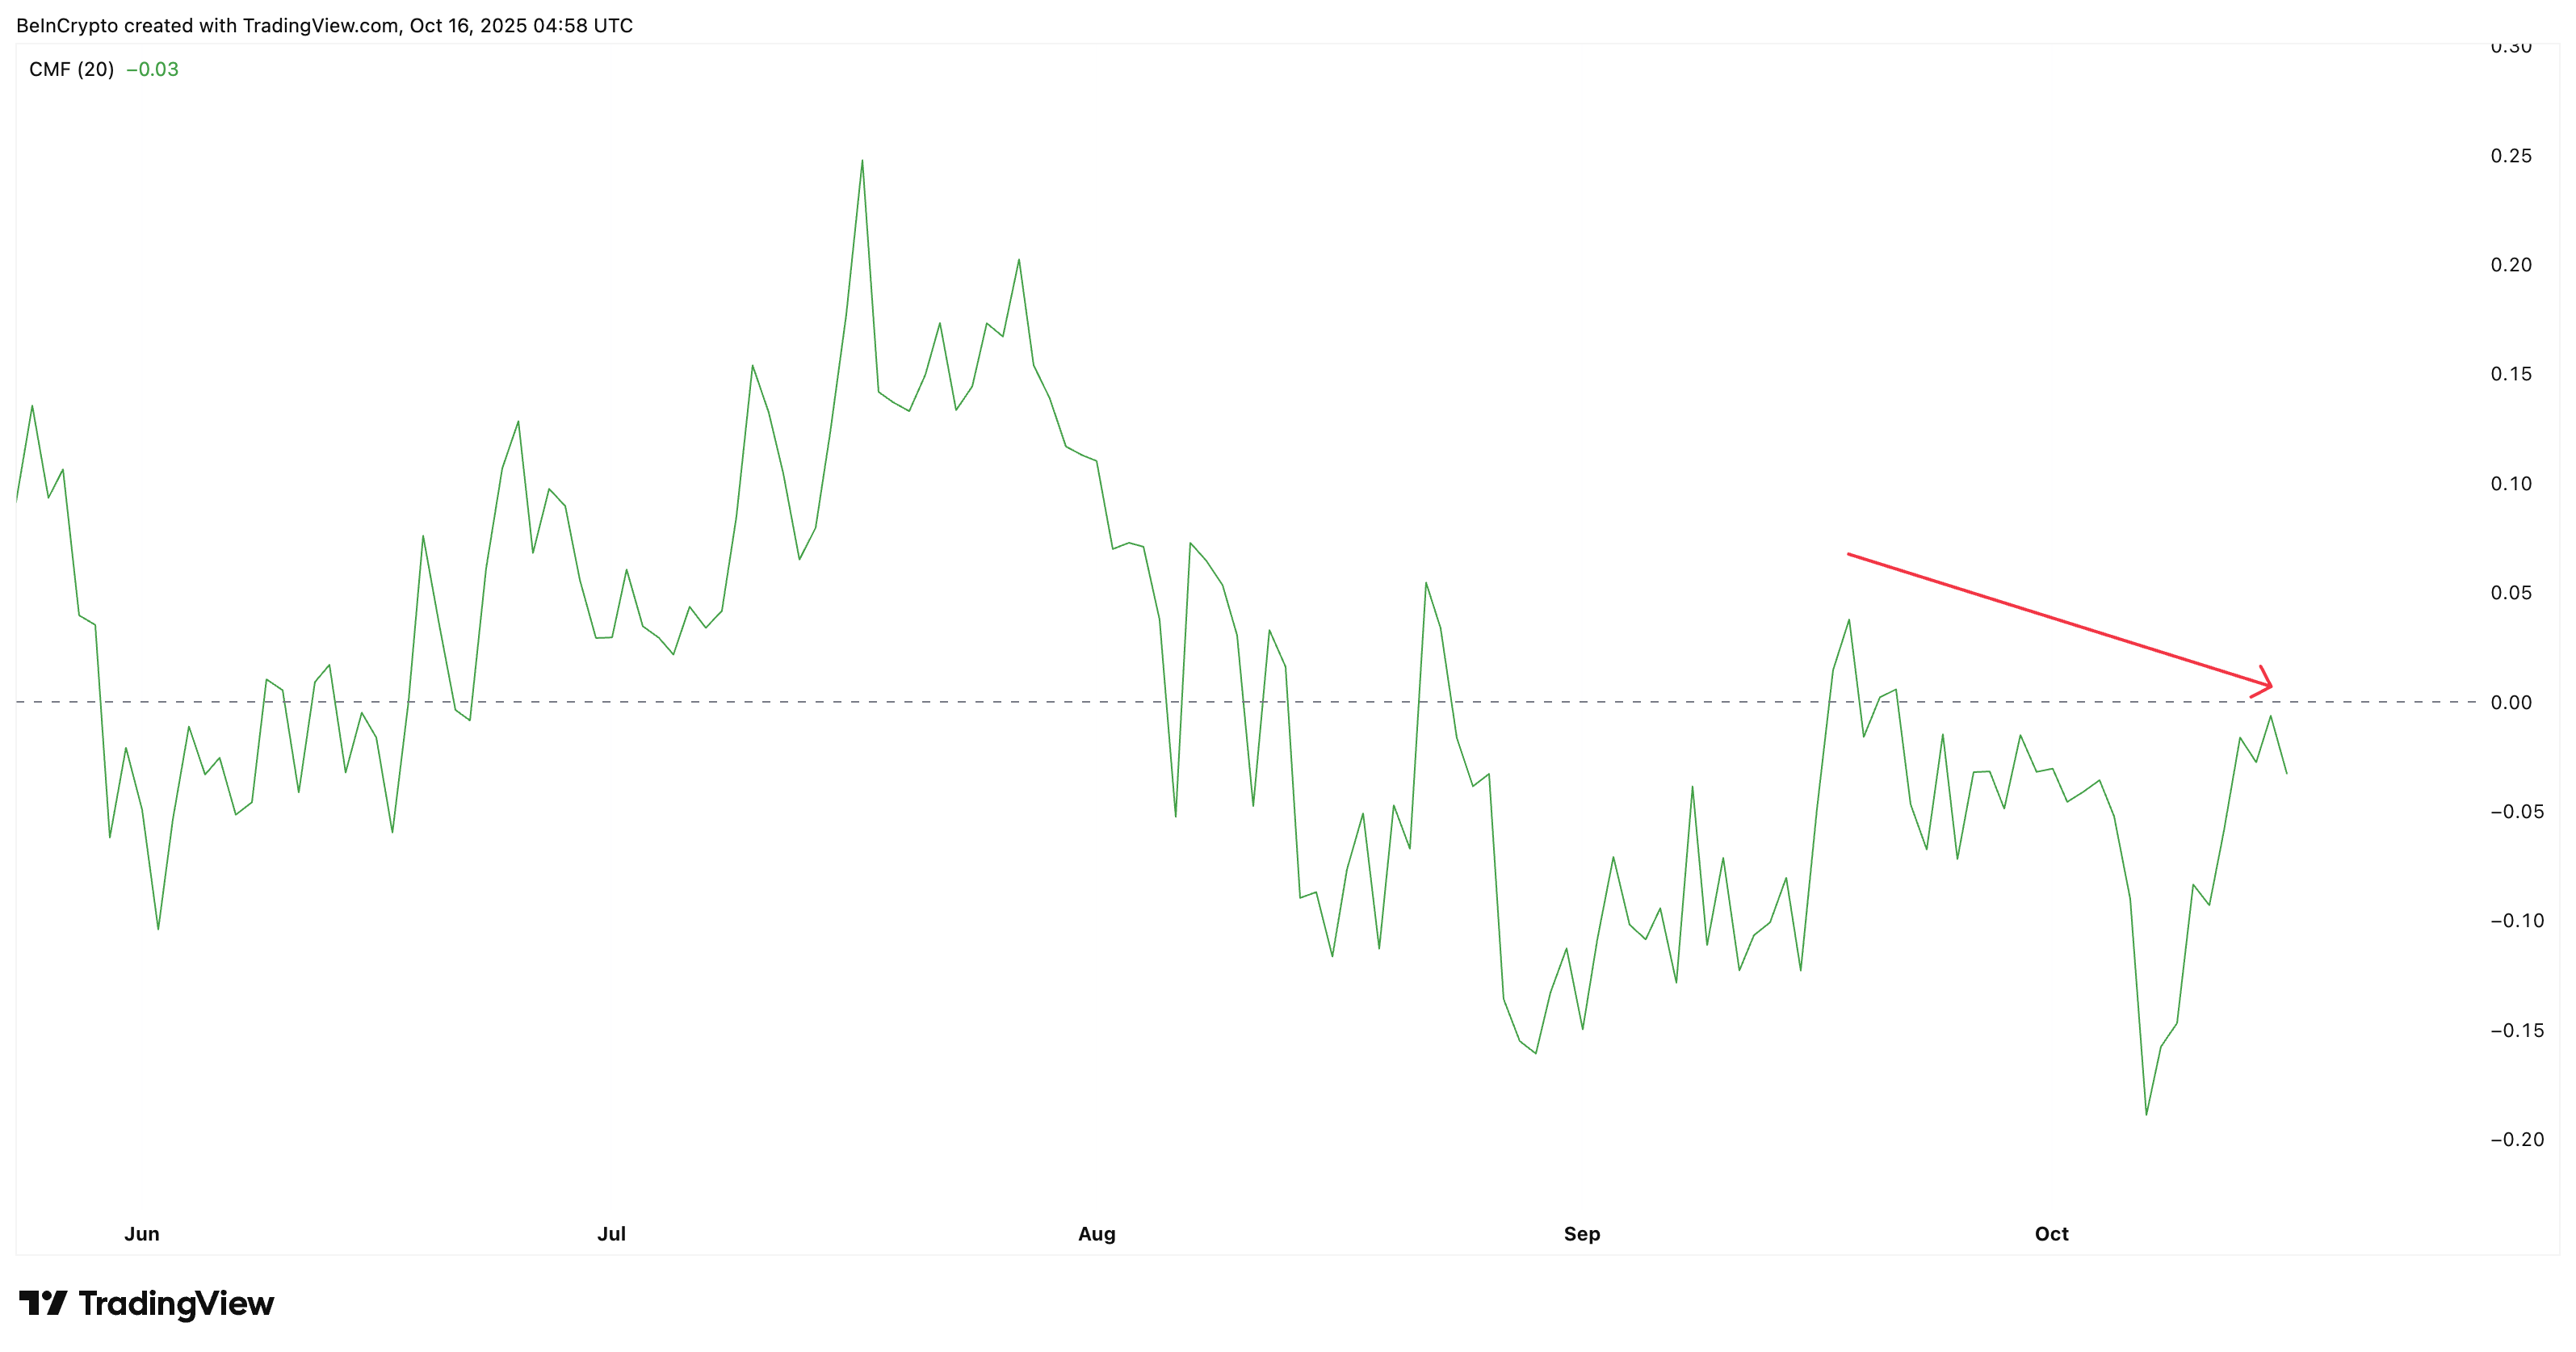
The Chaikin Money Flow (CMF), which tracks how much money large wallets are adding or removing, remains below zero. It is a key signal that big wallets aren’t buying the dip aggressively enough.
Together, these indicators show large players are stepping back, even as price volatility draws in several traders.
Exchange Outflows Rise — But It May Be Retail Buying the Top
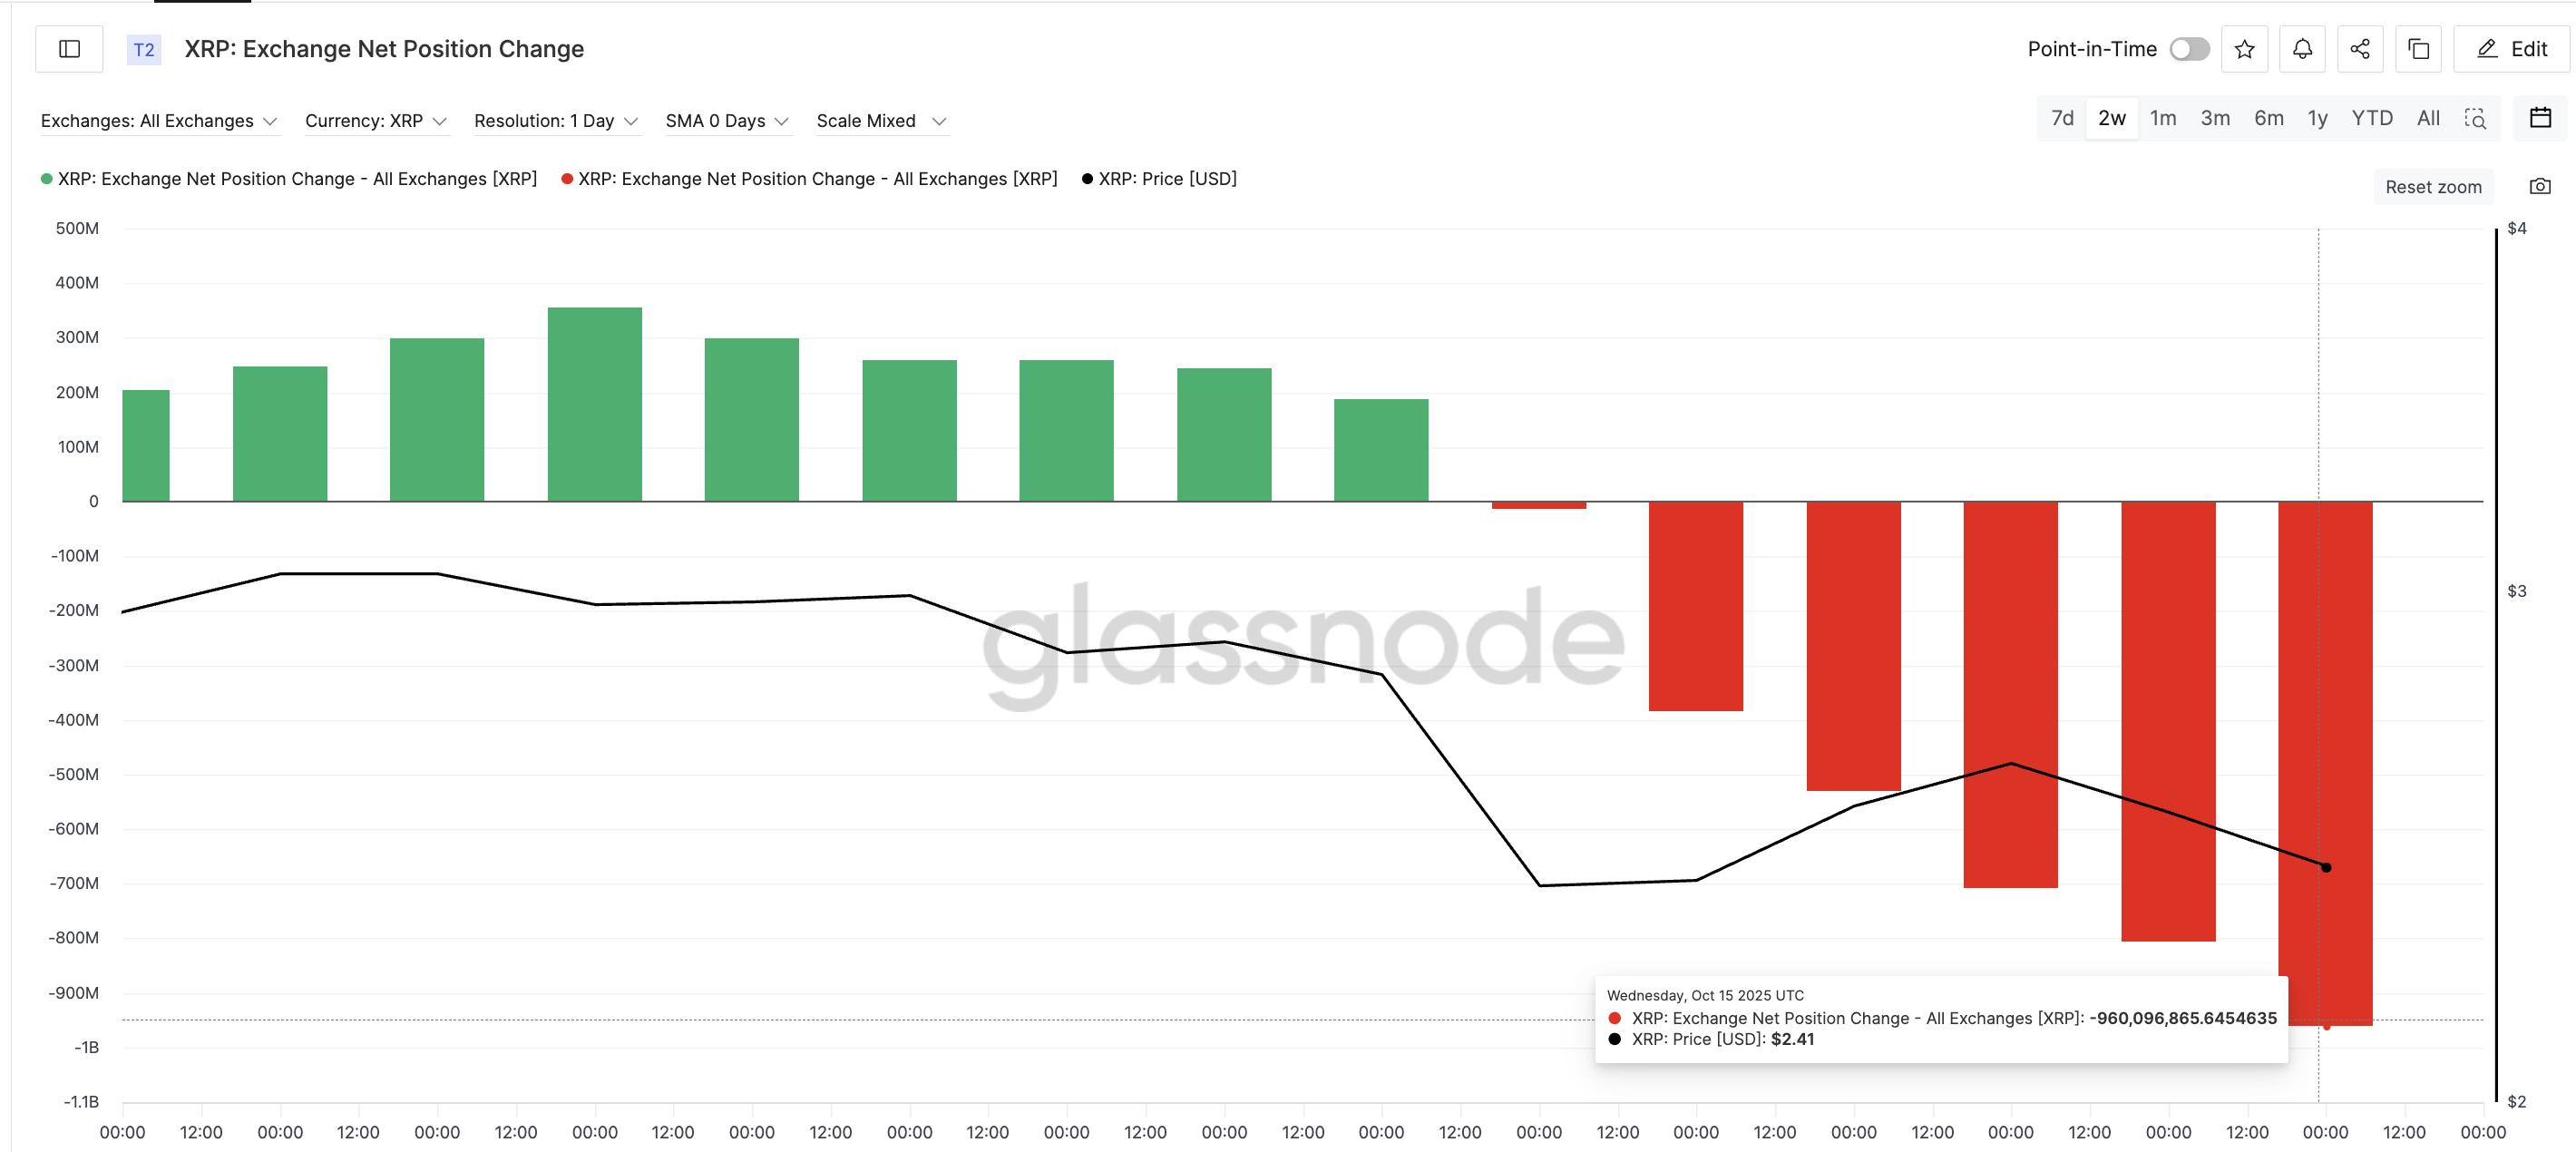
Despite weak conviction among large holders, exchange outflows have surged, often seen as a bullish signal. The Exchange Net Position Change, which measures how much XRP is moving in or out of exchanges, has deepened from –12.7 million XRP on October 10 to –960 million XRP on October 15 — a 7,400+% increase in outflows. That usually means investors are moving tokens out of exchanges, reducing immediate sell pressure.
But here, it could be misleading. Since long-term holders, whales, and smart money are staying on the sidelines, this activity likely reflects possible retail accumulation — smaller investors chasing the bounce.
Historically, when buying momentum is led by retail without whale support, the rally tends to fade quickly, trapping late buyers as prices reverse.
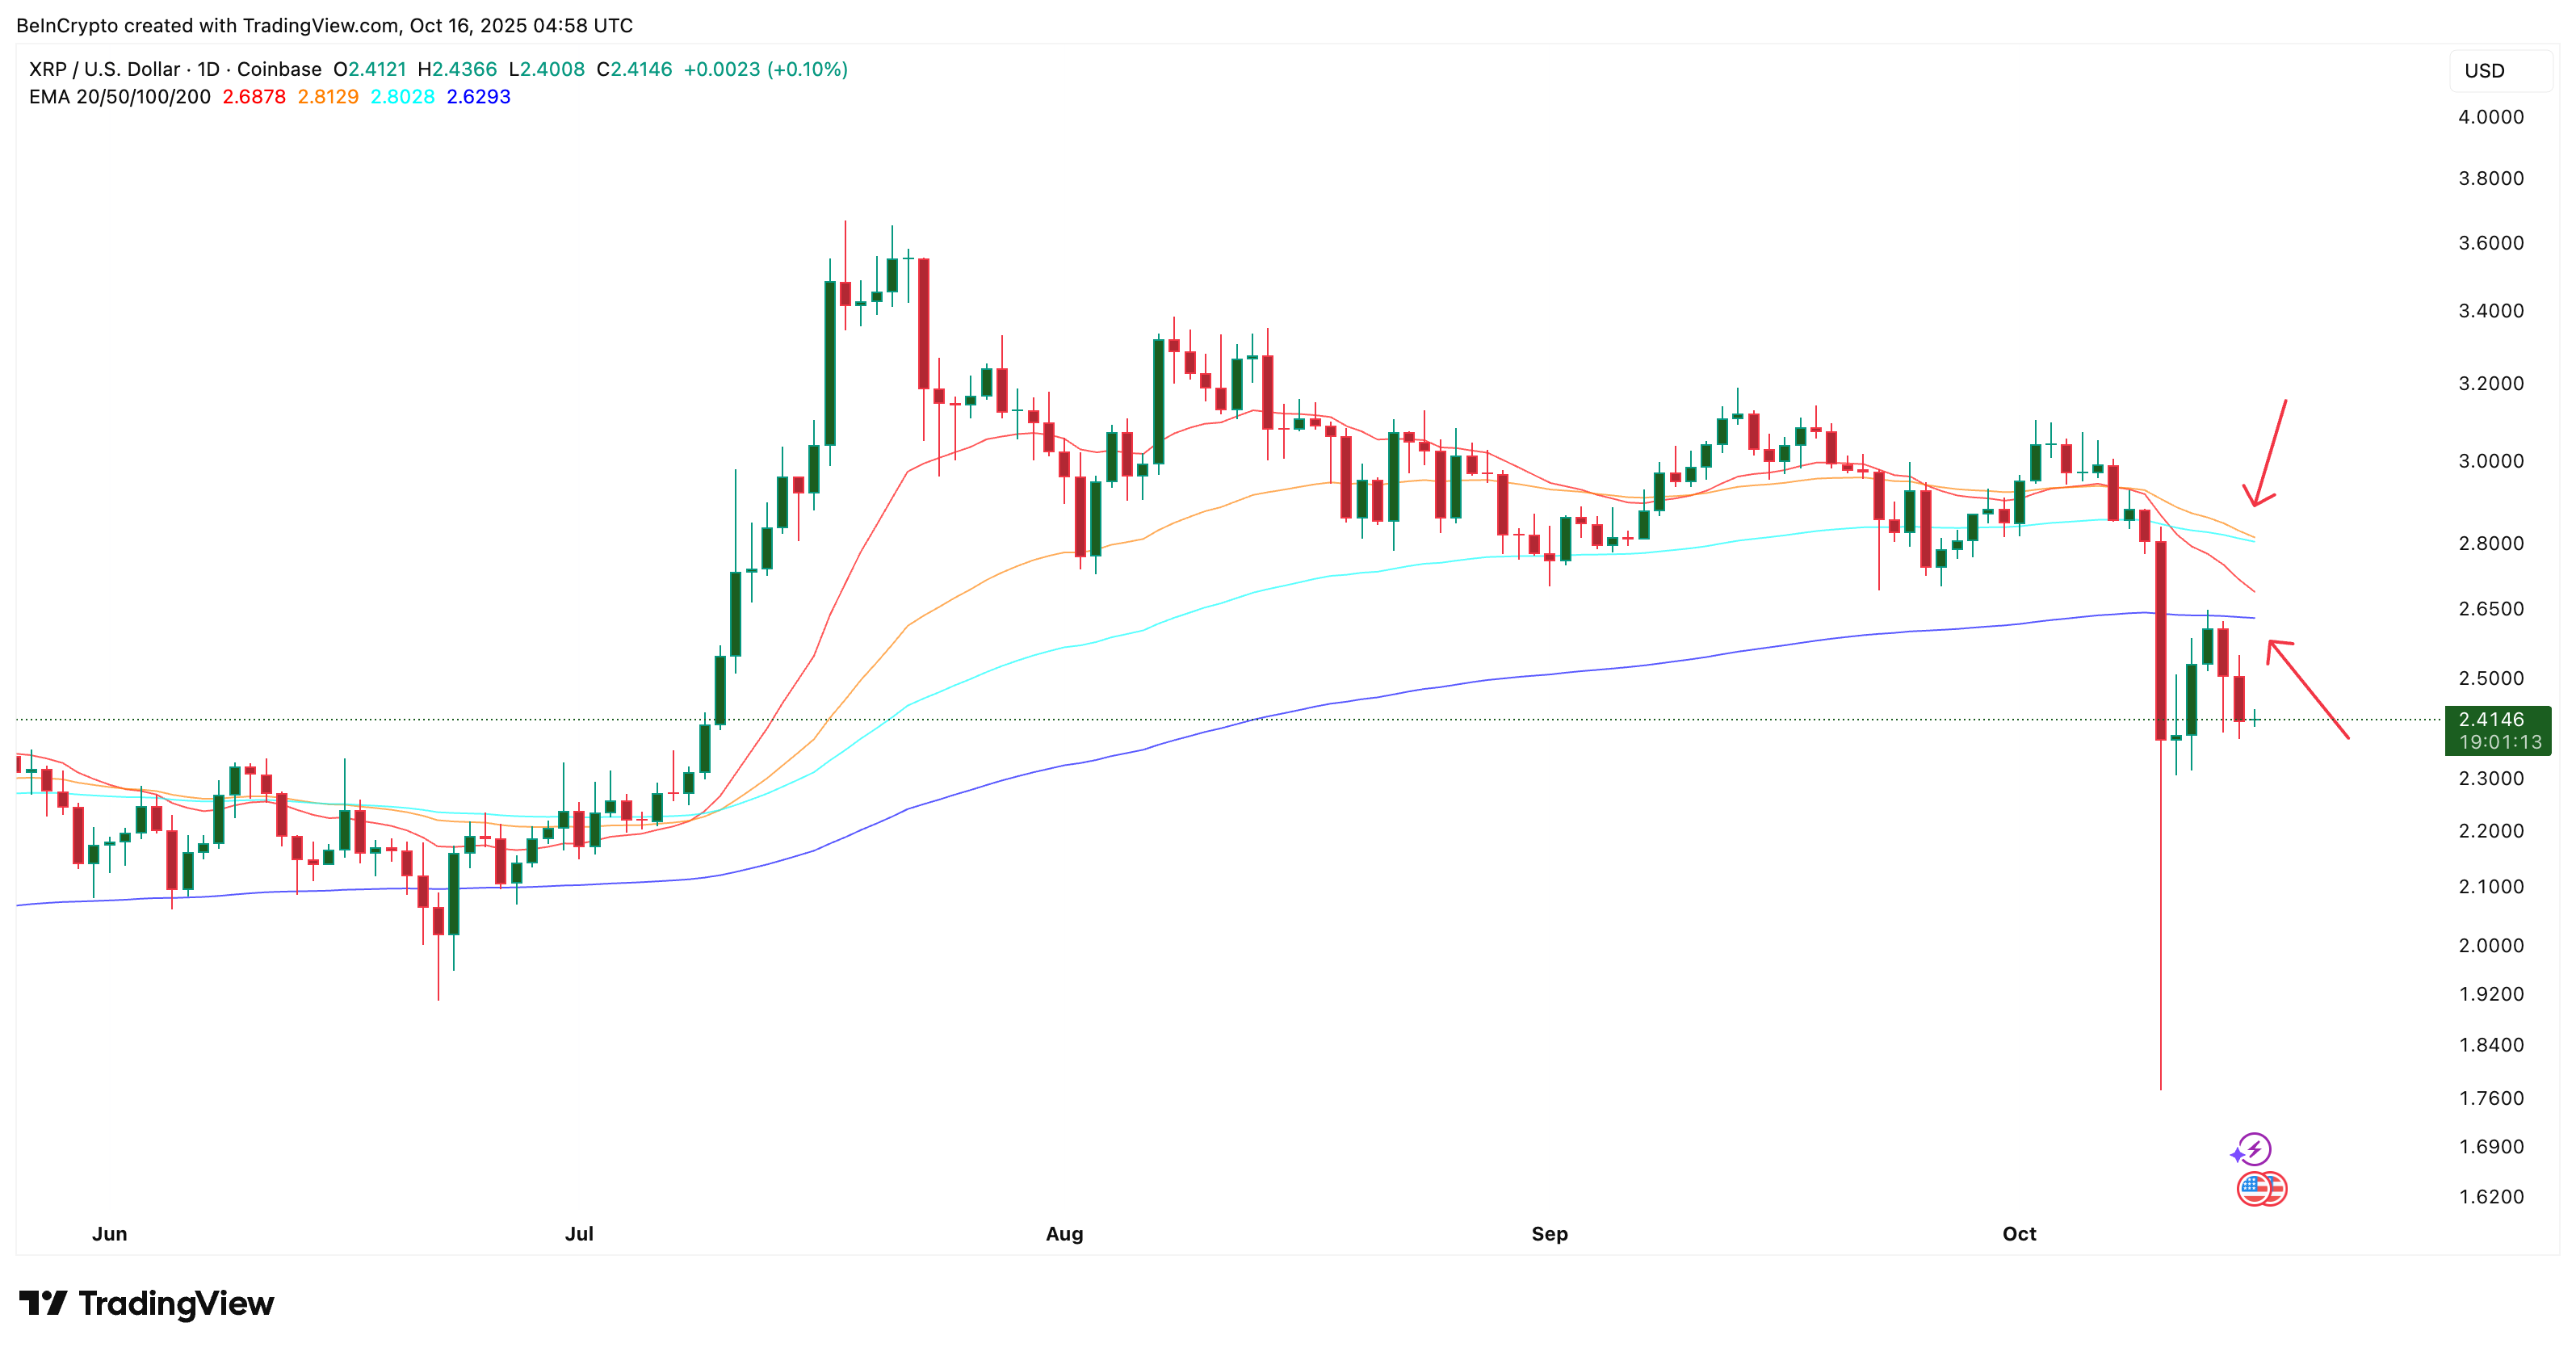
Technical Patterns Still Warn of Downside Risk for XRP Price
XRP trades near $2.41, but the chart structure remains fragile. Two death crossovers are forming — a bearish setup where short-term moving averages fall below long-term ones, often signaling a deeper downtrend ahead.
The Exponential Moving Average (EMA), a technical indicator that gives more weight to recent prices, shows two key crossovers forming. The 20-day EMA (red line) is nearing a drop below the 200-day EMA (deep blue), and the 50-day EMA (orange) is close to crossing under the 100-day EMA (sky blue). If both confirm, XRP’s bearish phase could extend, deepening the current slide.
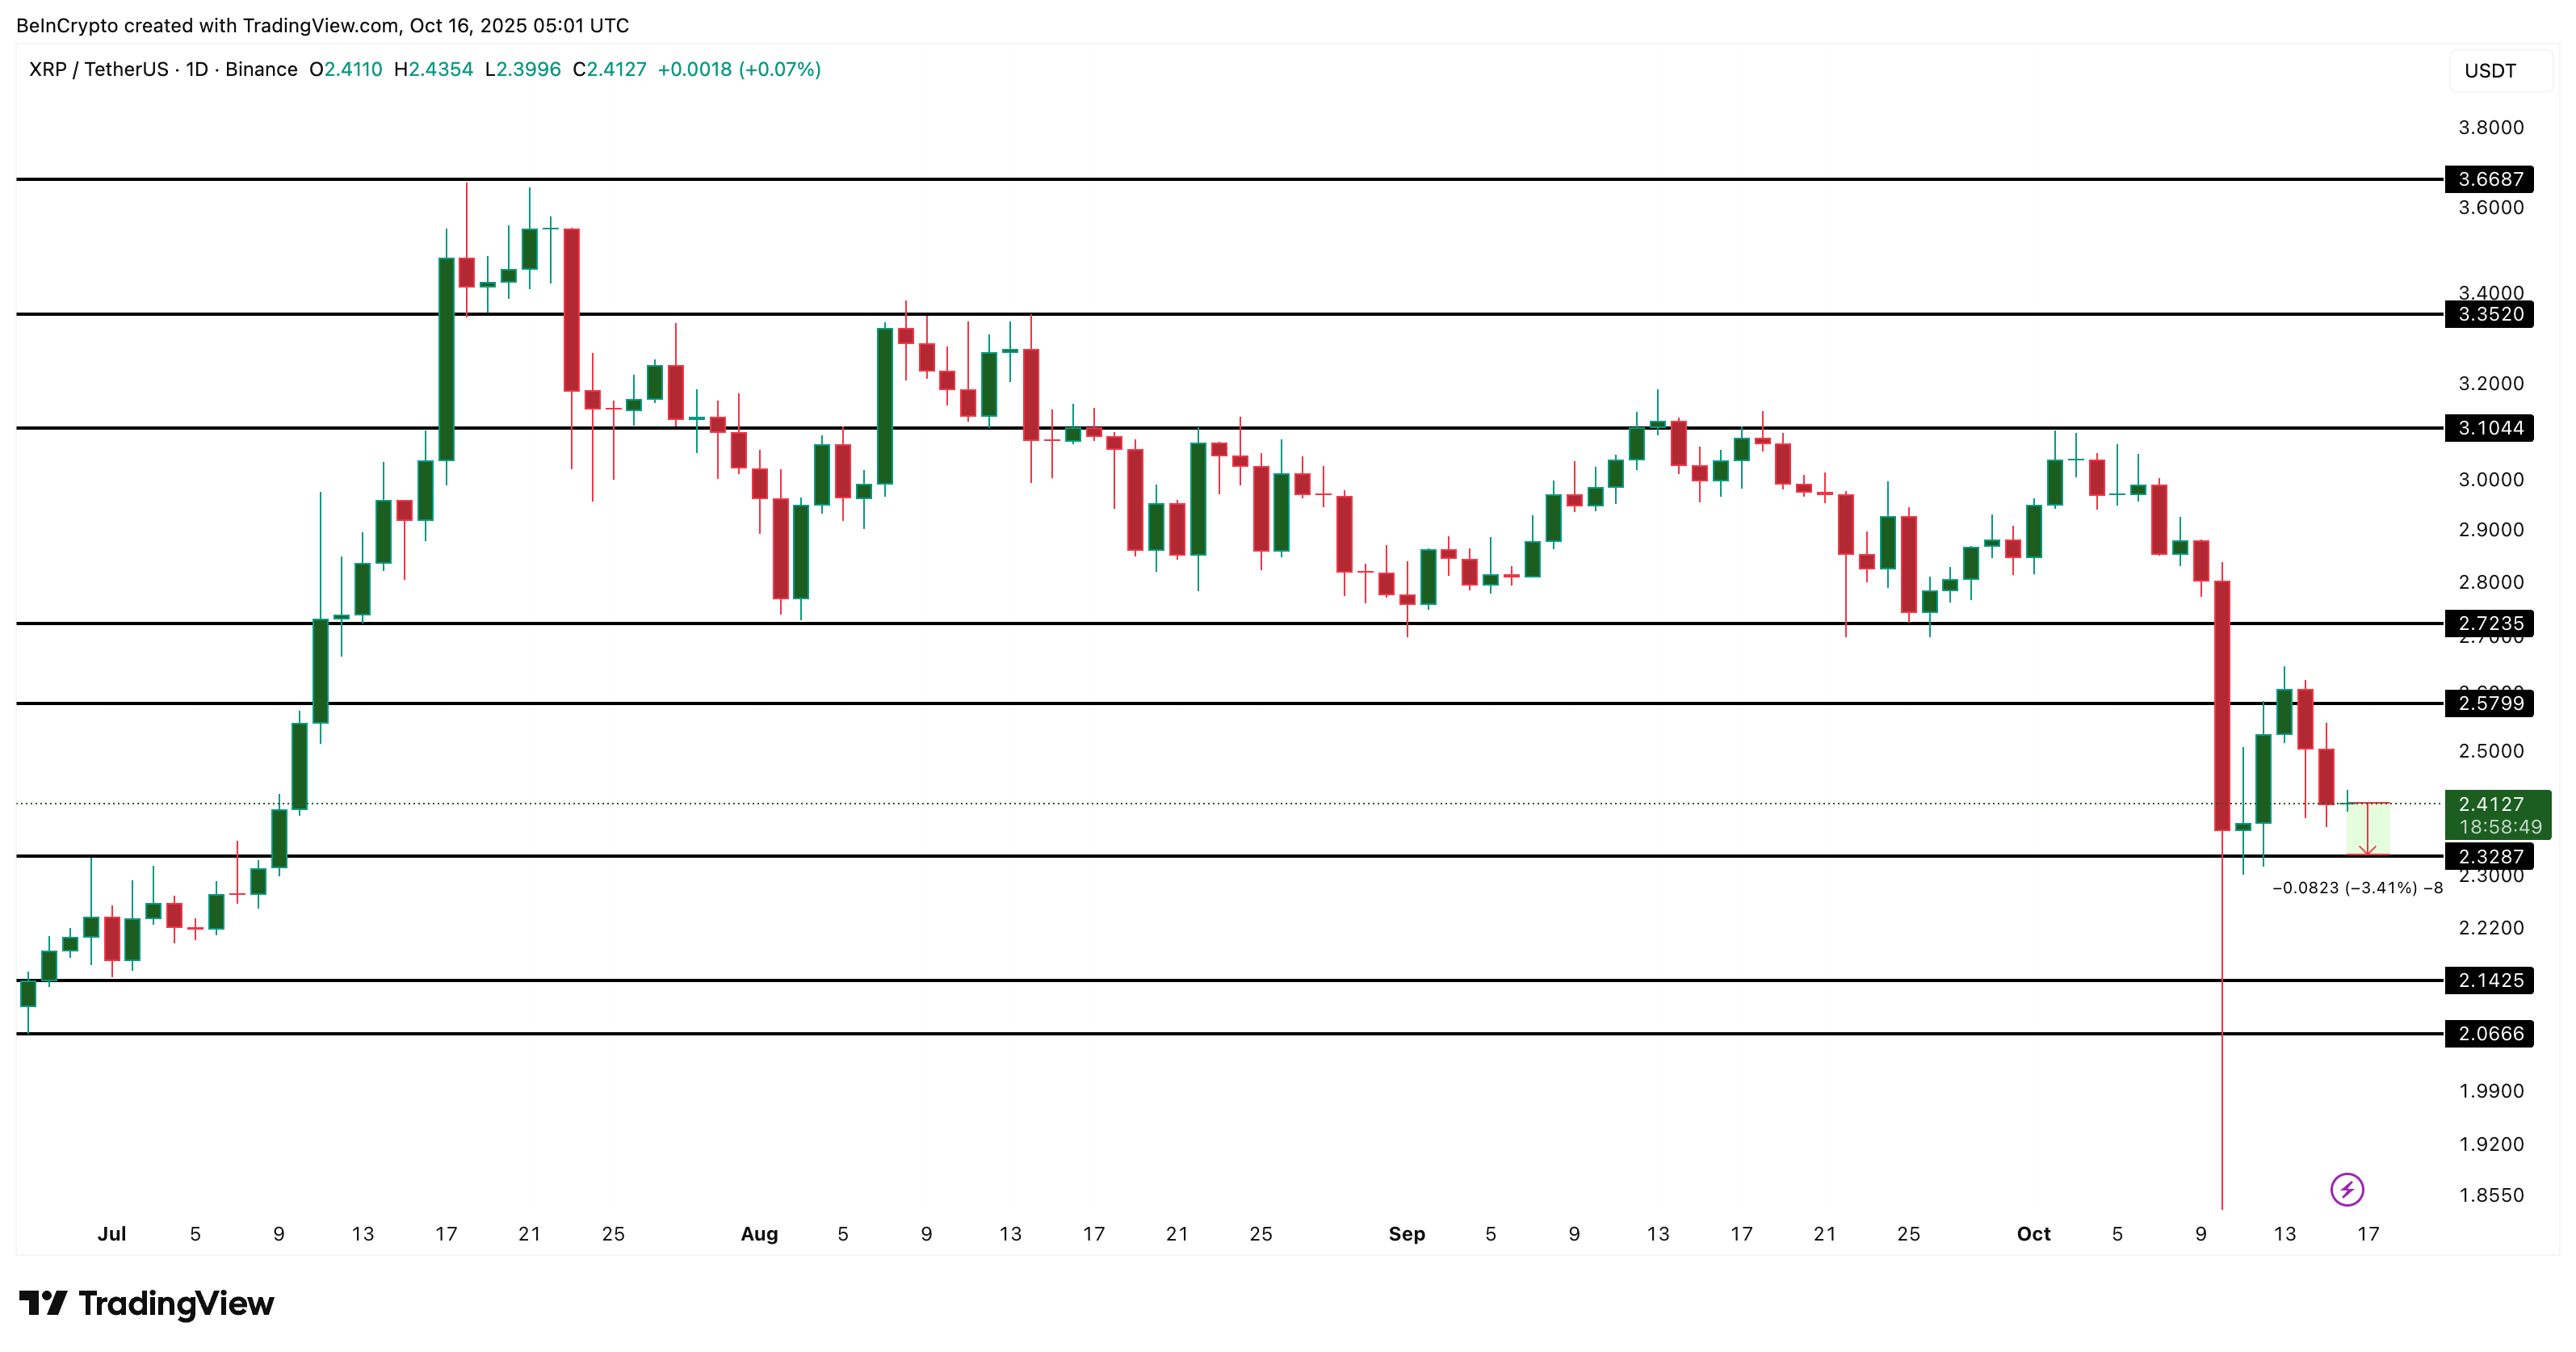
For the XRP price $2.57–$2.72 is the breakout zone that could provide short-term relief, invalidating bearishness.
However, a close below $2.32 ( a mere 3.5% dip) risks a fall to $2.14 or even $2.06, confirming a breakdown. Overall, the setup points to a growing buyer trap. Exchange data shows strong retail optimism, but every major cohort and technical indicator warns of further weakness.
Until whales and long-term holders return, the latest buying spree may only delay another leg down.
