


The Ripple (XRP) price is in an uncertain phase. The 7-day RSI shows it’s not overbought or oversold, indicating flat investor interest. The situation worsened as the 7-day moving average of Daily Active Addresses fell by 10% in just four days. This suggests a bearish trend in network activity.
Additionally, a death cross in the EMA lines hints at a possible strong downtrend. This signals investors in XRP to be cautious.
RSI Is Currently Neutral
XRP market shows signs of investor disinterest. Its 7-day Relative Strength Index (RSI) is at 49.5. This number is near the RSI spectrum’s middle. It indicates a lukewarm sentiment towards XRP without strong buying or selling momentum.
The RSI measures price movement speed and changes. It ranges from 0 to 100. An RSI above 70 means an asset is overbought and may fall. Below 30 suggests it’s oversold and could rise.
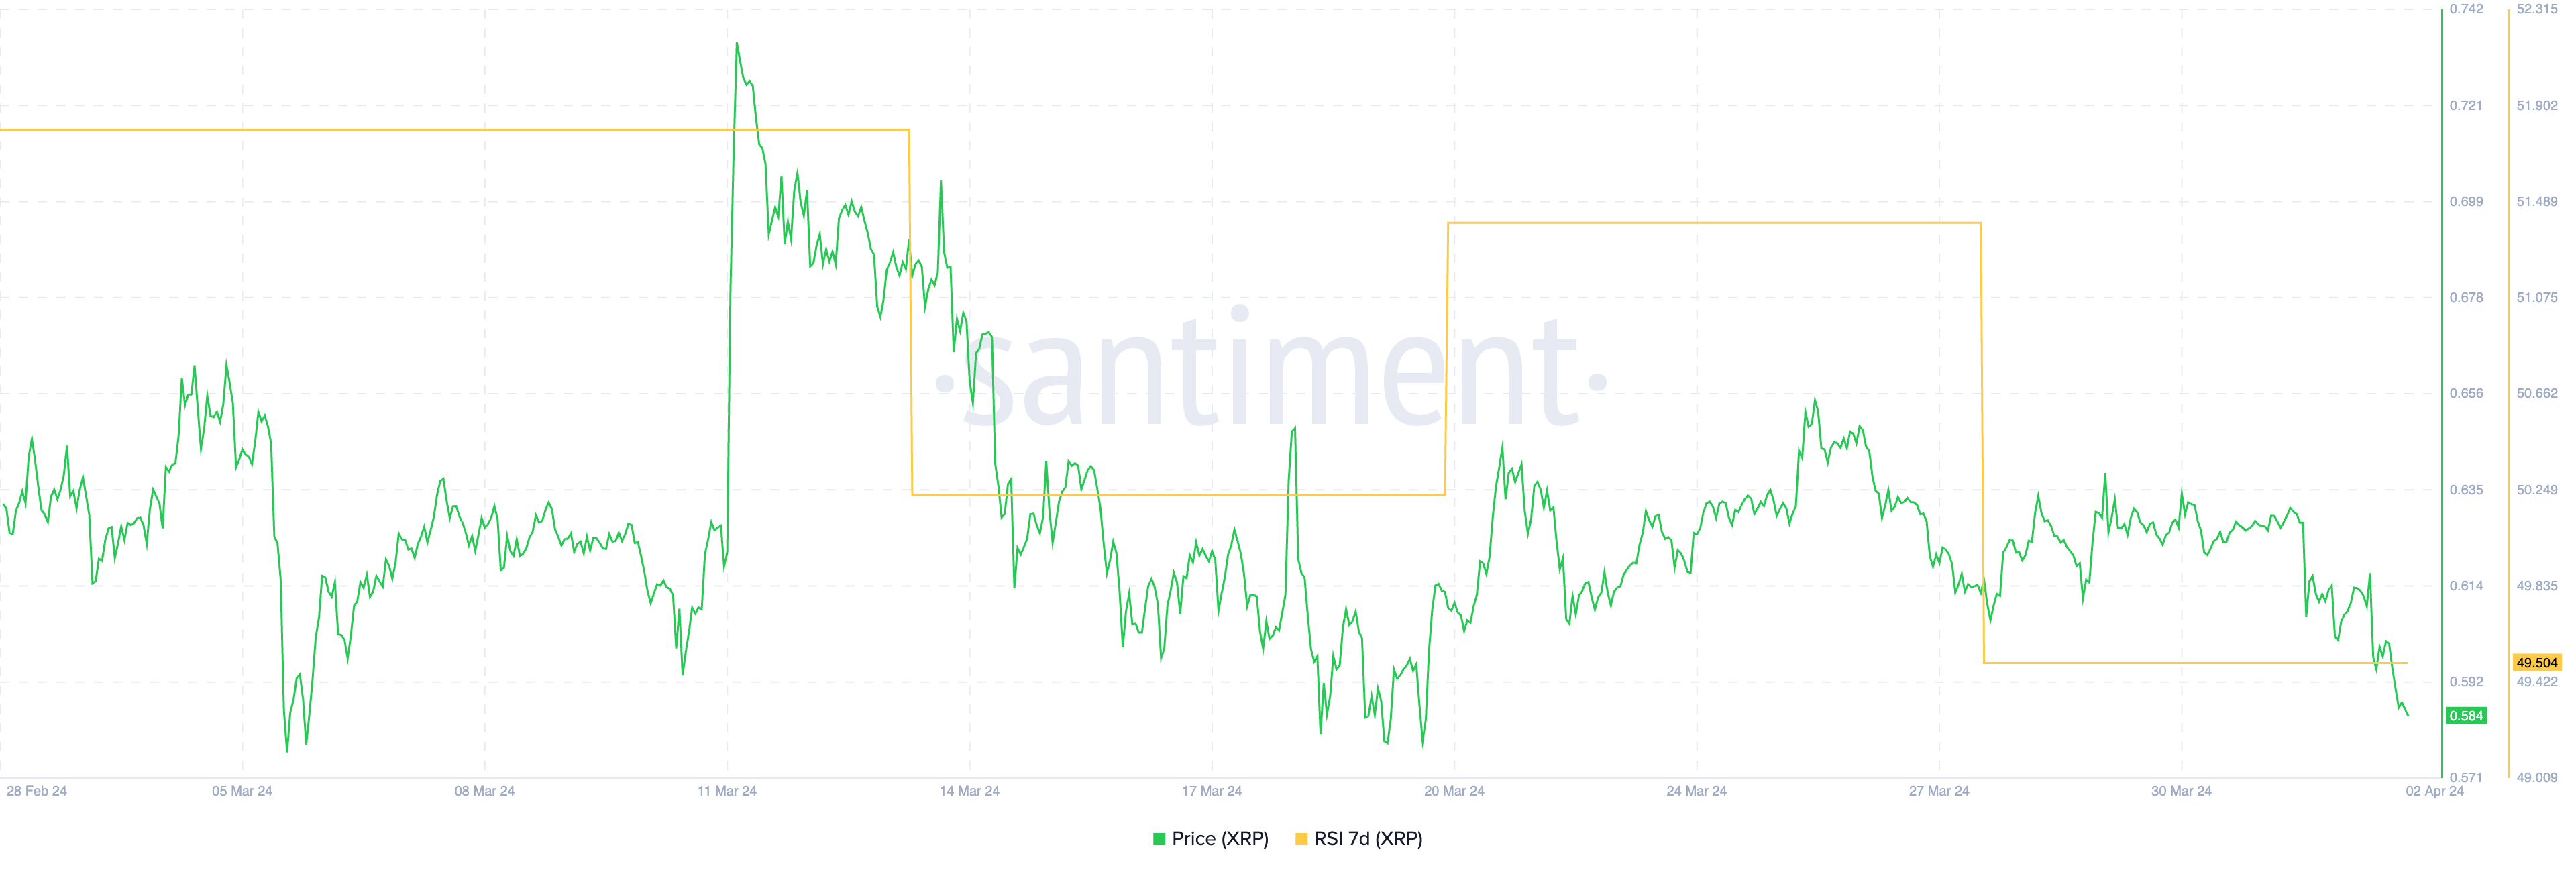
Therefore, XRP’s current RSI signals a market equilibrium that translates into a lack of compelling interest among traders. This apathy is further shown by the fact that the current RSI value is the lowest recorded since February 28. Such a dip to near-midrange levels from any side suggests a cooling off of prior enthusiasm or pessimism, potentially marking the beginning of a bearish phase for Ripple.
By implying a weakening in buying pressure or a failure to attract new interest, this downturn in the RSI can be interpreted as a bearish signal for XRP, cautioning investors about the possibility of diminishing returns.
Read More: Everything You Need To Know About Ripple vs SEC
Daily Active Addresses are Dropping
XRP has shown a fascinating correlation between Daily Active Addresses and its price. Initially, from March 7 to March 11, there was a significant increase in Daily Active Addresses, rising from 29,246 to 37,724.
This surge in network activity coincided with a notable increase in XRP’s price, which skyrocketed from $0.61 to $0.72. However, this trend saw a reversal when, by March 20, Daily Active Addresses dropped to 26,848, accompanied by a decrease in XRP’s price to $0.57, further reinforcing the connection between network activity and price valuation.
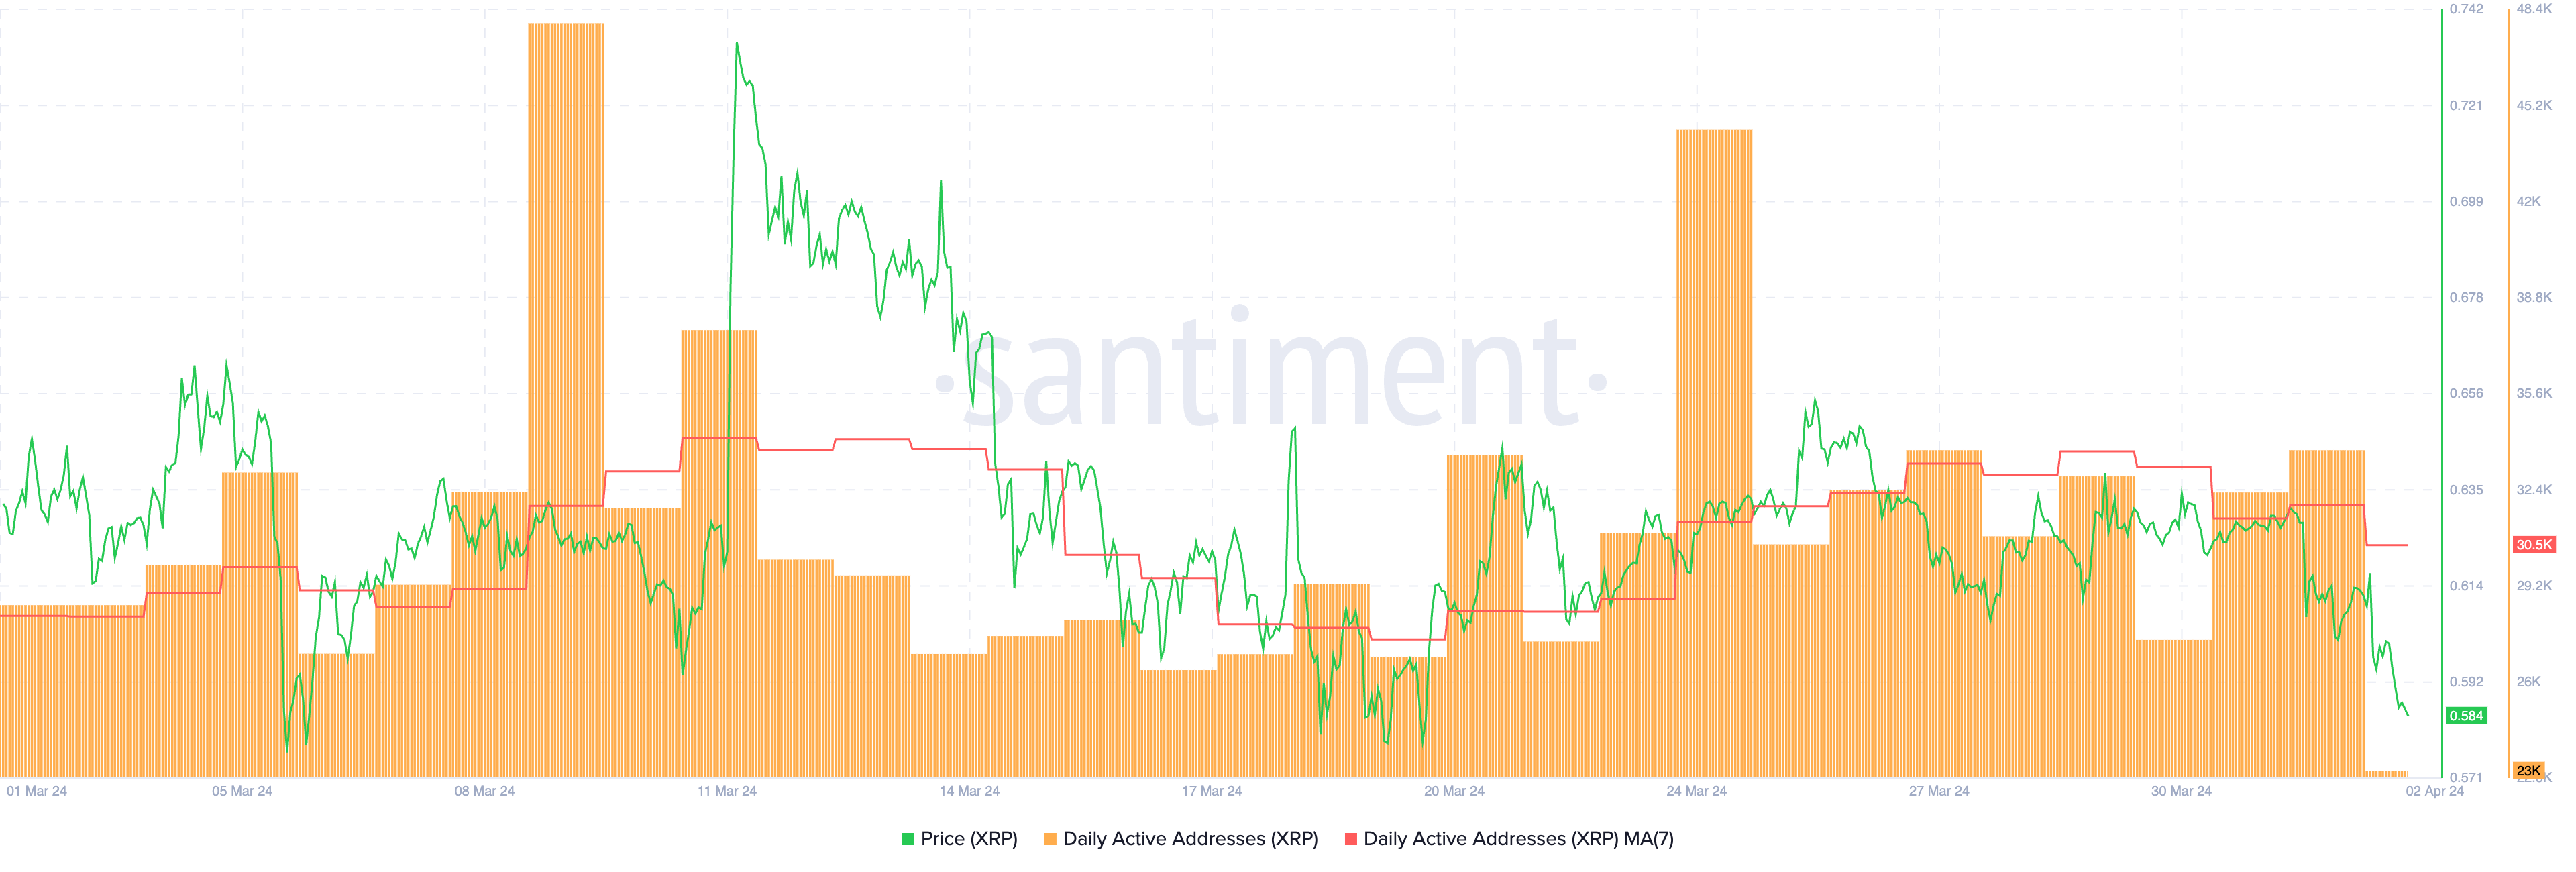
The recent period from March 29 to April 2 has presented a continuation of this trend, with the 7-day Moving Average of Daily Active Addresses declining from 33,684 to 30,559, a 10% decrease. This decrease indicates a dwindling interest in Ripple, as fewer addresses engage in transactions on the network.
Given the observed correlation between these two metrics over the last few months, this drop in Daily Active Addresses could herald further price corrections for Ripple.
XRP Price Prediction: A Death Cross Could Bring the Price to Less Than $0.50
The XRP 4H price chart recently unveiled a significant technical pattern on April 1: the formation of a death cross. A death cross occurs when a shorter-term EMA crosses below a longer-term EMA. EMA lines, or Exponential Moving Averages, are vital indicators that smooth out price data to reveal trend direction over specific time frames.
Read More: 9 Best Blockchain Protocols To Know in 2024
This event is traditionally seen as a bearish signal, suggesting that the current price momentum is weakening and could indicate a potential downturn for XRP’s price. Moreover, the increasing distance between these two EMA lines further reinforces the bearish trend, signaling that the selling pressure is intensifying and the negative sentiment is gaining strength.
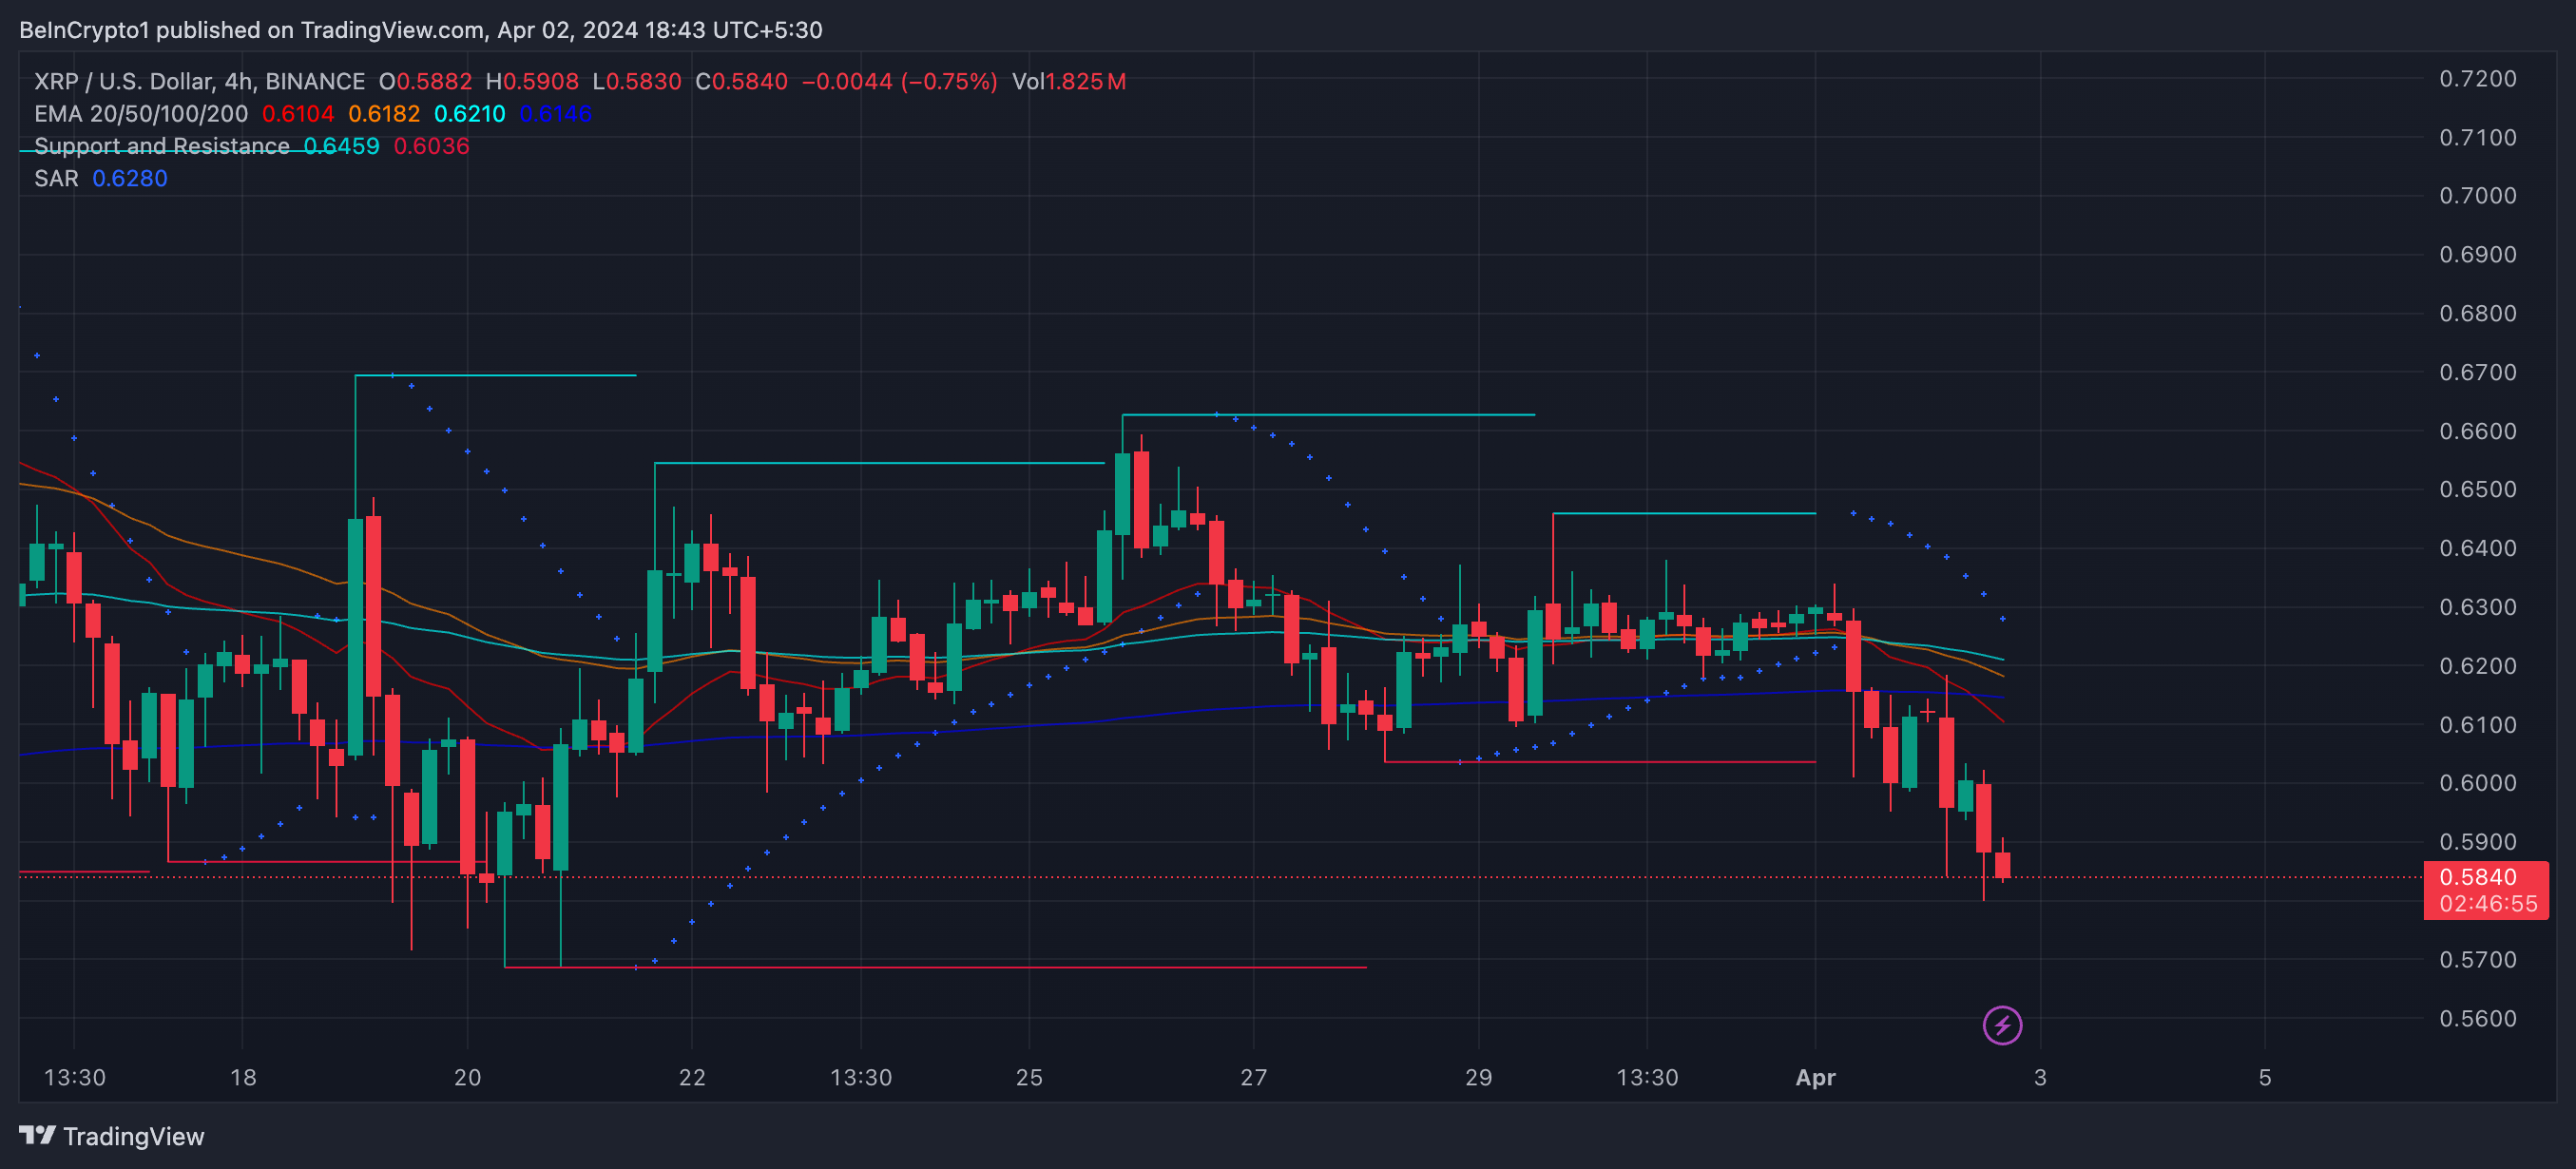
Should this bearish trend persist, XRP’s price will likely test critical support levels at $0.54 and $0.53. Failing to hold these levels could push the price down to test a more substantial support at $0.49.
Conversely, if a reversal occurs and an uptrend begins, XRP’s price could challenge the resistance levels around $0.66 or even higher at $0.70.


