
The XRP price decreased considerably last week and proceeded to reach a close below the $0.32 area, which had previously been acting as support.
Until XRP reclaims this level, the long-term trend is considered bearish.
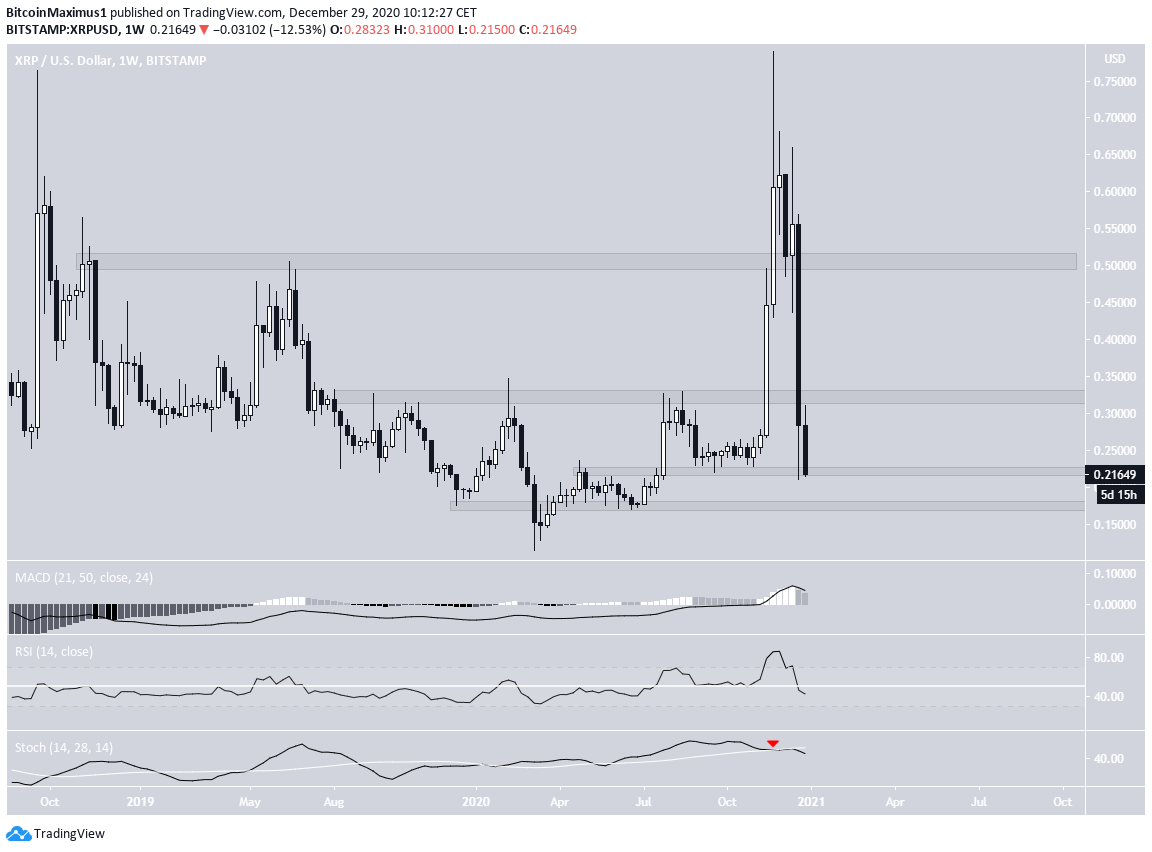
Long-Term XRP Levels
The weekly chart shows that XRP has decreased to reach a close below the $0.32 area. This is a level that had been acting as support since it initially broke out in November.
This is a significantly bearish development that suggests that it might head lower since the $0.32 area is expected to act as resistance now.
XRP is currently trading just above support at $0.21. If this support area breaks down, the next would be found at $0.175.
Technical indicators are decisively bearish. The Stochastic oscillator has made a bearish cross and the RSI has crossed below 50.
Cryptocurrency trader @tradingTank outlined an XRP chart, hypothesizing whether or not it will be able to hold on above crucial support amid particularly negative news.
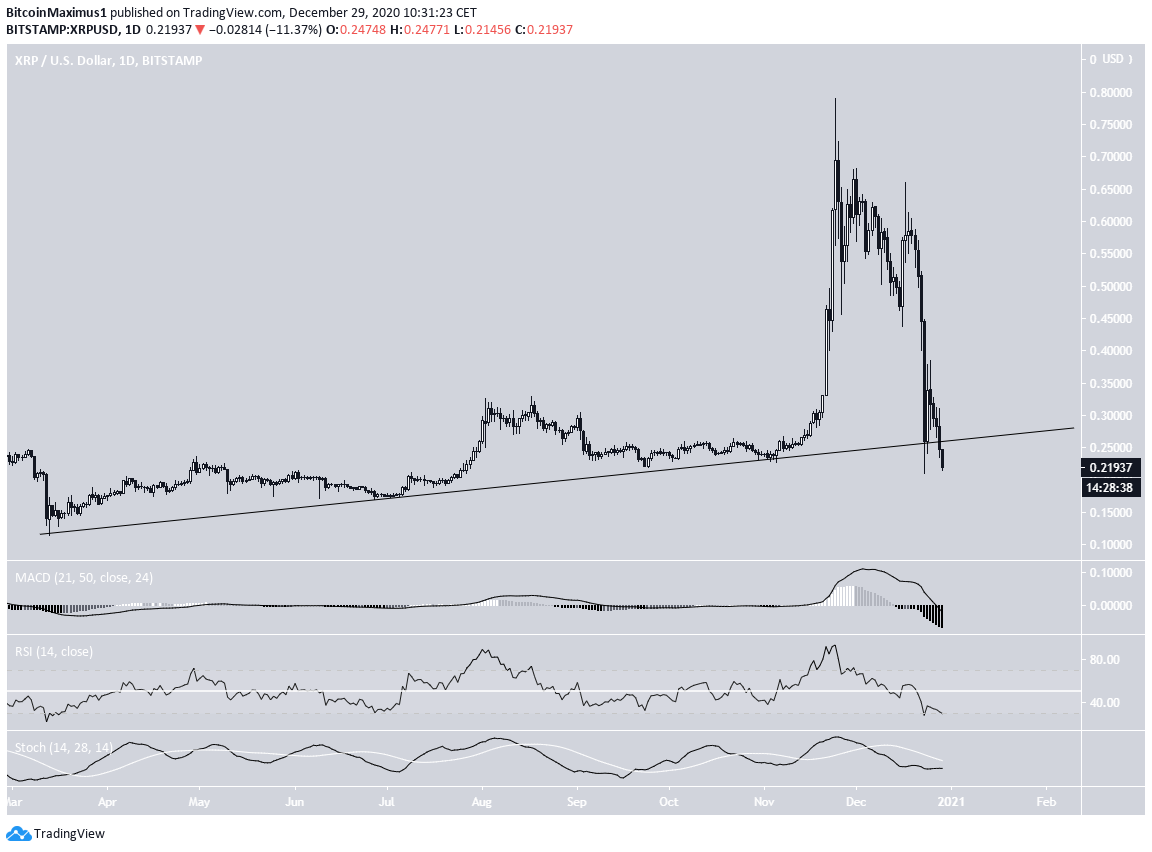
The readings and price movement from the weekly chart suggest that XRP will not be able to hold on. In order to have a clearer picture of the movement, we need to take a look at the daily chart.

Breakdown Below Support
The daily chart shows that XRP has also broken down below an ascending support line that had previously been in place since March.
This is another bearish sign that suggests lower prices are on the horizon. Similar to the weekly time-frame, technical indicators for the daily time-frame are also bearish.
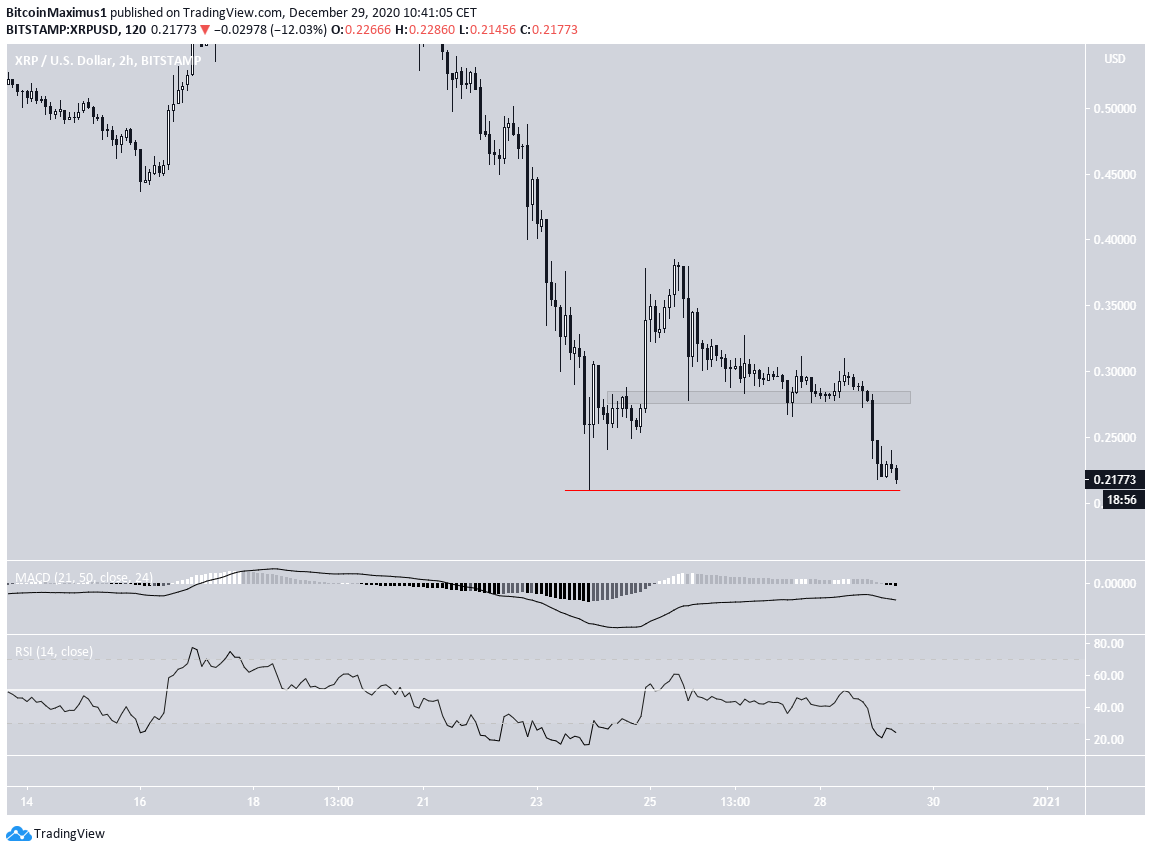
The two-hour chart shows another breakdown, this time from the minor $0.27 support area. There are no bullish reversal signs in the two-hour chart either.
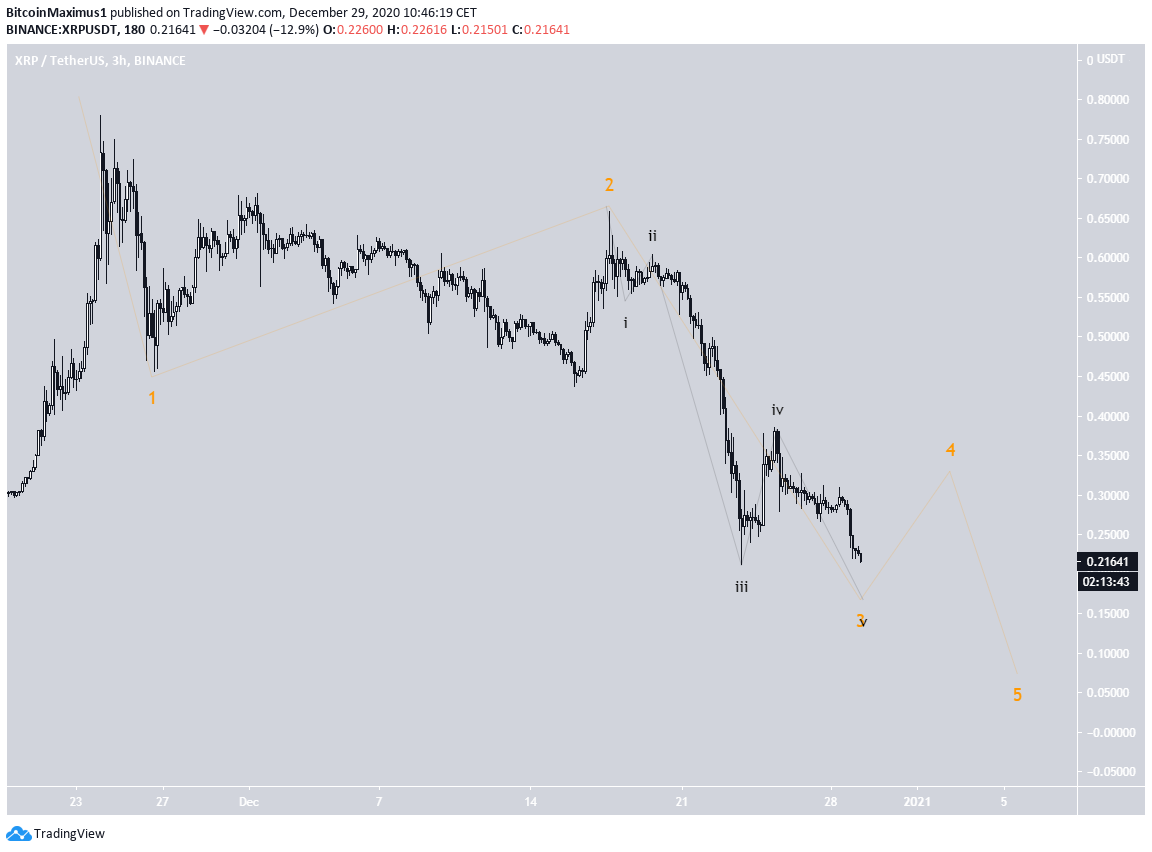
Wave Count
The wave count for XRP is similarly bearish, suggesting that it is in an extended third wave (orange), which is likely to take it to the previously outlined $0.175 support area. After a possible bounce, it could then decrease once more.
The sub-wave count is given in black, with the price currently being in sub-wave 5.
Conclusion
XRP is expected to decrease towards the $0.175 area before possibly bouncing. The long-term trend is likely bearish.
For BeInCrypto’s latest Bitcoin (BTC) analysis, click here!
Disclaimer: Cryptocurrency trading carries a high level of risk and may not be suitable for all investors. The views expressed in this article do not reflect those of BeInCrypto.
