

On March 25, the XRP price briefly decreased below the support line of its long-term trading range. It followed this with a bullish engulfing candlestick the next day. A similar movement that transpired in September 2019 marked the beginning of an upward move with a magnitude of 60%.
Well-known trader @Anbessa100 outlined an XRP chart that shows a massive accumulation pattern developing at what could be a level near the bottom.
State of #Altcoins $XRP bottom of accumulation pic.twitter.com/bbbeH6f8wC
— AN₿ESSA (@Anbessa100) March 26, 2020
Possible XRP Bottom
For the past 259 days, the XRP price has been trading very close to 2,400 satoshis, having created a support area at this level. The support area is significant since it was the catalyst of the upward move in 2017 that eventually led to its all-time high. However, it seems premature to call this the bottom. Prior to 2017, the price has traded below this level for long periods of time. More specifically, there is a strong support area at 1,400 satoshis that had also previously initiated a strong rally. Therefore, it is entirely possible that the price will break down below the current support area and head towards 1,400 satoshis.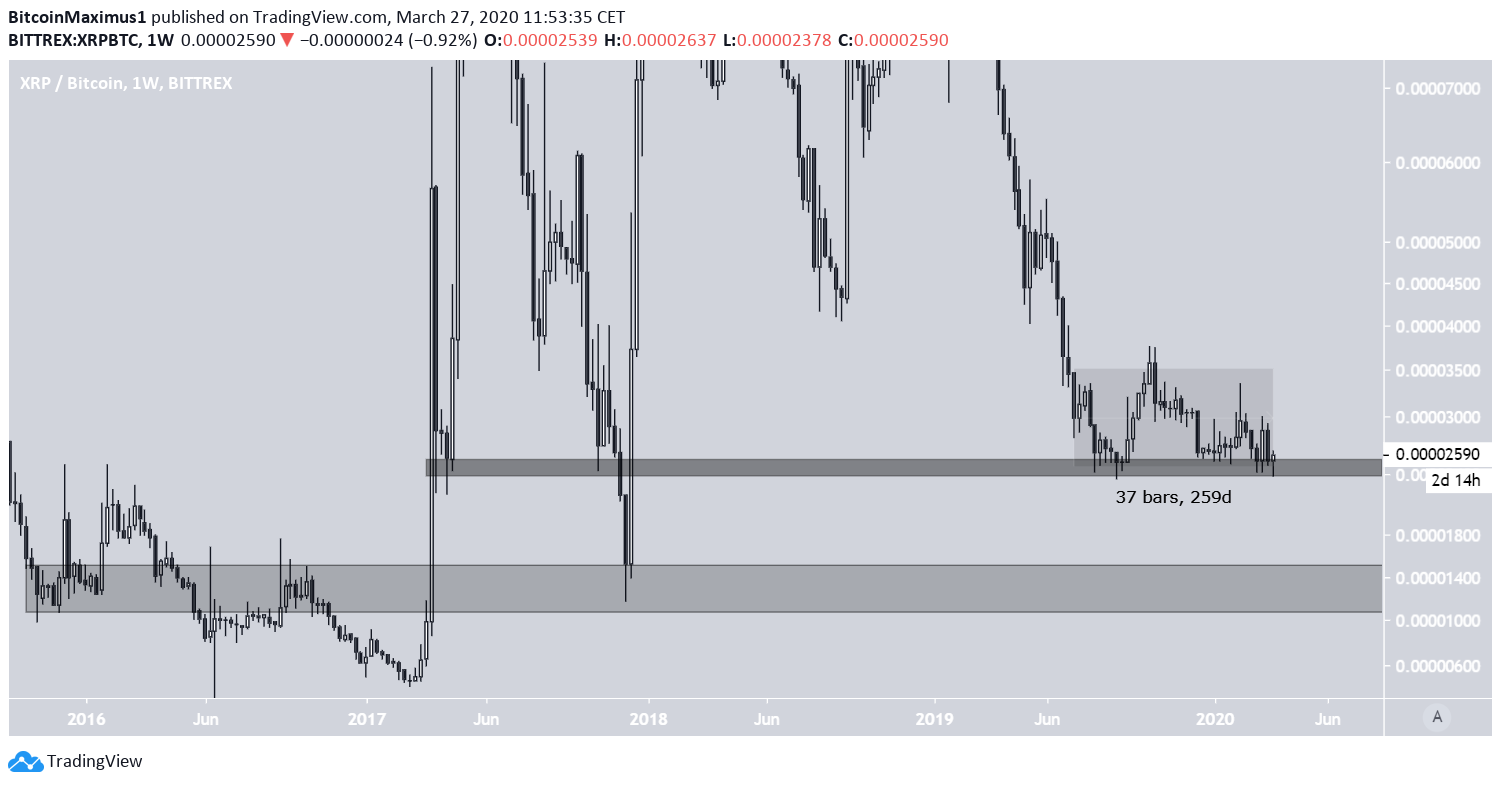
Trading Range
Since August 2019, the XRP price has been trading inside a range of 2,450-3,350 satoshis. Throughout this range, it has twice decreased below the support area only for a short period of time. The first time was on September 6, 2019. What followed was an upward move that led to a failed breakout above the range high. The price decreased below this area on March 25 and created a bullish engulfing candlestick the next day. If it acts in a similar manner to September 2019, it will soon move towards the range EQ and eventually the range high. A failure to do so would likely cause the price to decrease towards the next support area at 1,400 satoshis, invalidating the possibility of accumulation at the bottom. The daily RSI can be a good indicator of the direction of the price movement. If it is successful in moving above the 50-line, the price will likely continue to move upwards. A rejection from the 50-line could cause a breakdown.
Disclaimer
In line with the Trust Project guidelines, this price analysis article is for informational purposes only and should not be considered financial or investment advice. BeInCrypto is committed to accurate, unbiased reporting, but market conditions are subject to change without notice. Always conduct your own research and consult with a professional before making any financial decisions. Please note that our Terms and Conditions, Privacy Policy, and Disclaimers have been updated.

Valdrin Tahiri
Valdrin discovered cryptocurrencies while he was getting his MSc in Financial Markets from the Barcelona School of Economics. Shortly after graduating, he began writing for several different cryptocurrency related websites as a freelancer before eventually taking on the role of BeInCrypto's Senior Analyst.
(I do not have a discord and will not contact you first there. Beware of scammers)
READ FULL BIO
Sponsored
Sponsored