The prices of both EOS and XRP have broken down below important support levels. This decrease has caused both altcoins to trade at their lowest levels since December 2017.
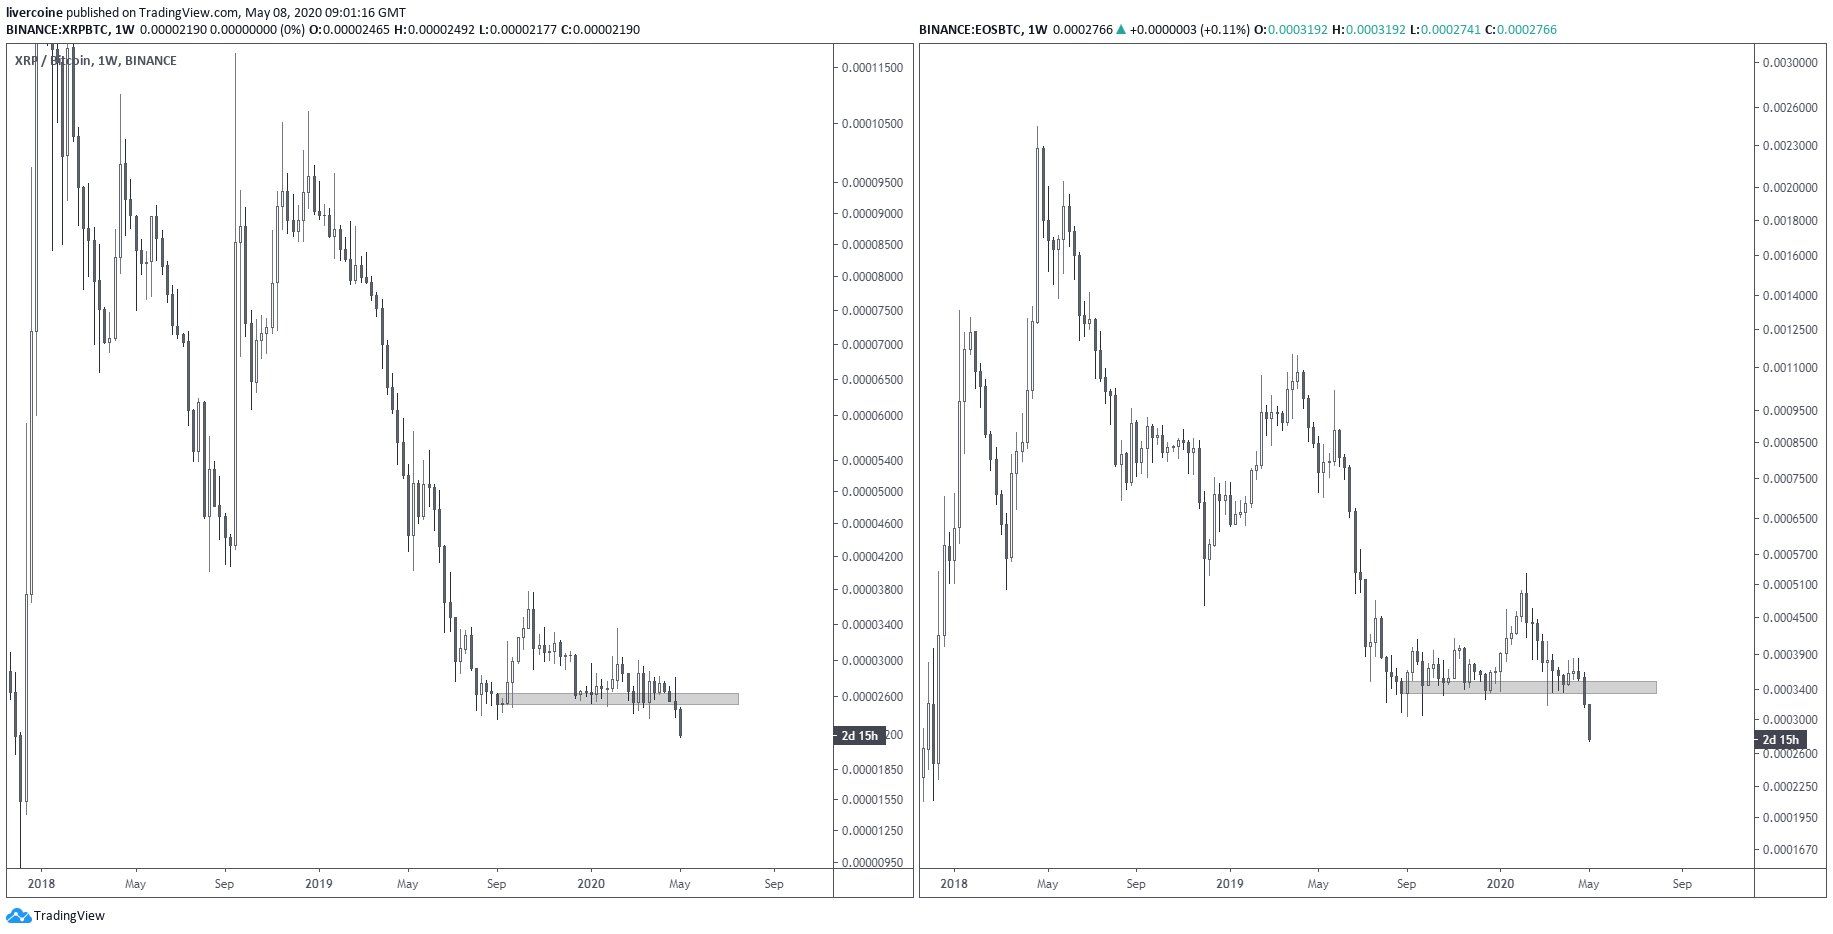
Cryptocurrency trader @livercoin tweeted a double image that shows the prices of both EOS and XRP, which mirror each other and have both broken down below a significant support area.
In this article, we will take a closer look at both coins and see if they could potentially initiate a reversal in the near future.
XRP
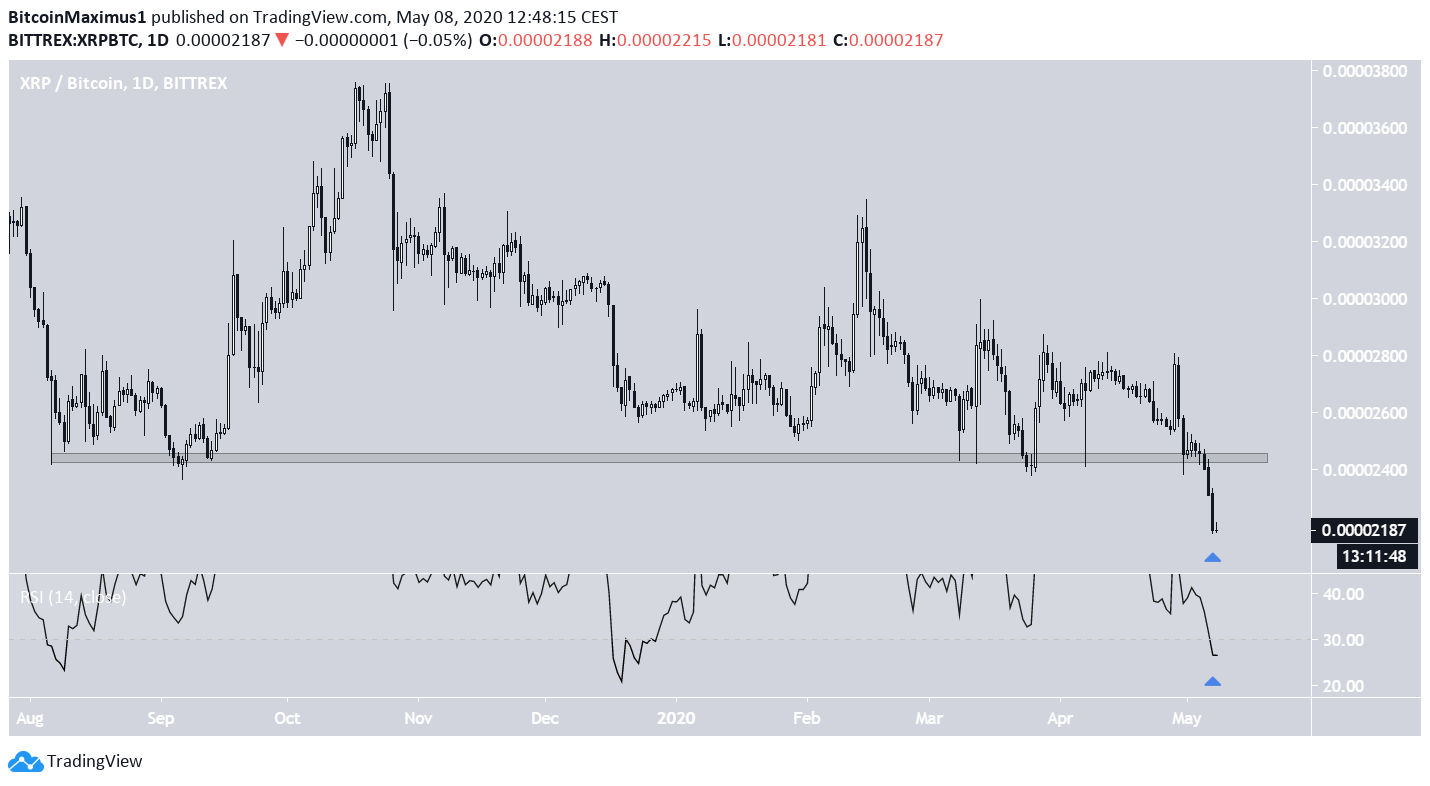
On May 4, the XRP price broke down below the 2450 satoshi support area, which had not been broken since August 2019. This is a major bearish development that suggests that the price may head downwards until it finds support and creates another trading range.
While the RSI is oversold, it has not generated any traces of bullish divergence. Furthermore, it has been more oversold in two instances since August 2019 — and that was still not sufficient to initiate a reversal.
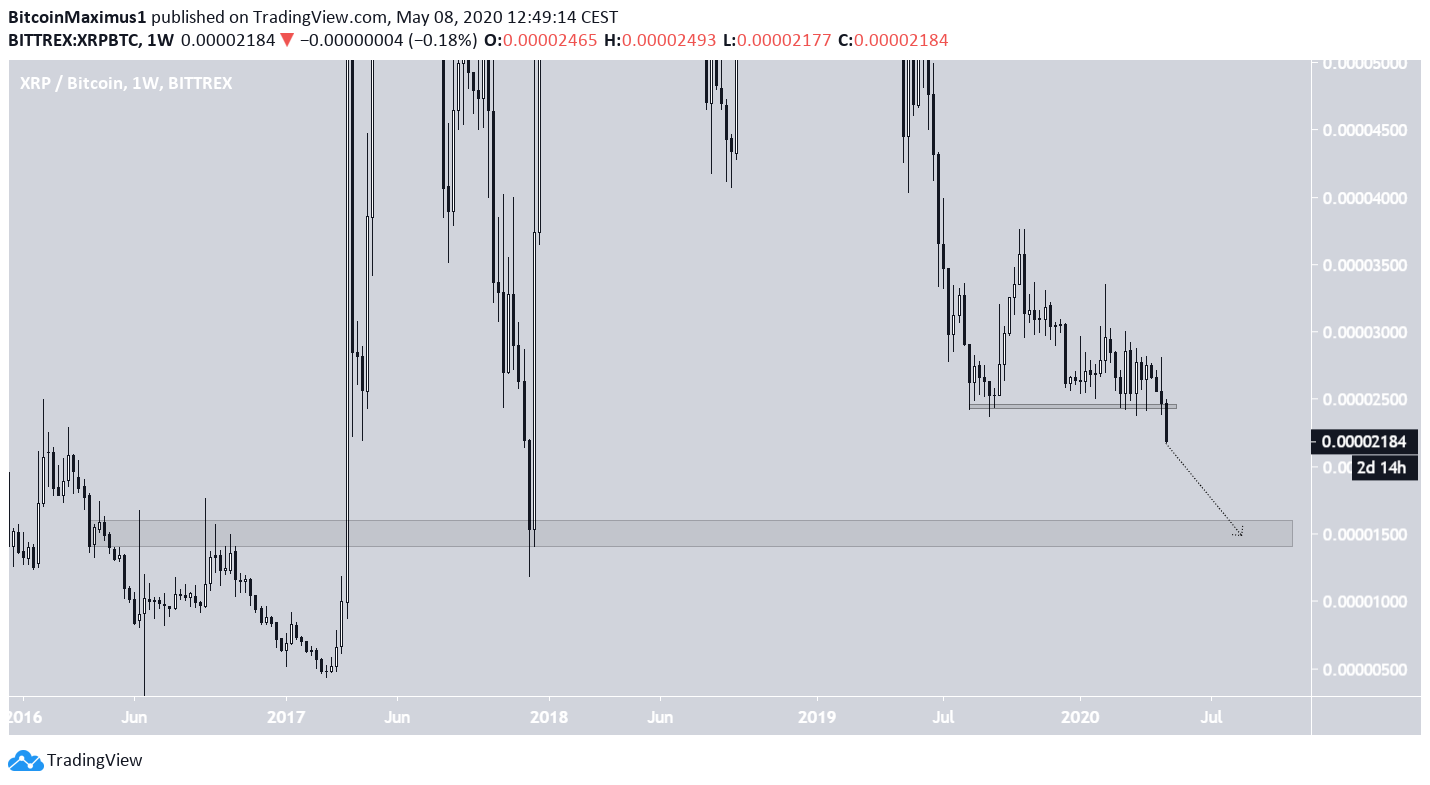
The weekly chart gives a clearer picture of the breakdown and gives the next major support area, which is found at 1500 satoshis. This area acted as resistance in 2016 and has not been reached since December 2017.
Since there are no reversal signs, the price is expected to decrease until it reaches it.
EOS
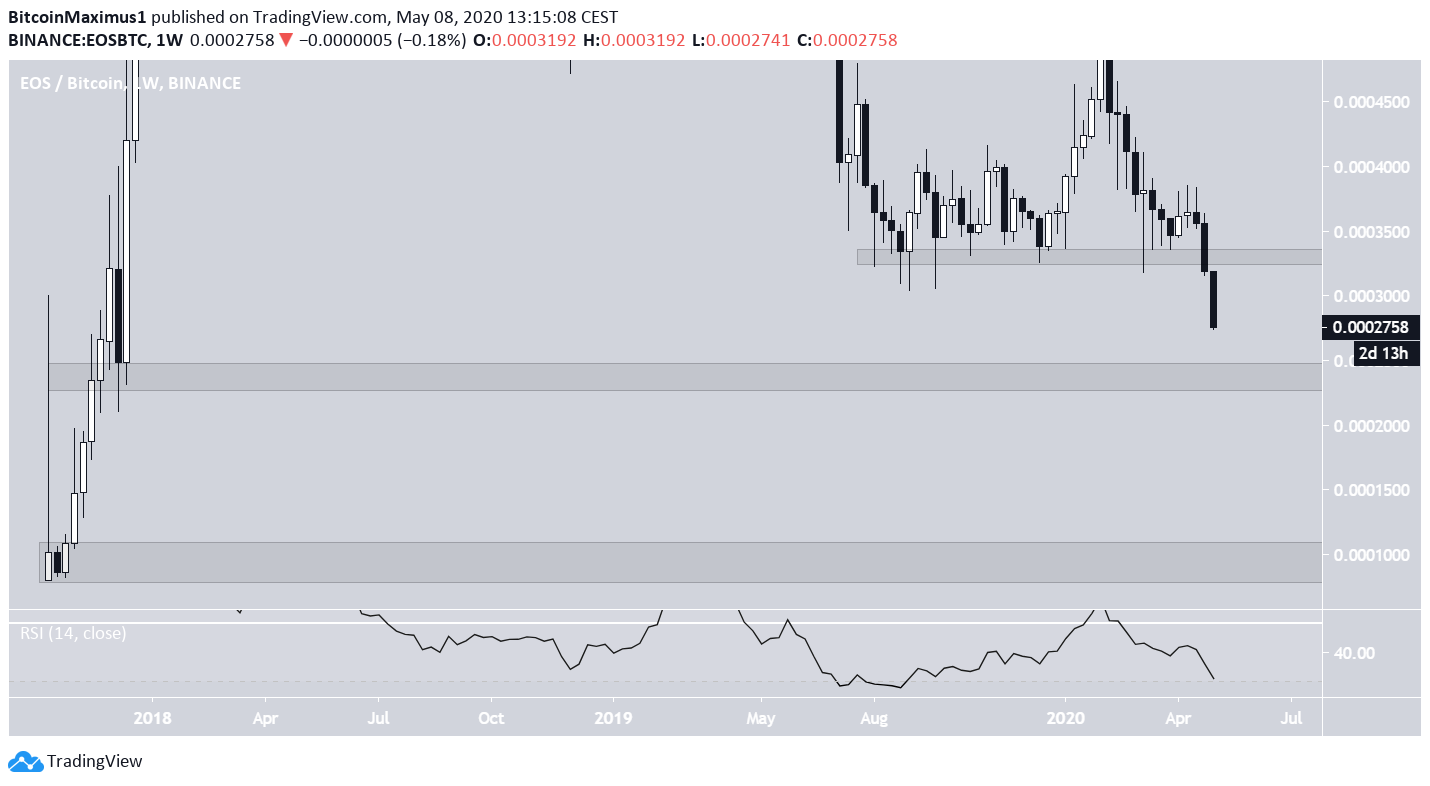
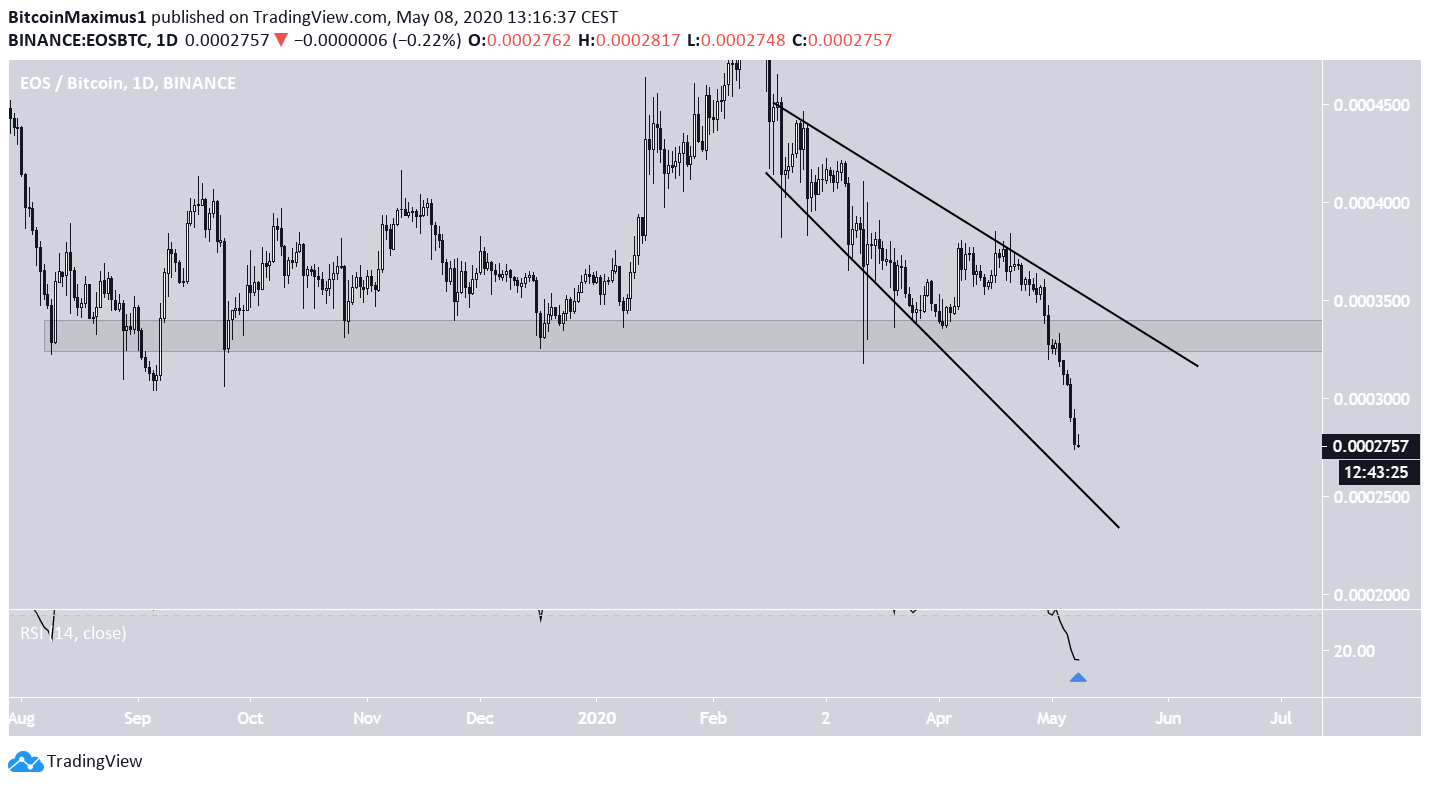
On May 4, the price of EOS broke down below a significant support area found at 33,000 satoshis. The support area had been in place since August 2019.
Since prior to the breakdown, the price has possibly been trading inside a descending, broadening wedge, out of which a decrease would be expected. In addition, while the RSI has not generated any bullish divergence, it is trading at its lowest levels since August 2019, when the support area was created.
This is in stark difference with XRP, whose RSI was not yet extremely oversold.
When looking at the weekly chart, the closest support level is relatively close, being found at 2200 satoshis. This area has previously acted as support in December 2017, identical to XRP.
However, this is a relatively minor support level, so it is not inconceivable that EOS could break down straight through it and reach the next support level which is found at 1000 satoshis. This possibility is also supported by the weekly RSI, which has yet to reach oversold levels.