


The XRP price has been declining since Nov. 24 and doing so at an accelerated rate since the airdrop on Dec. 12.
Despite the ongoing correction, XRP should bounce and resume its upward movement towards the targets given in this article.
XRP’s Long-Term Levels
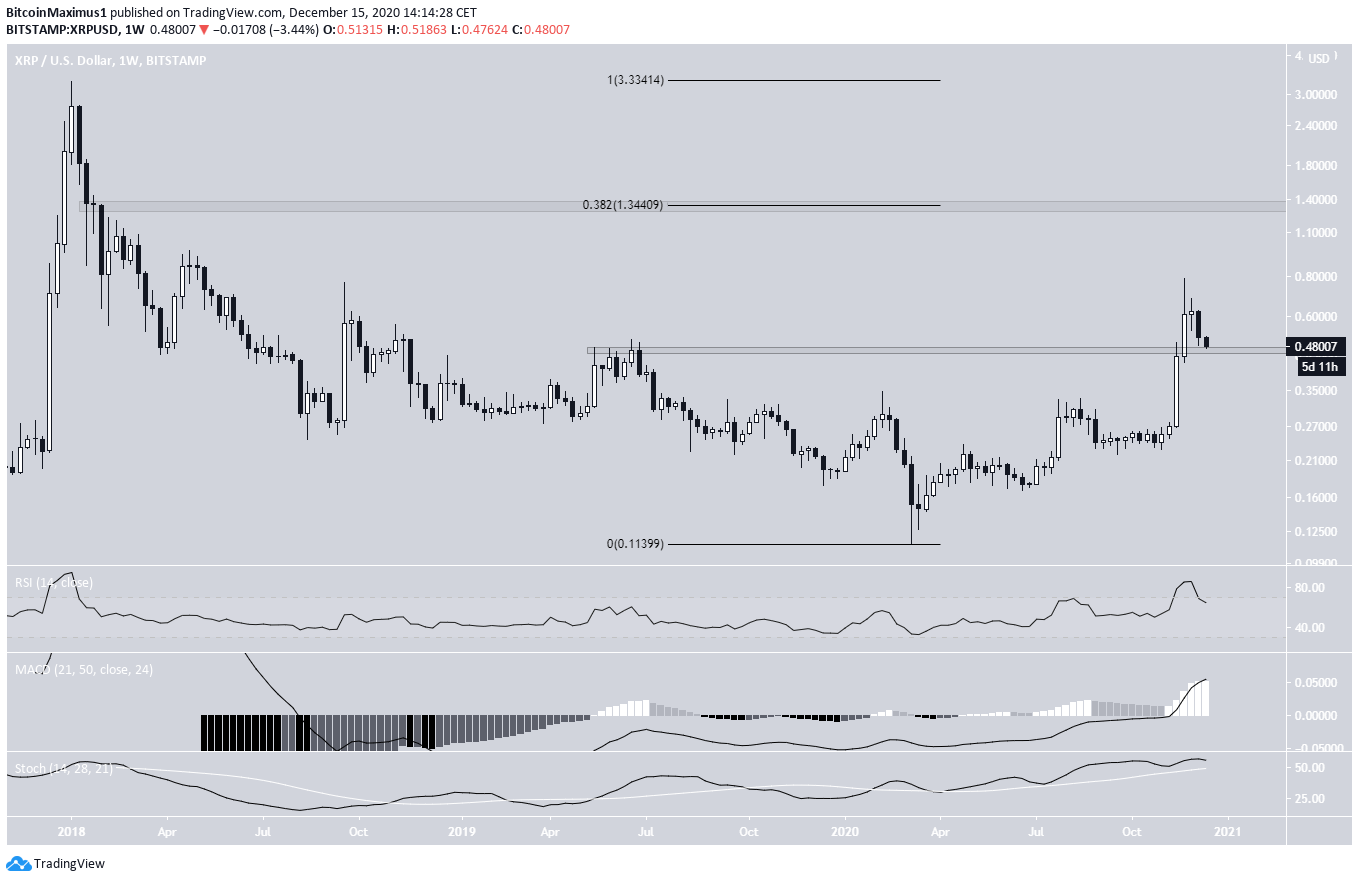
On Nov. 21, the XRP price moved above the $0.48 area, which had been acting as resistance since the beginning of 2019. It reached a high of $0.79 on Nov. 24 but has been declining since, leaving a long upper wick in place.
The price returned to the $0.48 area again, possibly validating it as support in the process.
Technical indicators on the weekly time-frame are bullish, supporting an upward move.
If XRP begins to rally, the next closest resistance area would be at $1.34.
Ongoing Decline
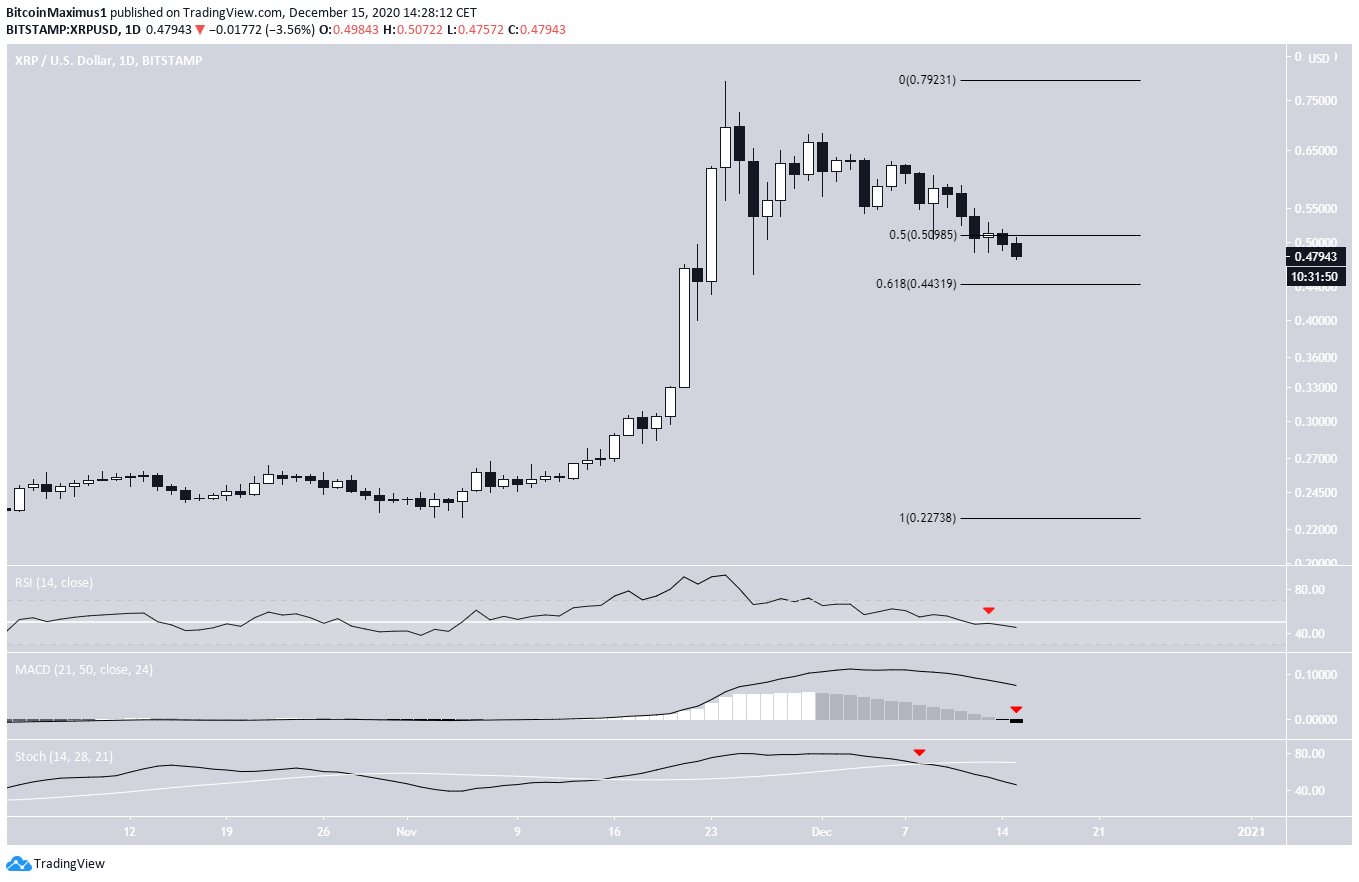
The daily chart shows that XRP is currently trading between the 0.5 – 0.618 Fib retracement levels of the most recent upward move at $0.44 – $0.51. This is a very likely area for a reversal and also coincides with the previously outlined long-term support.
Despite this, technical indicators on the daily time-frame are firmly bearish. All three of the: RSI, MACD, and Stochastic Oscillator are moving downwards, the latter having just made a bearish cross.
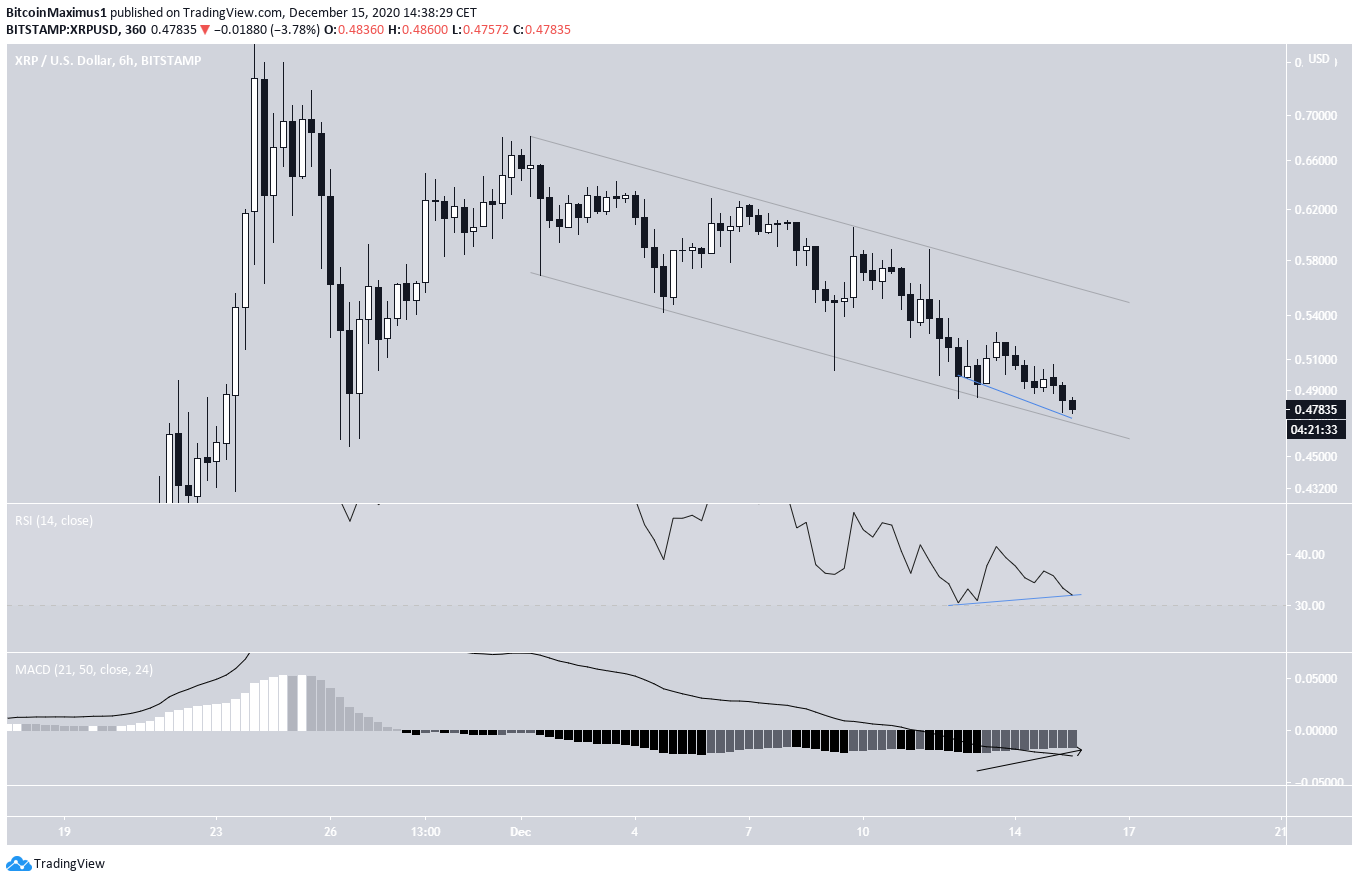
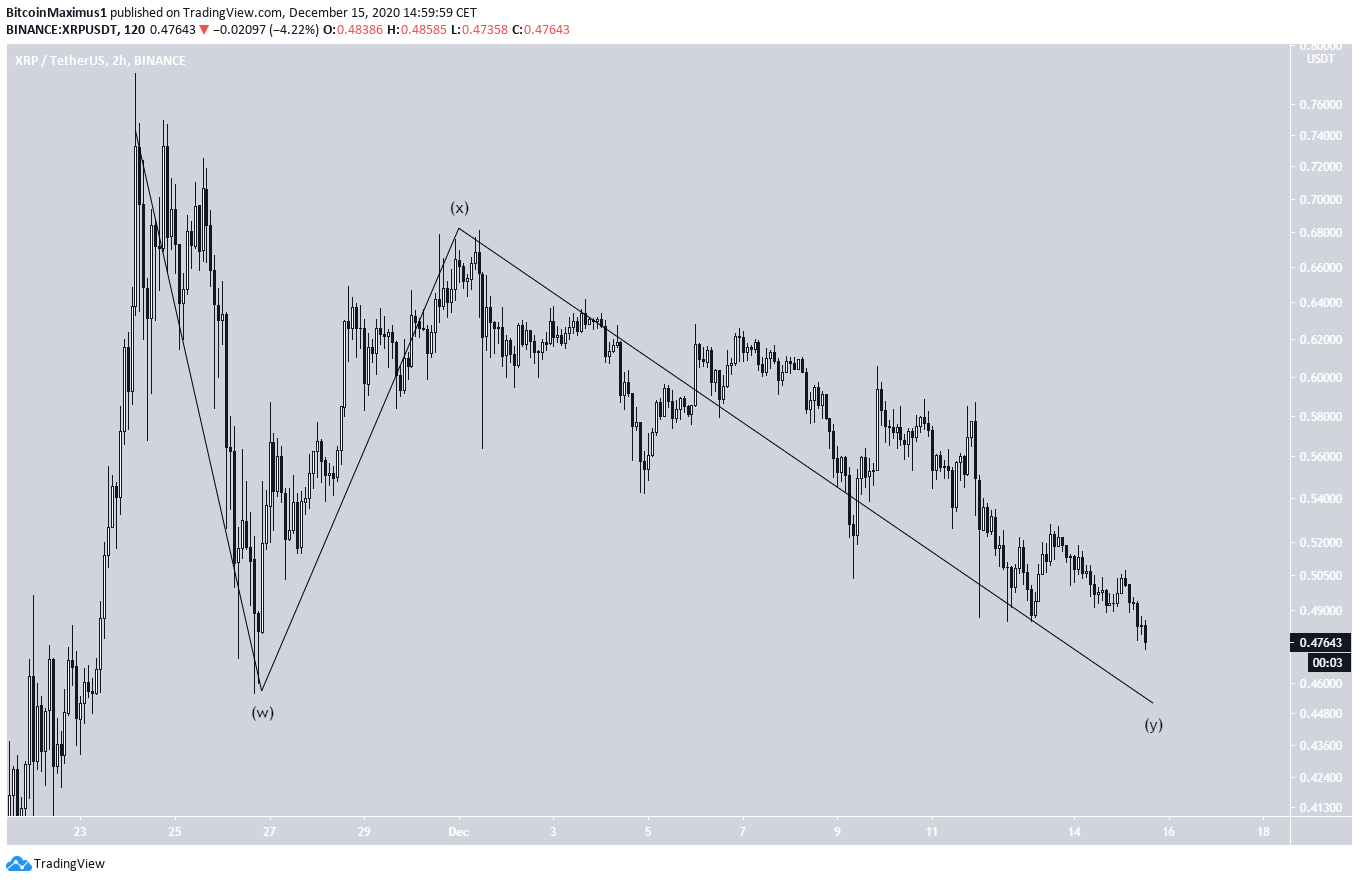
A closer look reveals that the movement since Dec.1 is perfectly contained inside a parallel channel. It’s slow and choppy and indicates that it’s probably a corrective movement.
Both the RSI and MACD are forming bullish divergence. Combine this with the fact that it’s trading inside a strong support area, and a bounce seems likely.
Wave Count
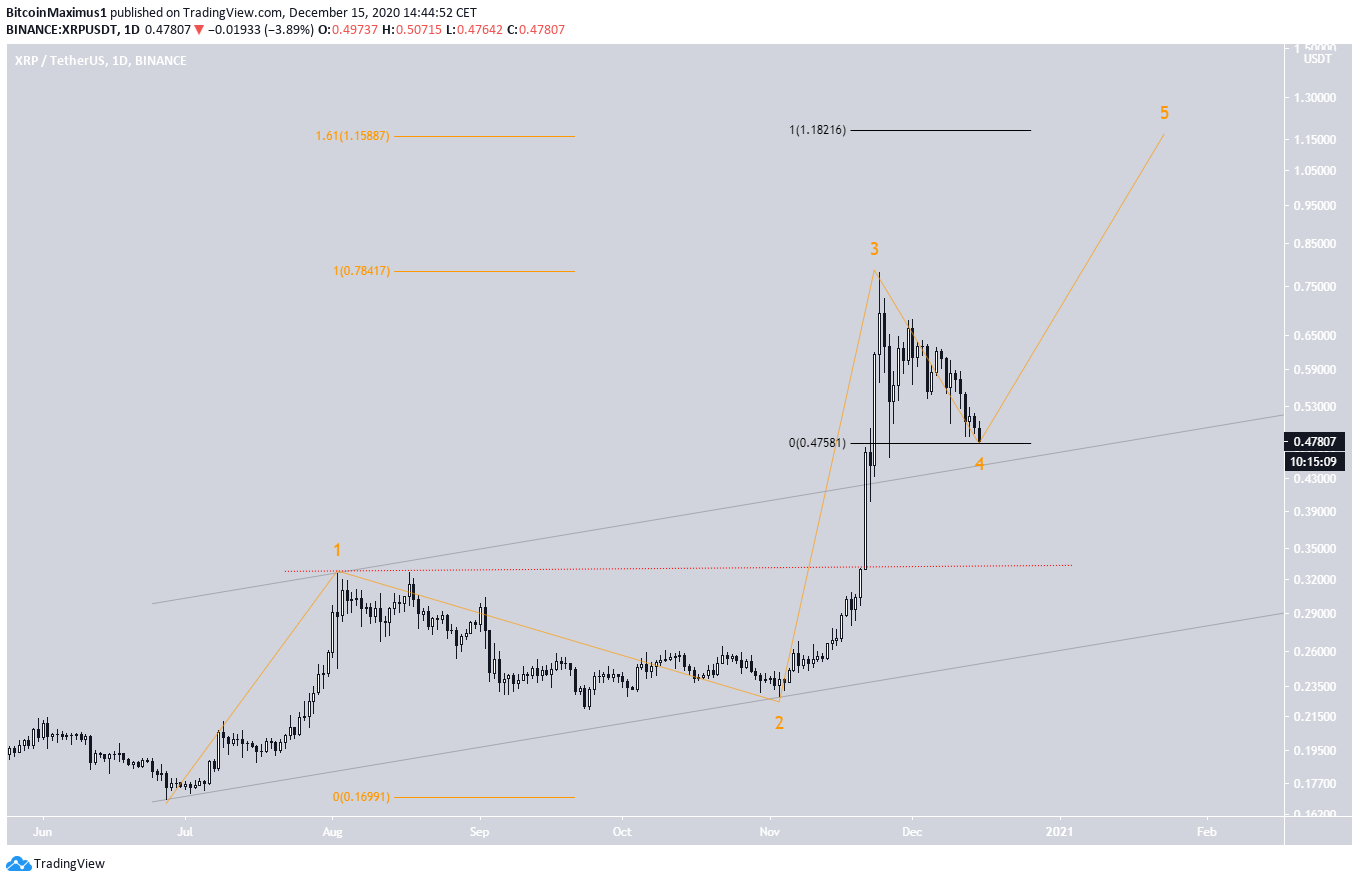
The wave count suggests that XRP began a bullish impulse once it reached a low on June 27. This was confirmed after the breakout from the parallel channel connecting waves 1 and 2 (shown in orange in the image below).
Currently, XRP is close to touching the channel’s resistance line, in what could be described as a 4th wave pullback.
If correct, XRP will soon begin another upward move to complete wave 5. A likely target for the top of wave 5 would be between $1.16 and $1.18, the 1.61 Fib extension of waves 1 – 3 (orange) and the projection of the length of waves 1-3 to the bottom of 4 (black).
A fall below the wave 1 high at $0.326 (dashed red line) would invalidate this particular wave count.
Cryptocurrency trader @Thetradinghubb tweeted an XRP chart in which price is trading inside a triangle. He believes this is a 4th wave triangle.
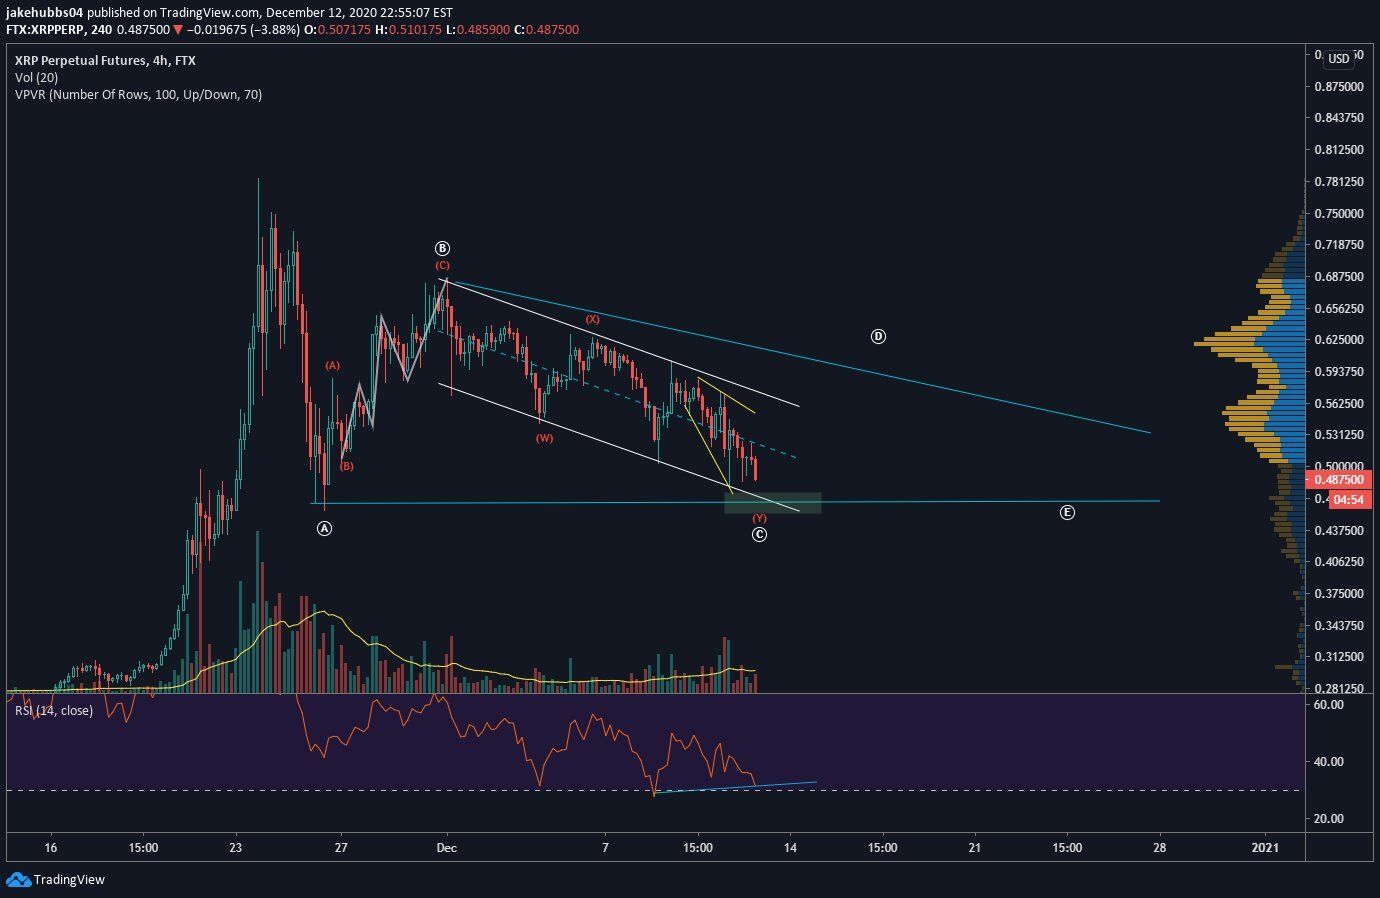
While XRP is most likely in its fourth wave, as stated above, it’s not yet determined if the correction has taken the shape of a triangle.
It almost looks like a descending triangle. It’s also possible that XRP is nearing the end of a complex, W-X-Y correction and will then move upwards.
In any case, it seems that XRP is nearing the end of its corrective structure.
Conclusion
To conclude, the XRP price should reach a bottom soon, possibly between $0.45 – $0.47, and begin to move upwards, eventually increasing above $1.
For BeInCrypto’s latest Bitcoin (BTC) analysis, click here!
Disclaimer: Cryptocurrency trading carries a high level of risk and may not be suitable for all investors. The views expressed in this article do not reflect those of BeInCrypto.


