


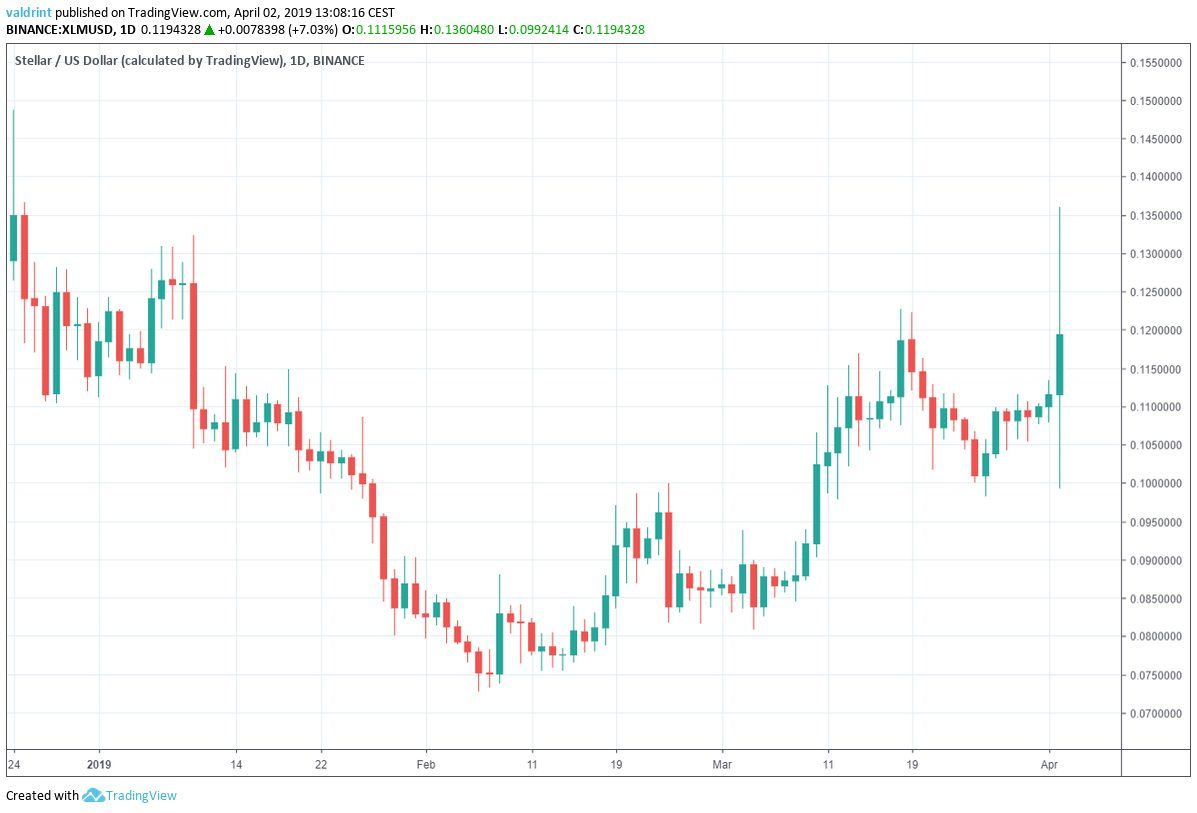
On Dec 24, 2018, the price of Stellar lumens (XLM) was trading at $0.148. A sharp drop began the next day, followed by a long, gradual decrease.
The price made a bottom at $0.0727 on Feb 6, 2019. It has been on a gradual uptrend since.
Below is a look at the daily price of Stellar Lumens throughout the first quarter of 2019:
Stellar Lumens (XLM): Key Trends And Highlights
- The price of XLM/USD began a downtrend on Dec 24 and made a bottom on Feb 7.
- Stellar lumens have been trading inside an ascending channel since Mar 5.
- Lumens are currently trading below the 100 and 200-period moving averages.
Ascending Channel
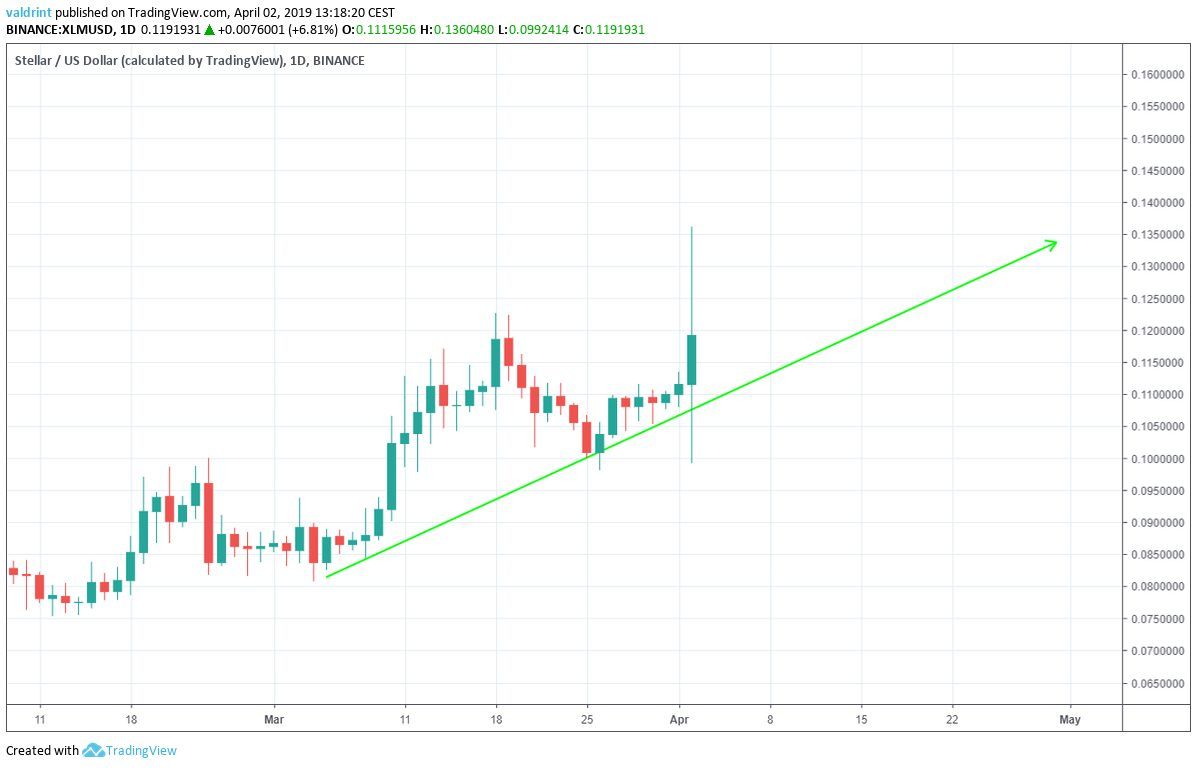
On Mar 4, the price made a low of $0.08. A sharp upward move was followed by a gradual decrease.
Tracing the low since Mar 4 generates an ascending resistance line:
On Feb 19, the price reached a high of $0.097. A gradual decrease ensued. It was followed by a sharp increase.
XLM has made successively higher highs. Tracing these highs gives us a horizontal resistance line.
Together, support and resistance generate an ascending parallel channel:
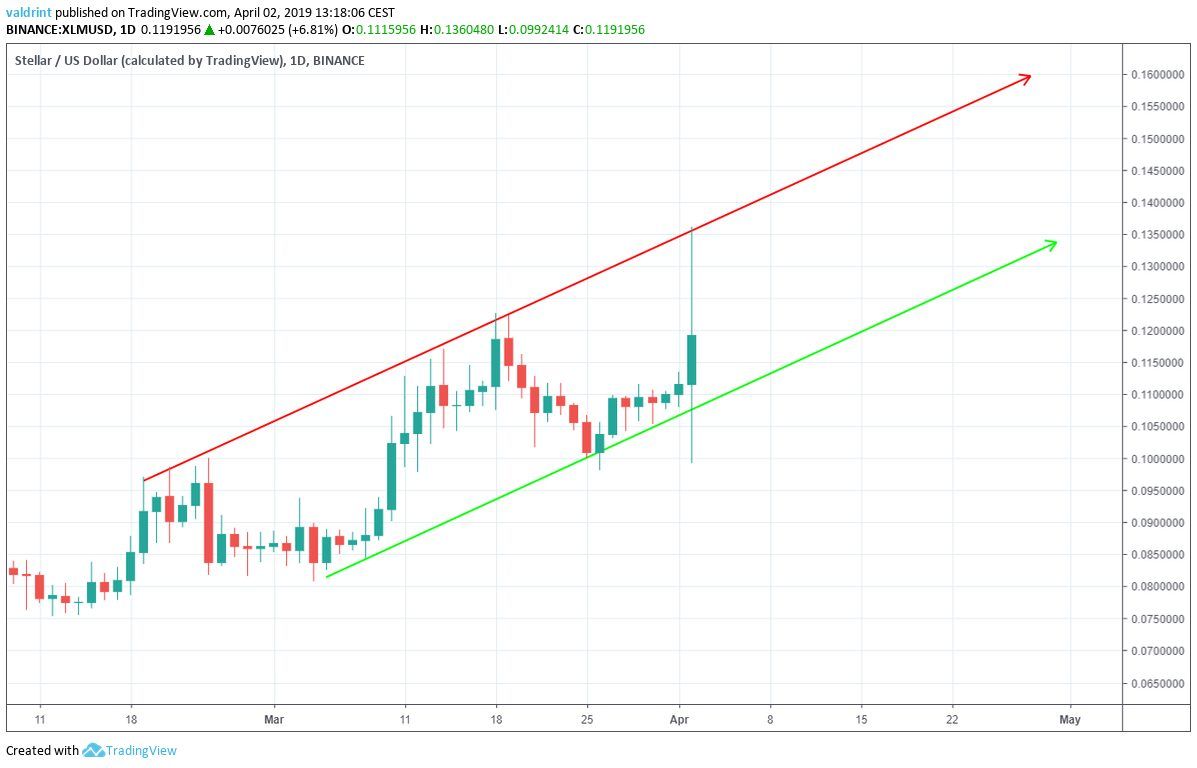
Price has generally increased and decreased within this channel since March. As a result, Stellar lumens have seen steady price gains despite volatility.
If the current trend continues, greater price increases may be expected.
Moving Averages
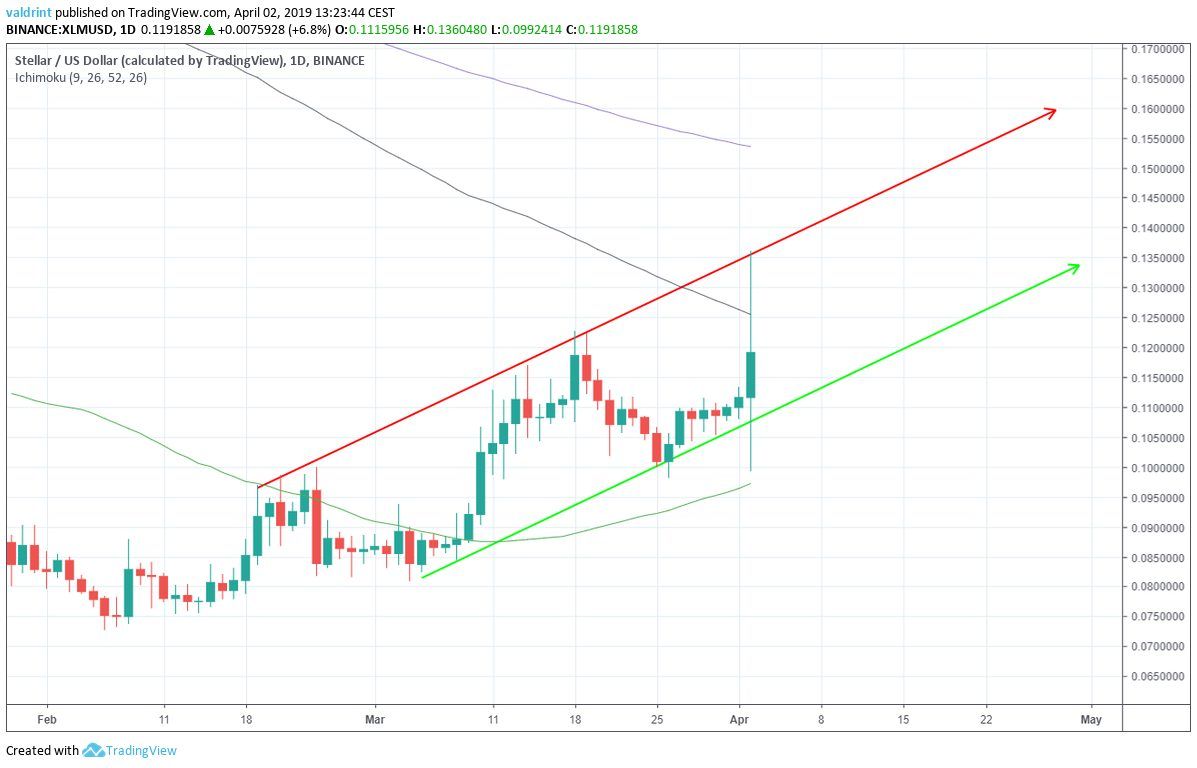
On Mar 9, the price moved past the 50-day MA (green).
The 100-day MA was breached for a brief period on Apr 2. However, Stellar Lumens fell below this level shortly thereafter. At the time of writing, it has yet to push past this MA.
In addition, Stellar Lumens are is trading well below the 200-period MA—which is currently at $0.155.

When Bitcoin broke out of its trading pattern to reach $5000 on Apr 2, it had moved past all three MAs. Stellar lumens is still struggling to move past 100- and 200-day MAs suggesting that a breakout in the near future may not be likely.
Possible Divergence
We now turn to other technical indicators. These include MACD and RSI.
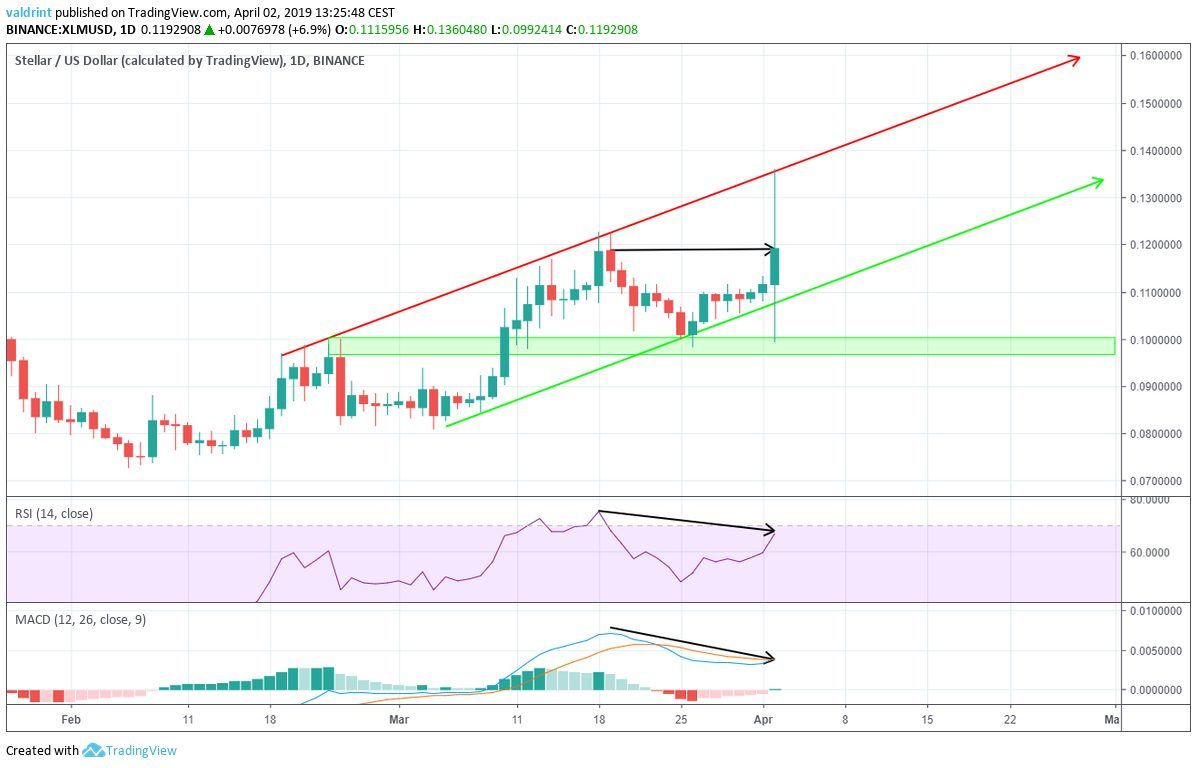
On Mar 19, the price reached a high of $0.122, before closing at $0.114. It reached the same level on Apr 2.
Similarly, the RSI and the MACD reached the first high on Mar 19. However, they have proceeded to generate lower values since.
This is known as bearish divergence and often precedes price decreases. Based on this, a breakdown appears more likely than a breakout.
However, prices may rise toward thre resistance line of the channel before drop toward support. A breakdown below support appears possible.
April Price Prediction
We now include support areas in the analysis to generate a final prediction for possible price movements that Stellar lumens (XLM) might experience in April.
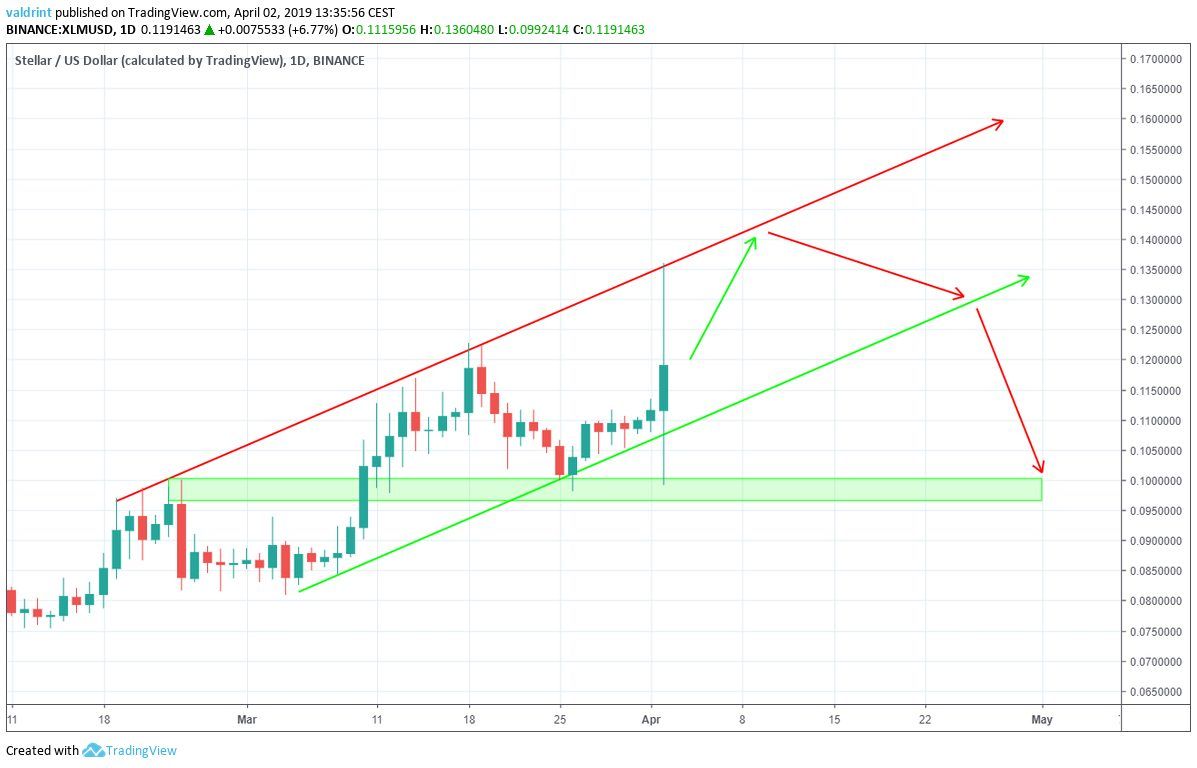
Continuing from the conclusion in our previous section, we believe that the price of XLM will increase throughout the month of April before breaking down.
We cannot confidently predict when this breakdown will occur.
However, when a breakdown occurs, it is likely that the price will find support near $0.1. This is the closest support area traced in the graph above.

Furthermore, We believe that the price will be trading between $0.1 and $0.14 at the end of April. If a breakdown does not occur in April, the price is likely to be trading between $0.12 and $0.14. If a breakdown occurs, it is likely to be trading between $0.1 and $0.12.
Do you think the price of XLM will eventually breakdown from the channel? When will that happen? Let us know your thoughts in the comments below!
Disclaimer: This article is not trading advice and should not be construed as such. Always consult a trained financial professional before investing in cryptocurrencies, as the market is particularly volatile.


