
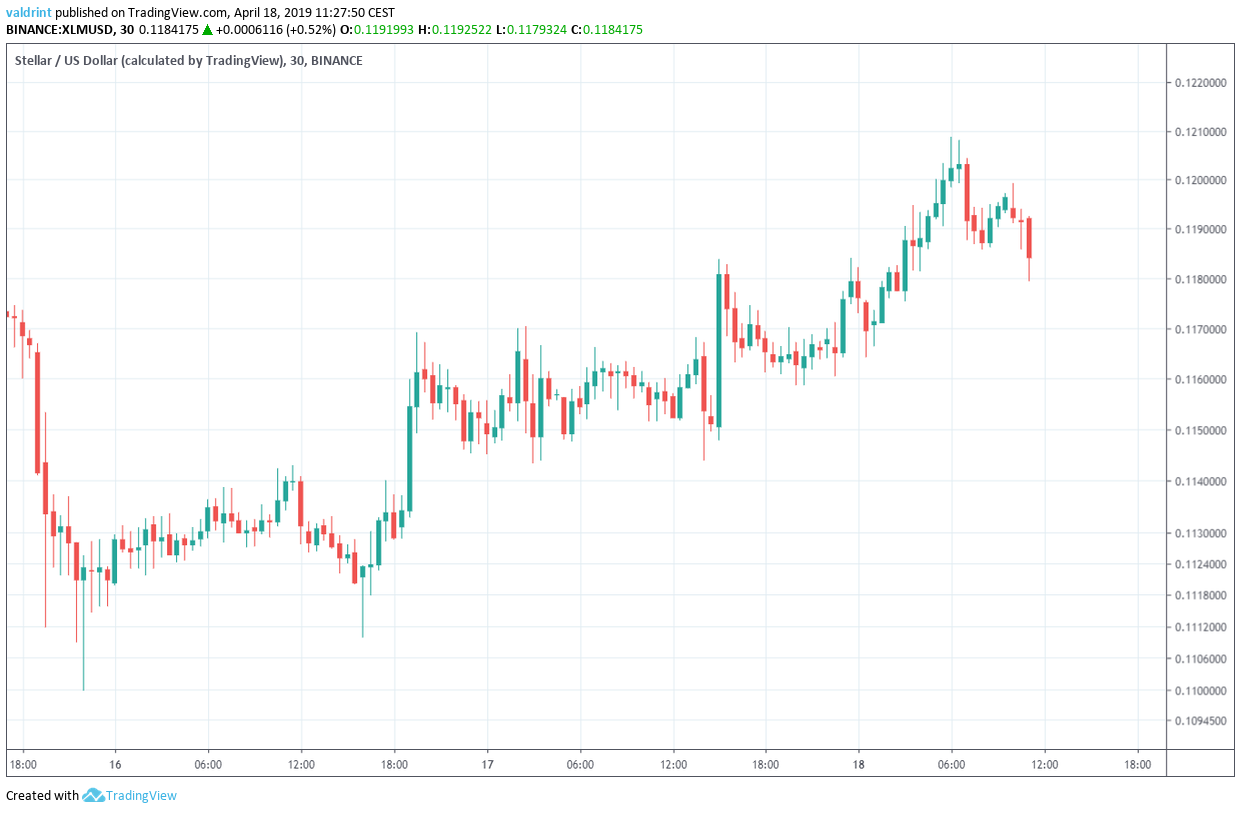
On Apr 16 2019, the price of Stellar Lumens reached a low of $0.11 and €0.097. A gradual increase ensued and the price reached a high of $0.12 and €0.106 on Apr 18.
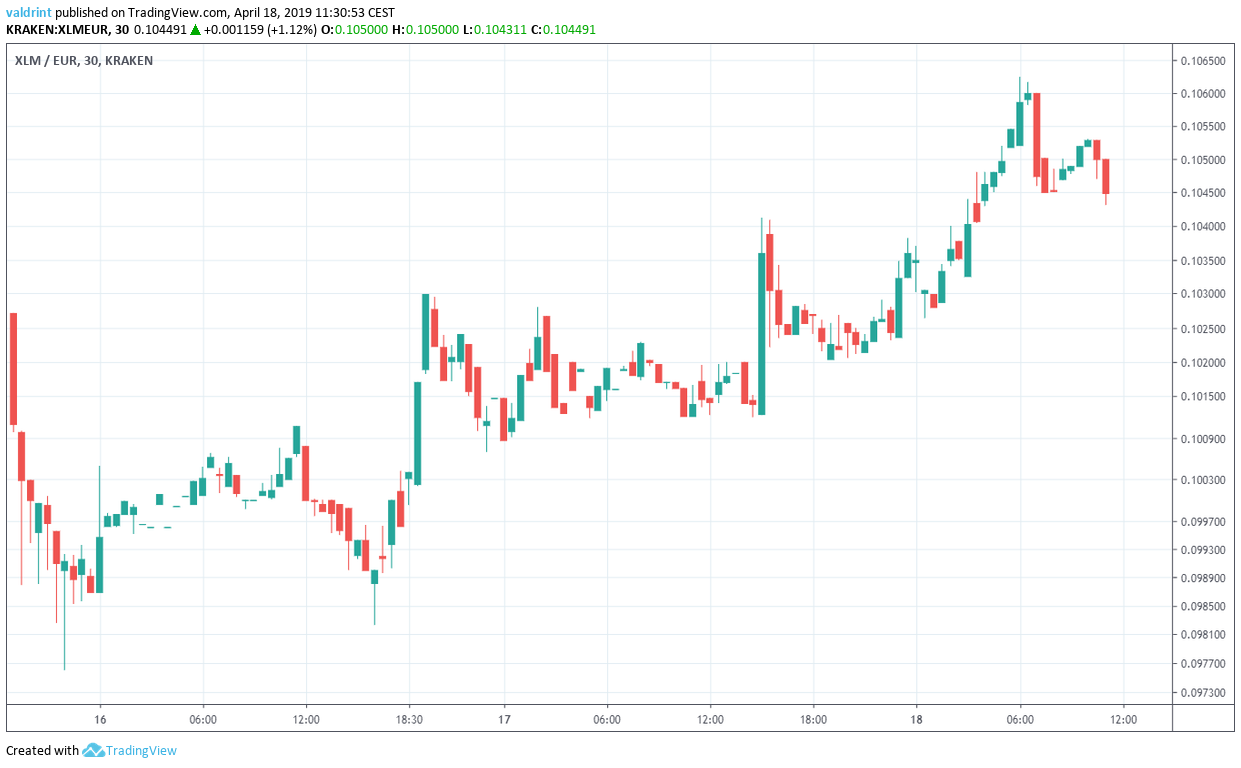
Will the price of Stellar lumens keep going up or should we expect a reversal soon?
Let’s find out:
Stellar Lumens (XLM): Highlights for April 18, 2019
- The price of Stellar lumens has been on an uptrend since Apr 16.
- Since then, XLM has been trading inside an ascending channel.
- It is trading inside a longer-term horizontal channel.
- There is bullish divergence developing in the RSI and the MACD.
- There is resistance near $0.125 and €0.11.
Current Trading Pattern for Stellar Lumens
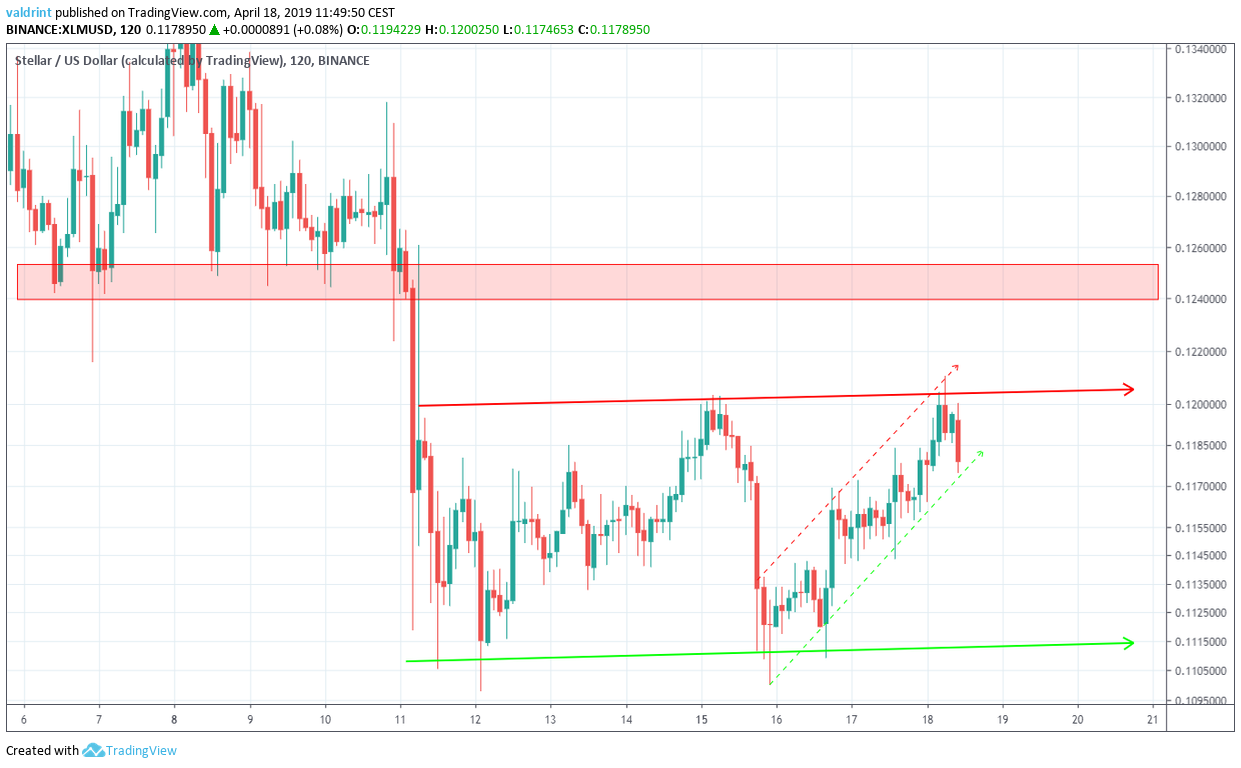
On Apr 15, the price reached a low of $0.10. A gradual decrease ensued, and the price made several higher lows. Tracing these lows gives us an ascending support line:
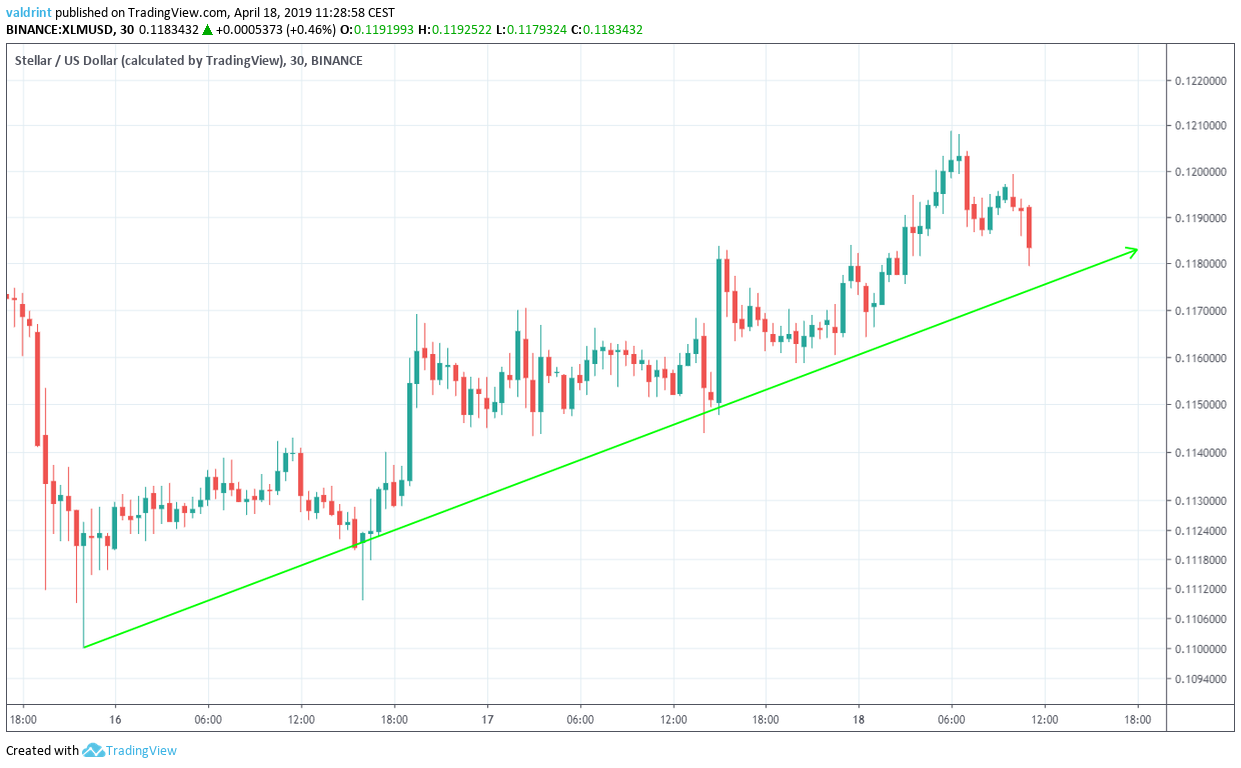
On Apr 15, the price reached a high of $0.113. Several market cycles have been completed since and the price has reached the same level three times.
Tracing these highs gives us an ascending resistance line.
The support and resistance lines combine to create an ascending channel:
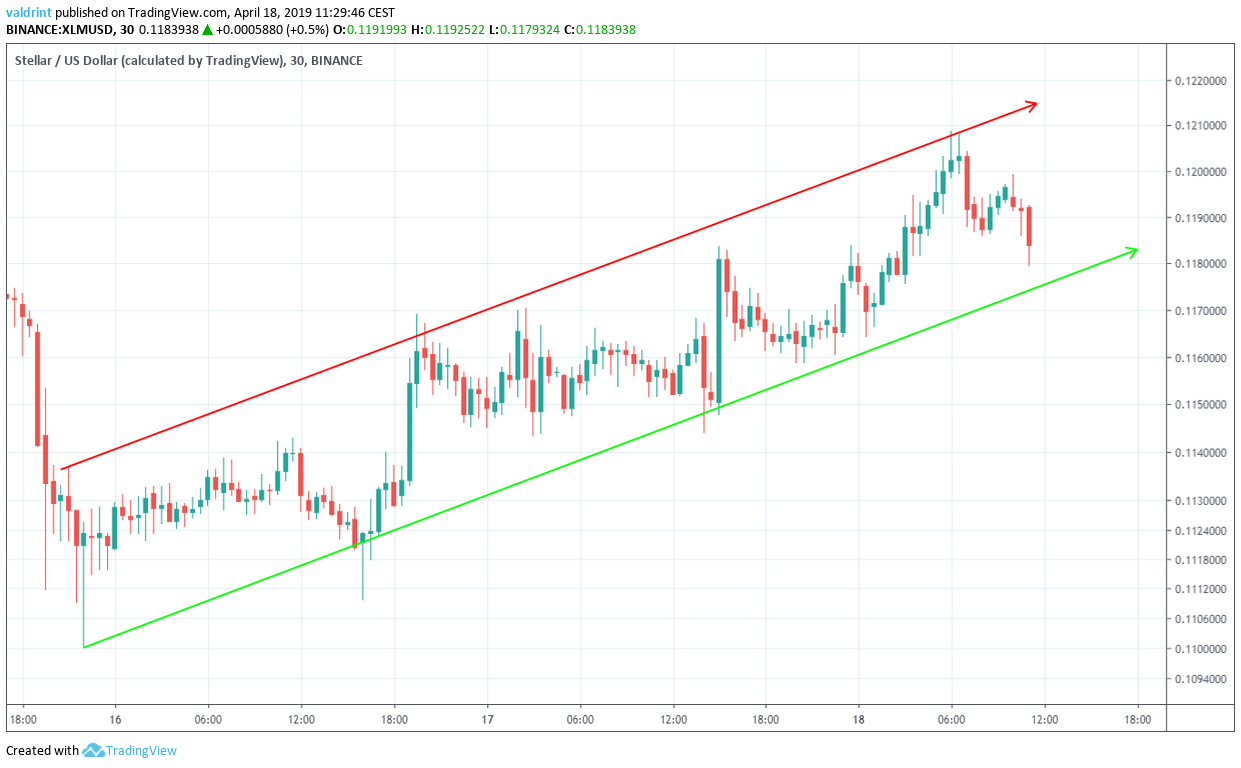
It is likely that the price will keep trading inside the confines of this ascending channel until a decisive move occurs. In order to predict the direction of the move, we need to take a look at a longer time frame combined with technical indicators.
Technical Indicators
The relative strength index (RSI) is an indicator which calculates the size of the changes in price in order to determine oversold or overbought conditions in the market.
Both are shown in the charts below:
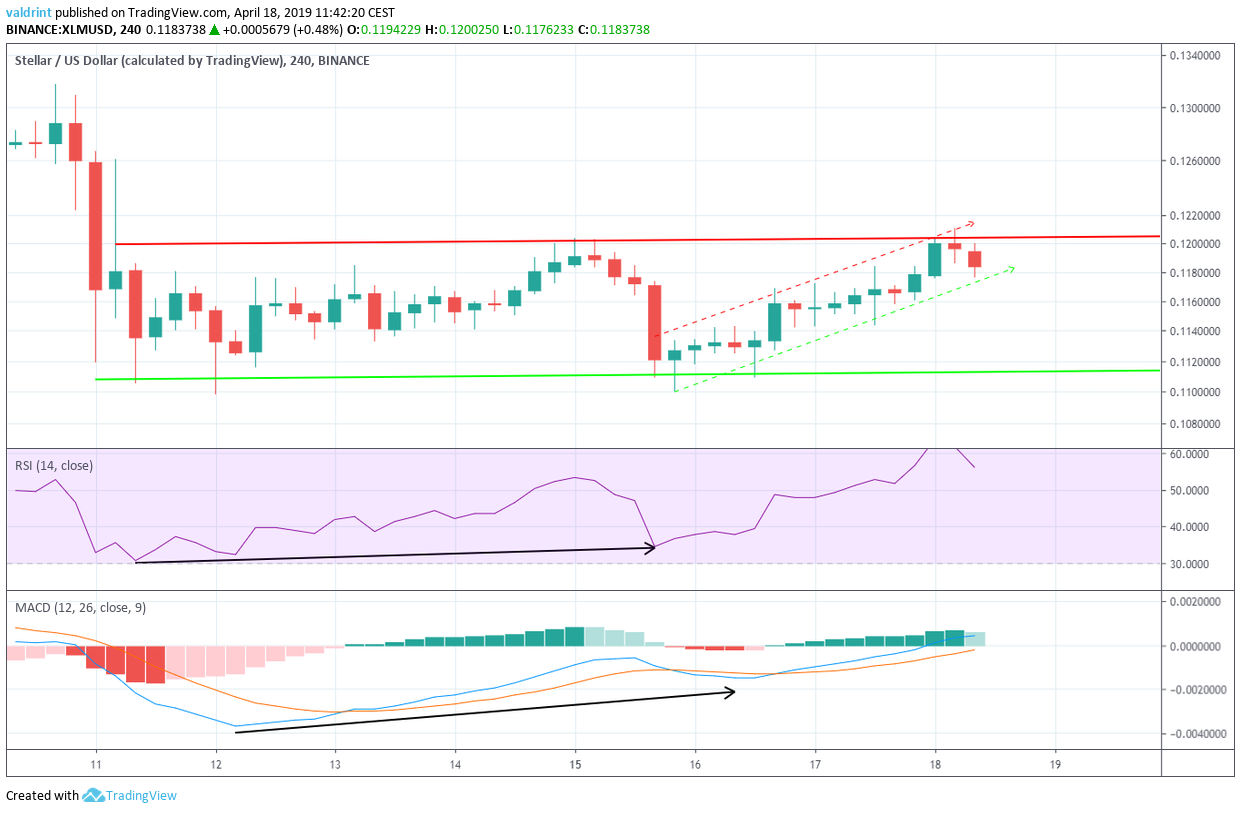
The price made a low of $0.111 on Apr 11. It made a lower low of $0.109 on Apr 15.
Similarly, the RSI and the MACD made the first low on Apr 11. However, they have continued to generate higher values since.
This is known as bullish divergence and often precedes price increases.
The use of these indicators suggests that the price will eventually break out from the channel. However, it is possible that it first drops to the support line before continuing its upward move.
Resistance Areas
To determine the actual possible future price levels, we incorporate resistance areas into the analysis.
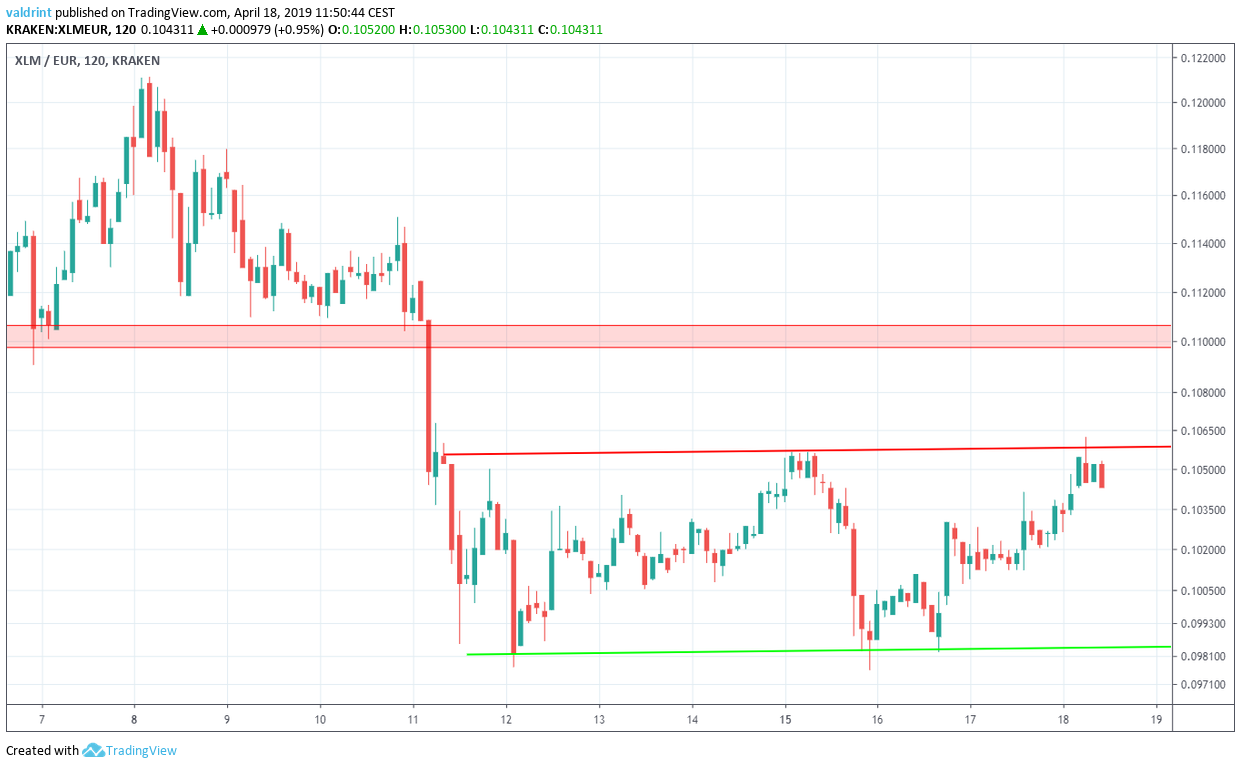
The closest resistance area is found near $0.125 and €0.1. We believe that the price is likely to reach this area in the future.
However, a drop towards $0.11 and €0.098 is possible before a breakout.
Summary of Analysis
Based on this analysis, the price of Stellar lumens is likely to keep trading inside the confines of the horizontal channel. Price drops may precede greater price gains. When the gains occur, we may see a breakout. However, a breakdown appears unlikely.
Do you think the price of XLM will break out from the channel? Let us know in the comments.
If you’re interested in Stellar lumens price predictions for 2019 and 2020, click on the green button below:
Disclaimer: This article is not trading advice and should not be construed as such. Always consult a trained financial professional before investing in cryptocurrencies, as the market is particularly volatile.
