


On Apr 2, the price of Stellar Lumens began a rapid upward movement. It reached a high of $0.136 on Apr 3.
Since the high, XLM/USD followed a downtrend to a bottom on Apr 4. A small rise followed on Apr 5, but the current highs are lower than on the third.
As a result, it appears as if XLM/USD is now trading along a new downtrend.
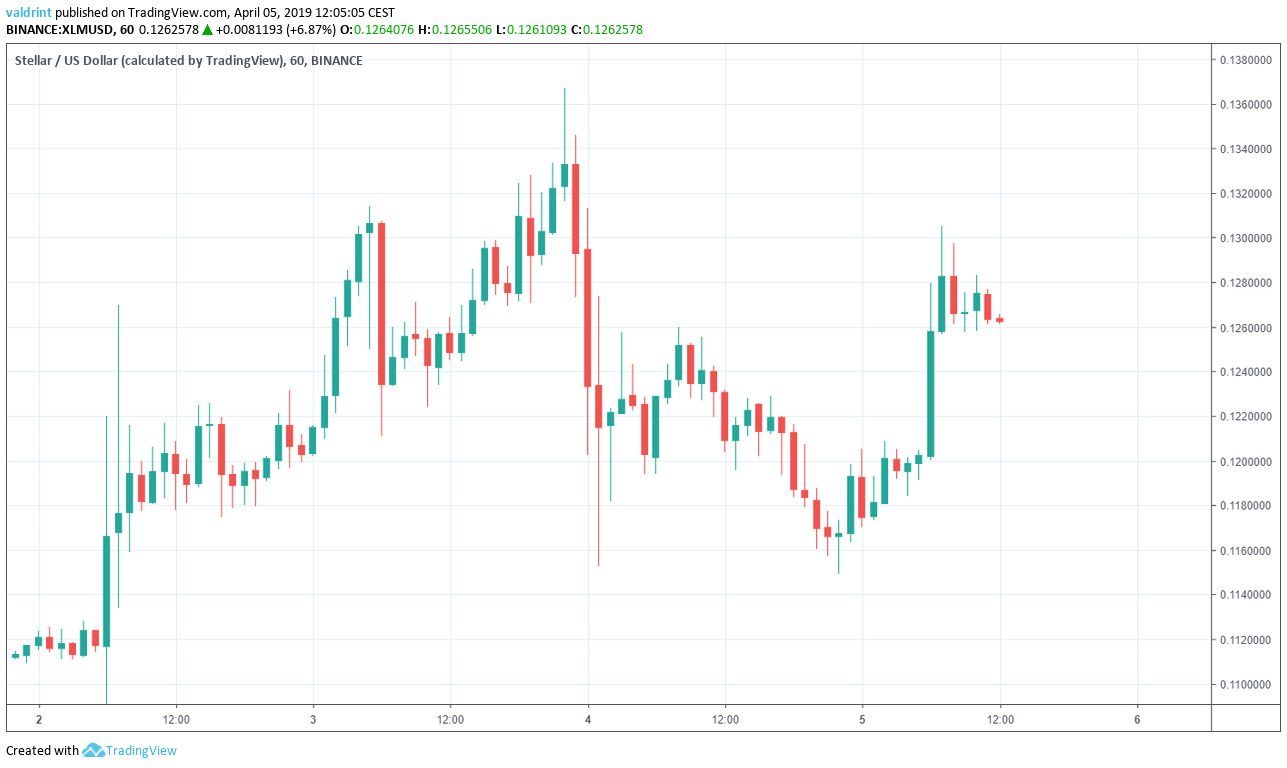
XLM Prices: Apr 2 – Apr 5
Will prices continue dropping or can we expect a reversal with higher highs?
Let’s find out.
Stellar Lumens (XLM): Highlights and Trends For April 5, 2019
- The price of Stellar lumens has been on a downtrend since Apr 3.
- XLM/USD has been trading inside a descending channel since Apr 3.
- There is bearish divergence developing in the RSI.
- The price has been trading inside a long-term ascending channel since Mar 4.
Ascending Channel
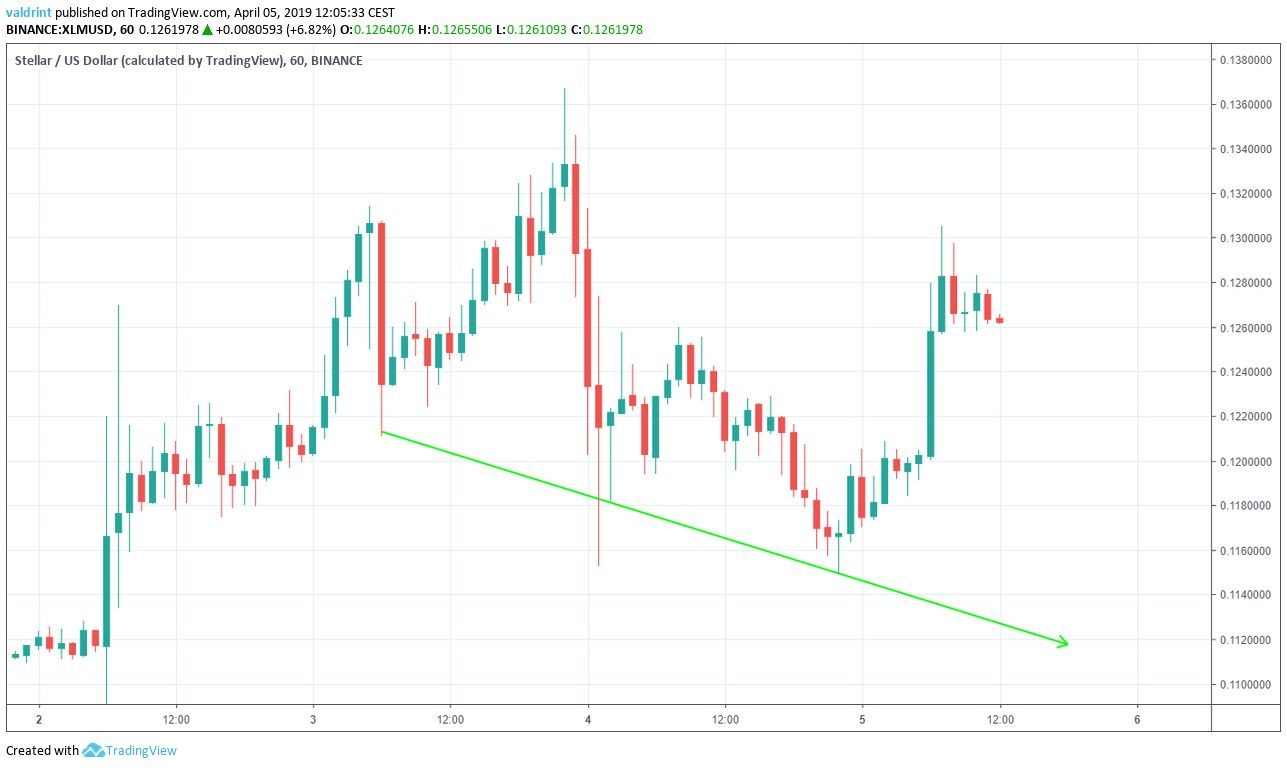
On Apr 3, the price made a low of $0.121. A rapid increase ensued, followed by a gradual decrease. The price made several lower lows.
Tracing these lows gives us a descending support line:
Apr 3, the price made a high of $0.136. Several market cycles have been completed since, with each high being lower than the previous one.
Tracing these highs gives us a descending resistance line.
The resistance and support lines combine to create a descending channel:
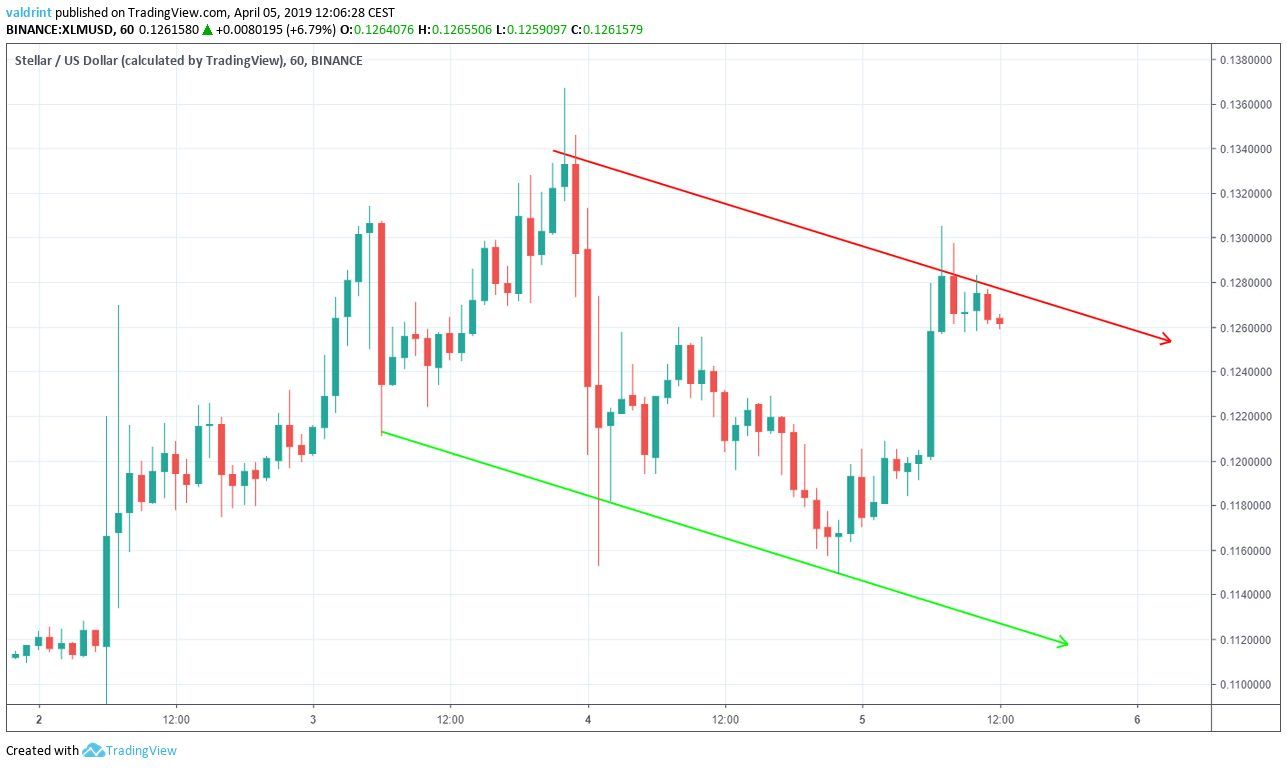
It is likely that the price will keep decreasing at the rate specified by the channel. However, to better assess possible price fluctuations, we need to take a look at technical indicators.
Bearish Divergence
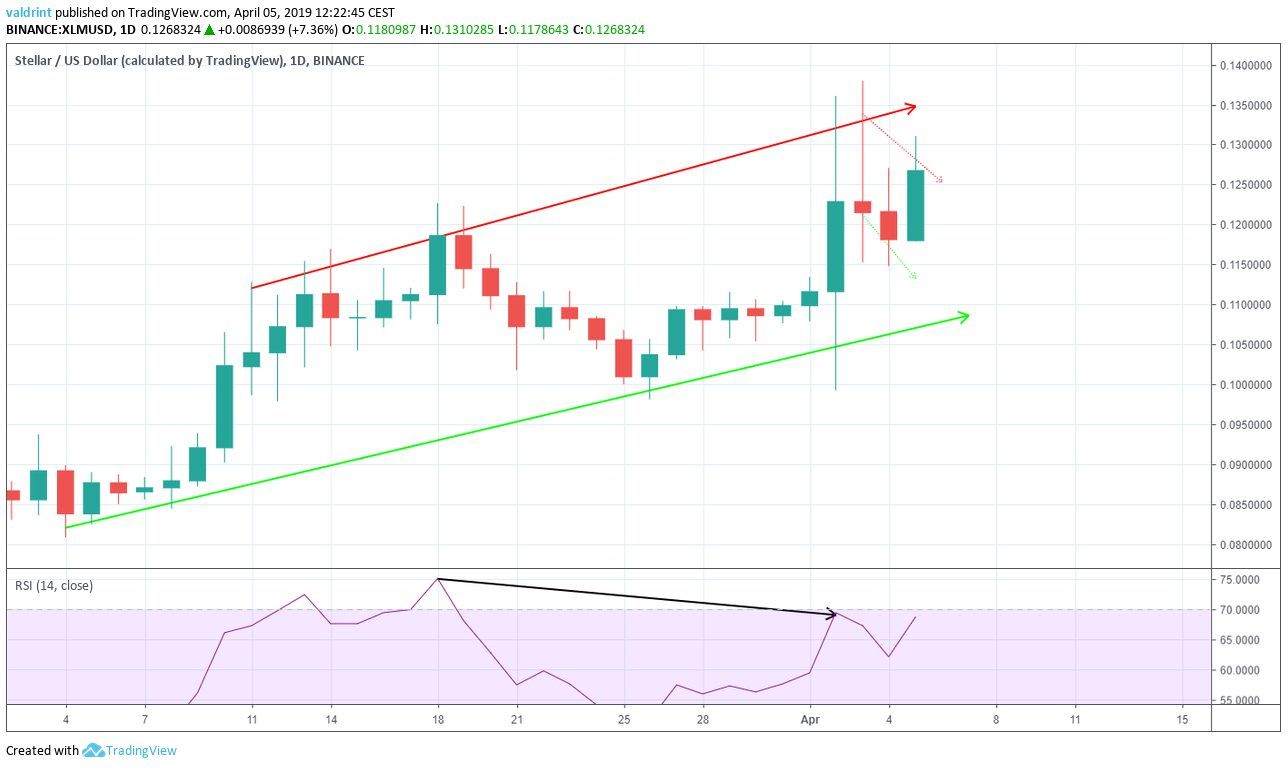
We can see that the price has been trading inside an ascending channel since Mar 4. The descending channel outlined in the section above is drawn with dotted lines.
On Mar 17, the price made a high of $0.122. It continued to make a higher high of $0.137 on Apr 3.
Similarly, the RSI made the first high on Mar 17. However, it has continued to create lower values since.
This is known as bearish divergence and often precedes price decreases.
The use of the RSI further suggests price losses toward the support line in the near future.
Invest in BTC with 0 Commission Here!
Summary of Analysis
Based on this analysis, the price of XLM is likely to decrease in the near future, and eventually, reach the support line of the channel.
Do you think the price of XLM will keep trading inside the channel? Let us know in the comments.
CLICK HERE FOR MORE ABOUT STELLAR LUMENS (XLM)
Disclaimer: This article is not trading advice and should not be construed as such. Always consult a trained financial professional before investing in cryptocurrencies, as the market is particularly volatile.


