
![Will XRP Break Out From Its Two-Year Downward Trend? [Premium Analysis]](https://beincrypto.com/wp-content/uploads/2019/08/bic_ripple_coin_xrp.jpg.optimal.jpg)
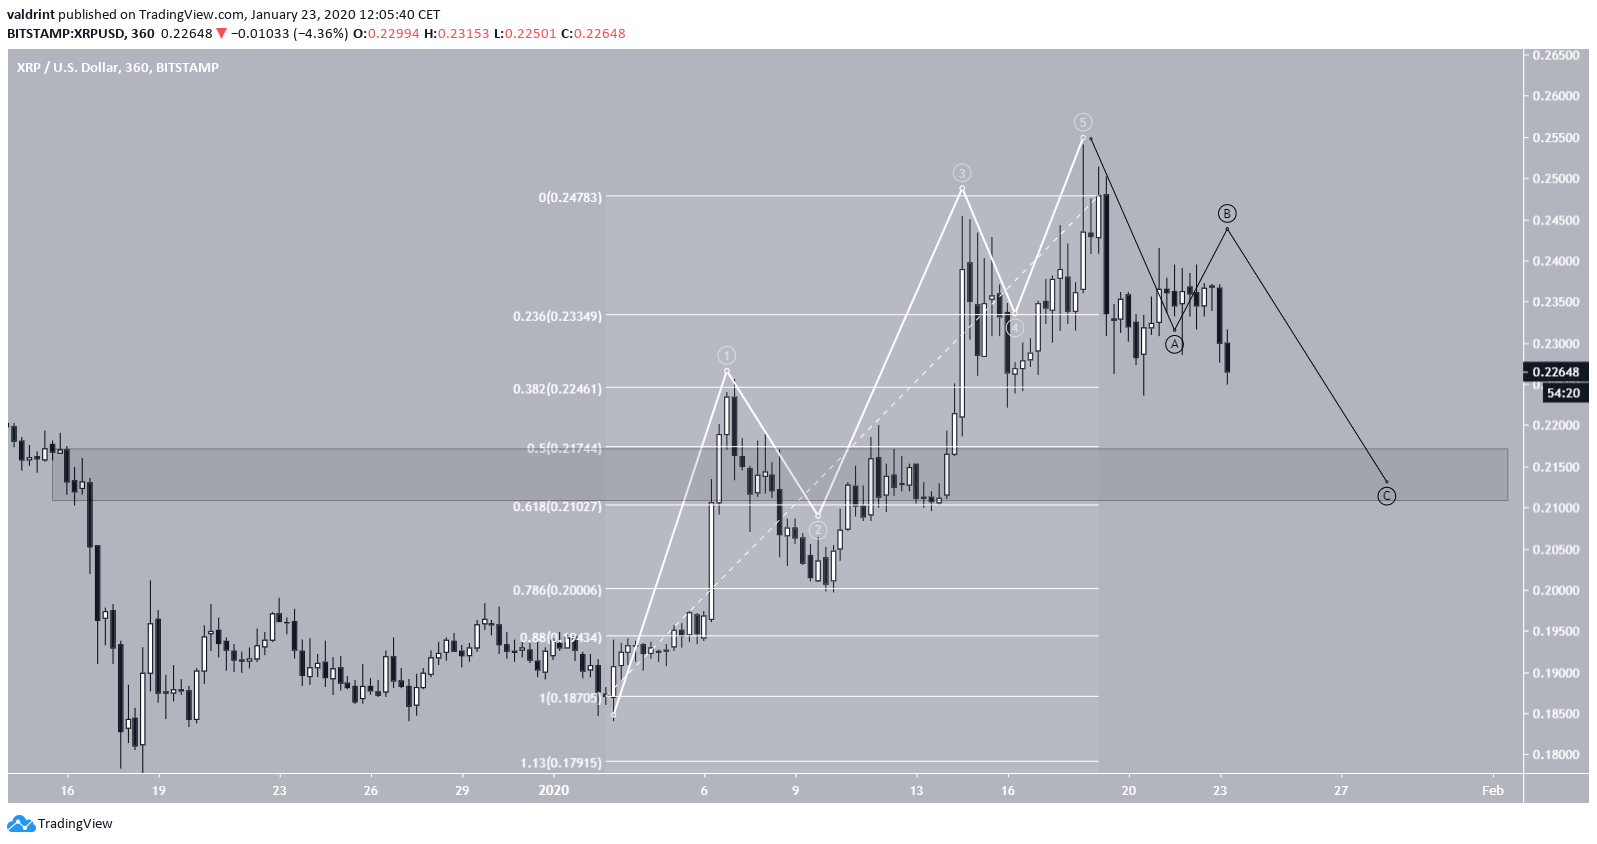
The XRP price completed a five-wave Elliott formation on January 18 and has been decreasing since. We believe it will complete the correction near $0.21 and resume its prior upward movement.
XRP Highlights
- The XRP price has been following a descending resistance line for 644 days.
- There is significant support at $0.2
- The price has completed a five-wave Elliott Formation.
- It is likely in the process of completing the C-wave of an A-B-C correction.
- The likeliest area for a reversal is found at $0.21-$0.215.
Let’s take a closer look at the XRP price and attempt to outline its future movement.XRP/USD wants one more leg lower imo. .21 on the way and it has to hold for a continued bullish push. I expect it to. $XRP pic.twitter.com/S2PA4fcwKd
— CrediBULL Crypto (@CredibleCrypto) January 23, 2020
Resistance Line
The XRP price has been following a descending resistance line since April 2018. Since April 2019, it began following a descending support line, creating a descending wedge in the process. Once the price reached the $0.2 support area, it began an upward move and has almost reached the resistance line. This area was the catalyst of the 2017 upward move that lead to an all-time high of $3.31 on January 4, 2018. However, there is no bullish divergence in the RSI to forecast a price breakout. Therefore, it is possible that the price revisits the $0.2 support area or even heads lower.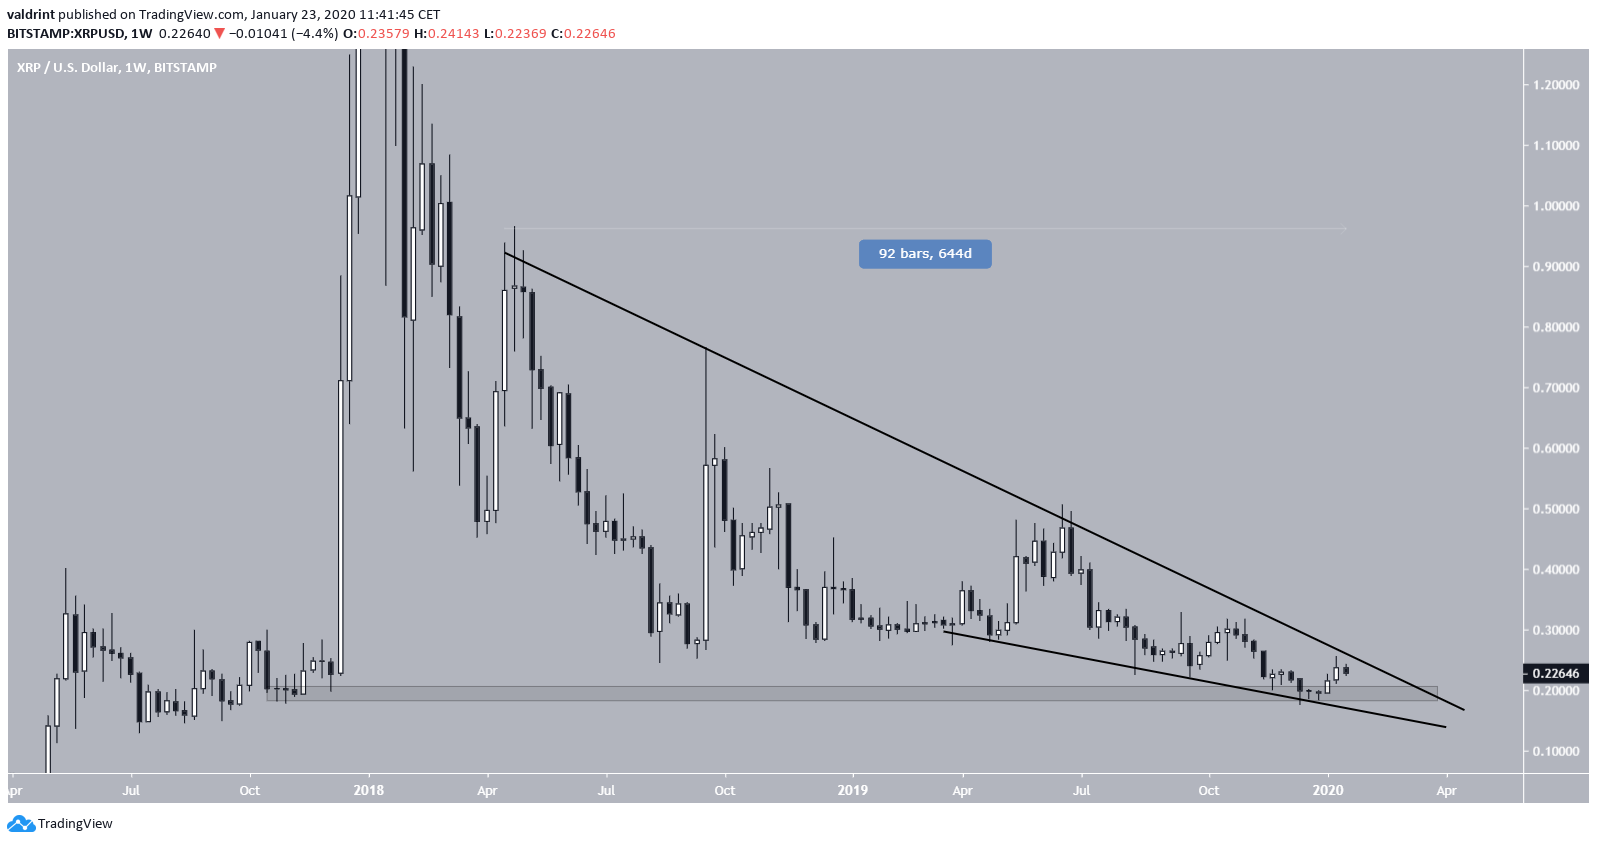
Elliott Formation
Beginning on January 3 with a low of $0.184, the XRP price began an upward move that transpired over five waves; three upward and two downward. Once it reached a high of $0.254 on January 18, the RSI generated bearish divergence. The weakness was confirmed when the RSI completed a failure swing top and validated the RSI support line as resistance. The price has been decreasing since.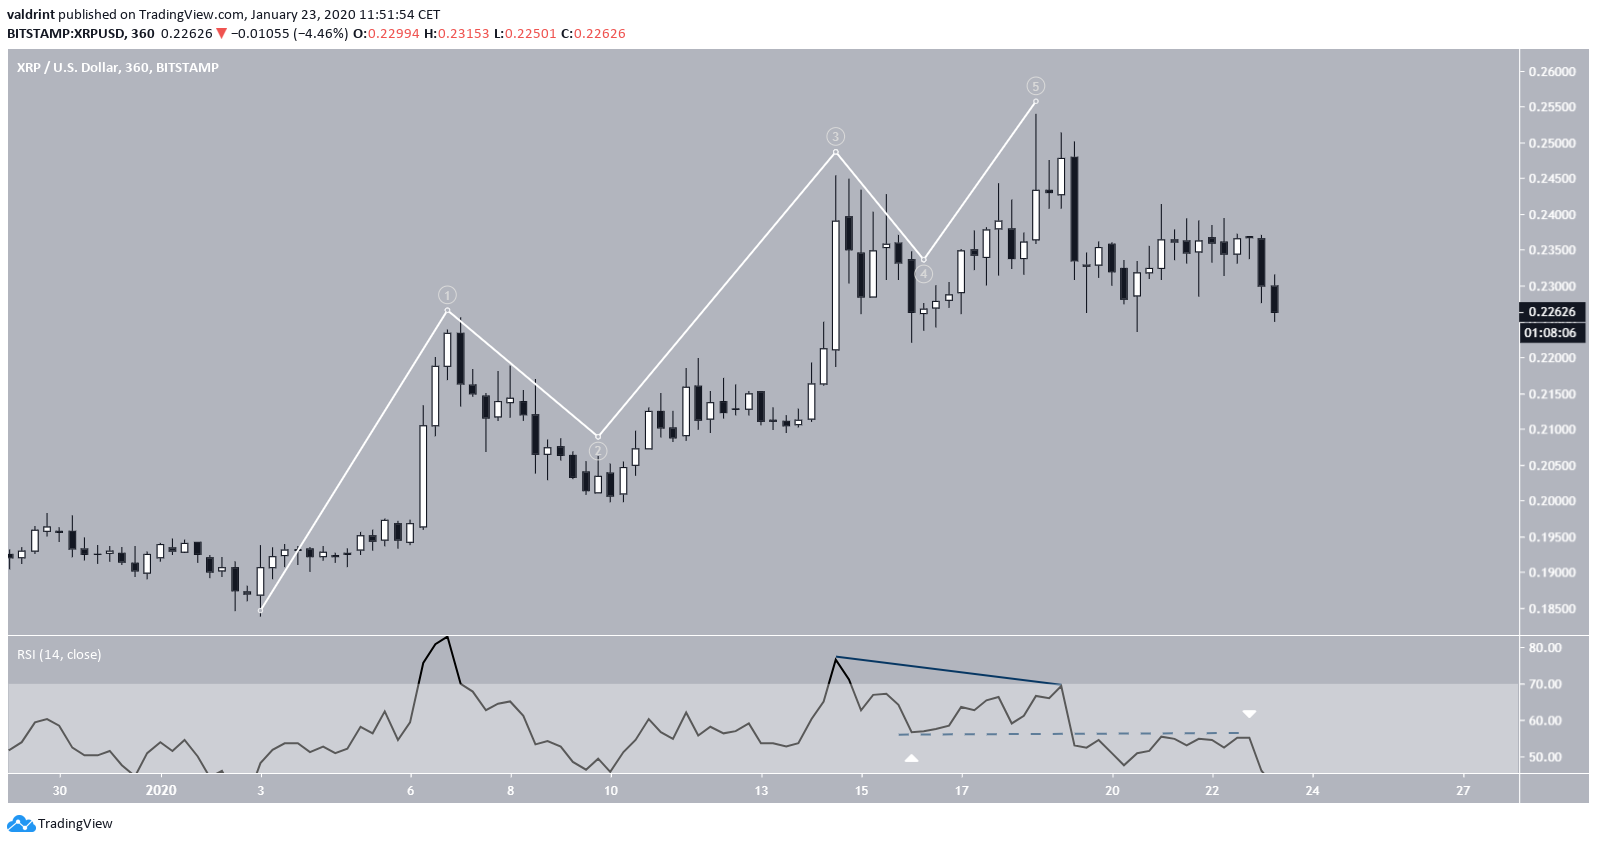 A very common correction pattern after such an increase would be an A-B-C correction. Based on the current movement, the price is in the process of completing the C wave. The likeliest place for it to do so would be near $0.21, between the 0.5-0.618 fib levels and also the previous breakdown level.
Thus, we agree with the hypothesis laid out in the tweet.
A very common correction pattern after such an increase would be an A-B-C correction. Based on the current movement, the price is in the process of completing the C wave. The likeliest place for it to do so would be near $0.21, between the 0.5-0.618 fib levels and also the previous breakdown level.
Thus, we agree with the hypothesis laid out in the tweet.
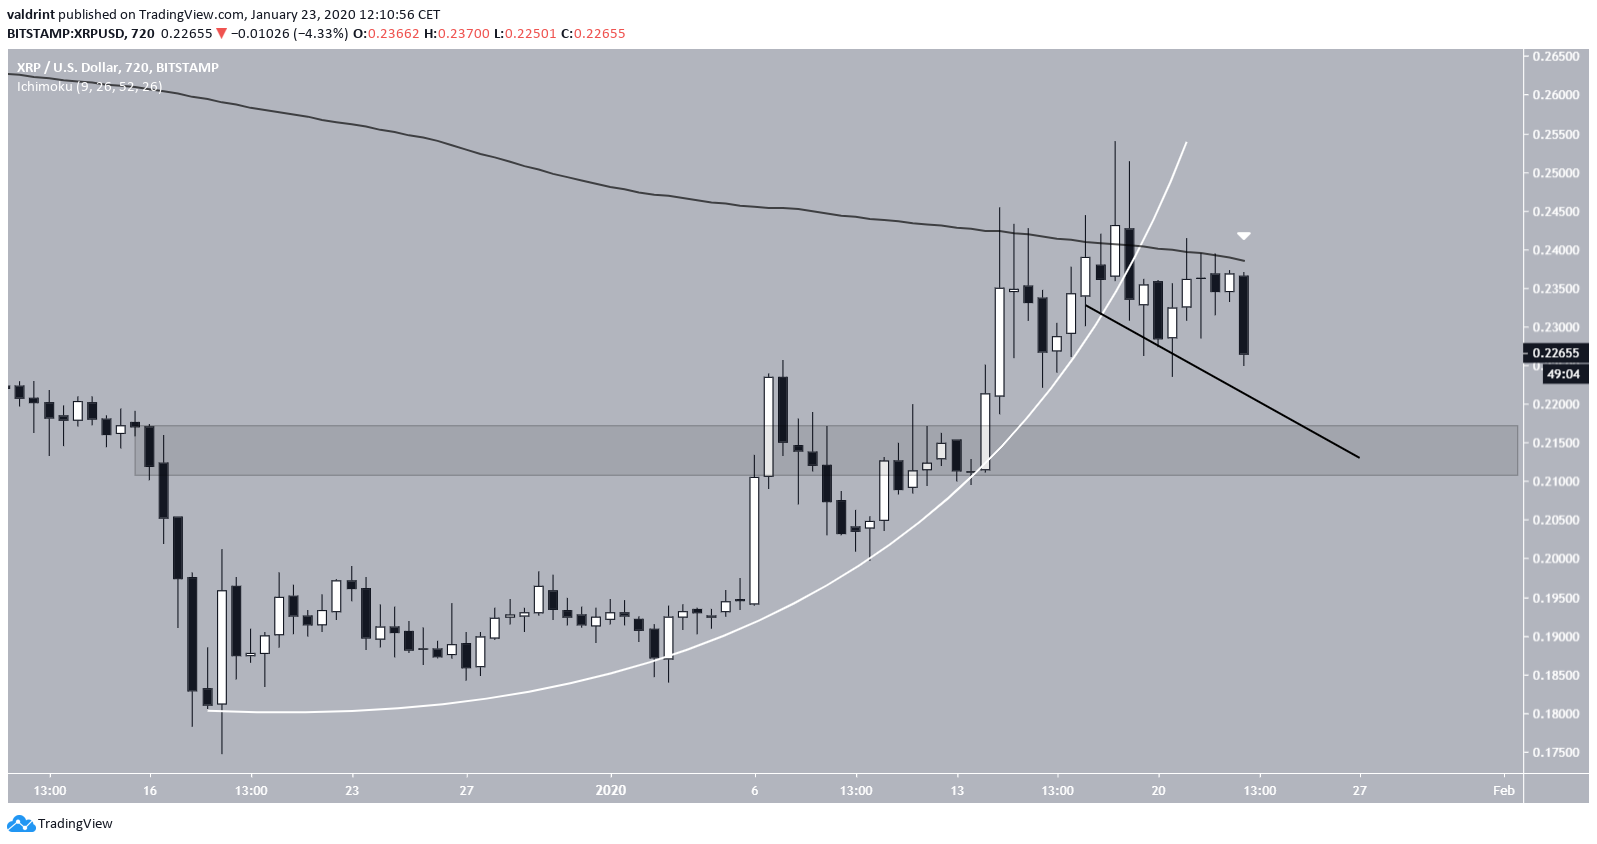
 This movement is also supported by the breakdown of the parabola and the 100-day moving average (MA) resistance.
If the price follows the possible descending support line in place, it would get to our support area by January 26.
This movement is also supported by the breakdown of the parabola and the 100-day moving average (MA) resistance.
If the price follows the possible descending support line in place, it would get to our support area by January 26.
 To conclude, the XRP price failed to break out above a long-term resistance line and has been decreasing since January 18. We believe it is likely to reach $0.21. The presence of reversal signs once it gets there will determine whether the price makes another attempt at breaking out or falls to new lows instead.
Top crypto platforms in the US
Disclaimer
In line with the Trust Project guidelines, this price analysis article is for informational purposes only and should not be considered financial or investment advice. BeInCrypto is committed to accurate, unbiased reporting, but market conditions are subject to change without notice. Always conduct your own research and consult with a professional before making any financial decisions. Please note that our Terms and Conditions, Privacy Policy, and Disclaimers have been updated.

Valdrin Tahiri
Valdrin discovered cryptocurrencies while he was getting his MSc in Financial Markets from the Barcelona School of Economics. Shortly after graduating, he began writing for several different cryptocurrency related websites as a freelancer before eventually taking on the role of BeInCrypto's Senior Analyst.
(I do not have a discord and will not contact you first there. Beware of scammers)
READ FULL BIO
Sponsored
Sponsored