
Tron (TRX) has broken out from a long-term resistance area that had previously been in place for more than two years. It is currently consolidating in anticipation of another upward movement.
In addition, on May 8, a Tron pool was added to PancakeSwap, which allows users to stake CAKE in order to gain more TRX.
Long-term levels
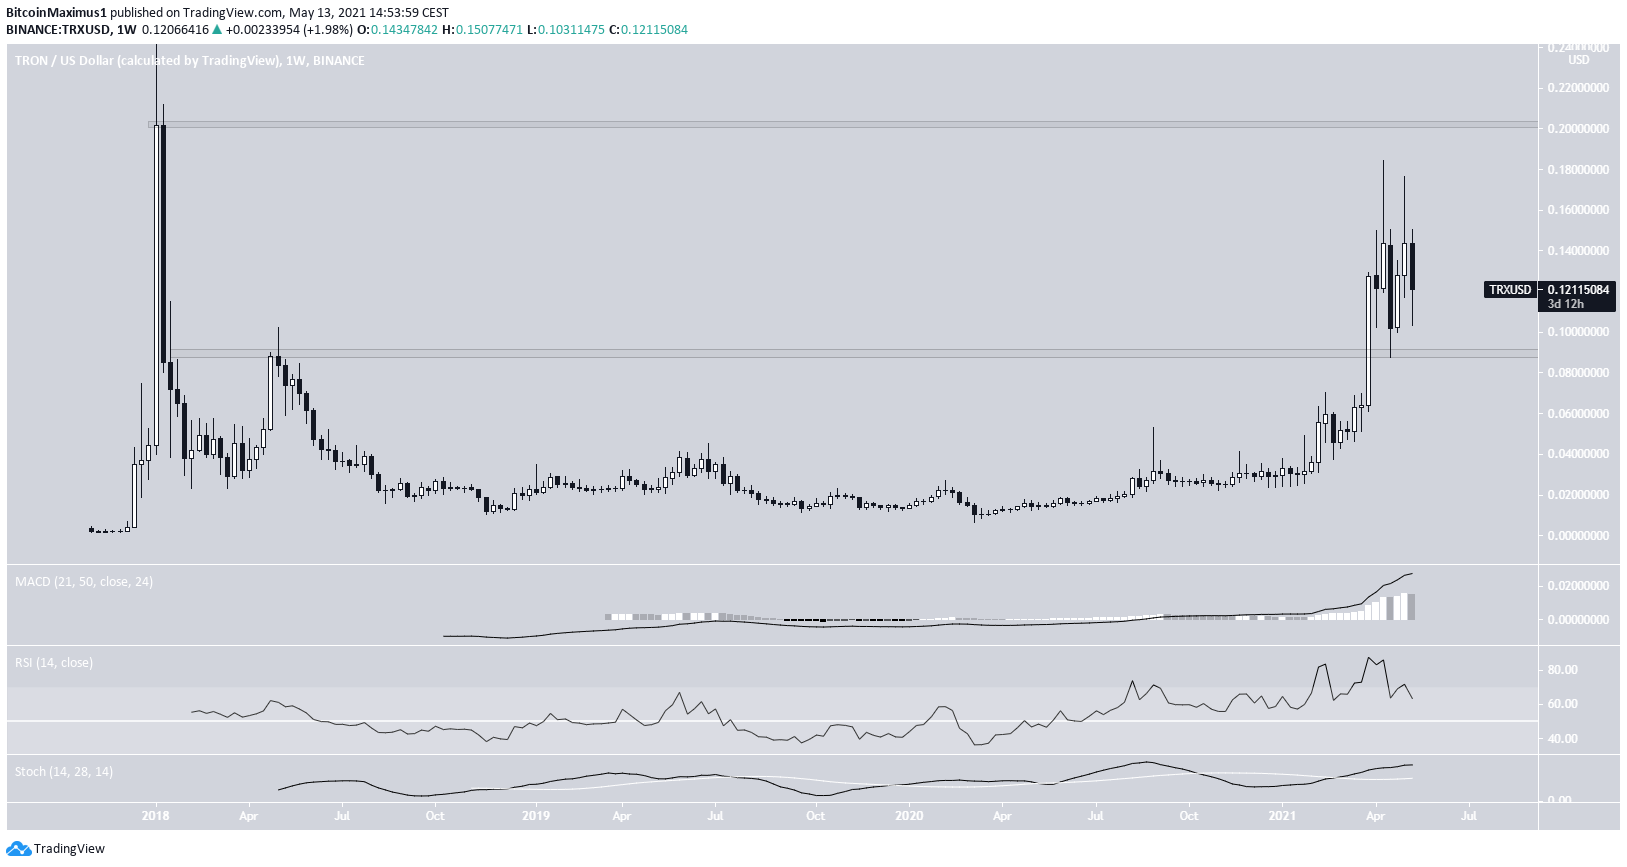
In the beginning of April, TRX broke out from the long-term $0.09 area, which had been acting as resistance since the beginning of 2018. It returned to validate it as support on April 23, and has been moving upward since.
The token continued to increase until it reached a high of $0.182, before being rejected. Technical indicators in the weekly time frame are still bullish, despite the RSI cross below 70.
The next resistance area is found at $0.205. It is created by the closing price of the 2017 all-time high.
TRX wave count
Cryptocurrency trader @Altstreetbet outlined a TRX chart, stating that a bullish impulse is beginning that will take the price towards a new all-time high.
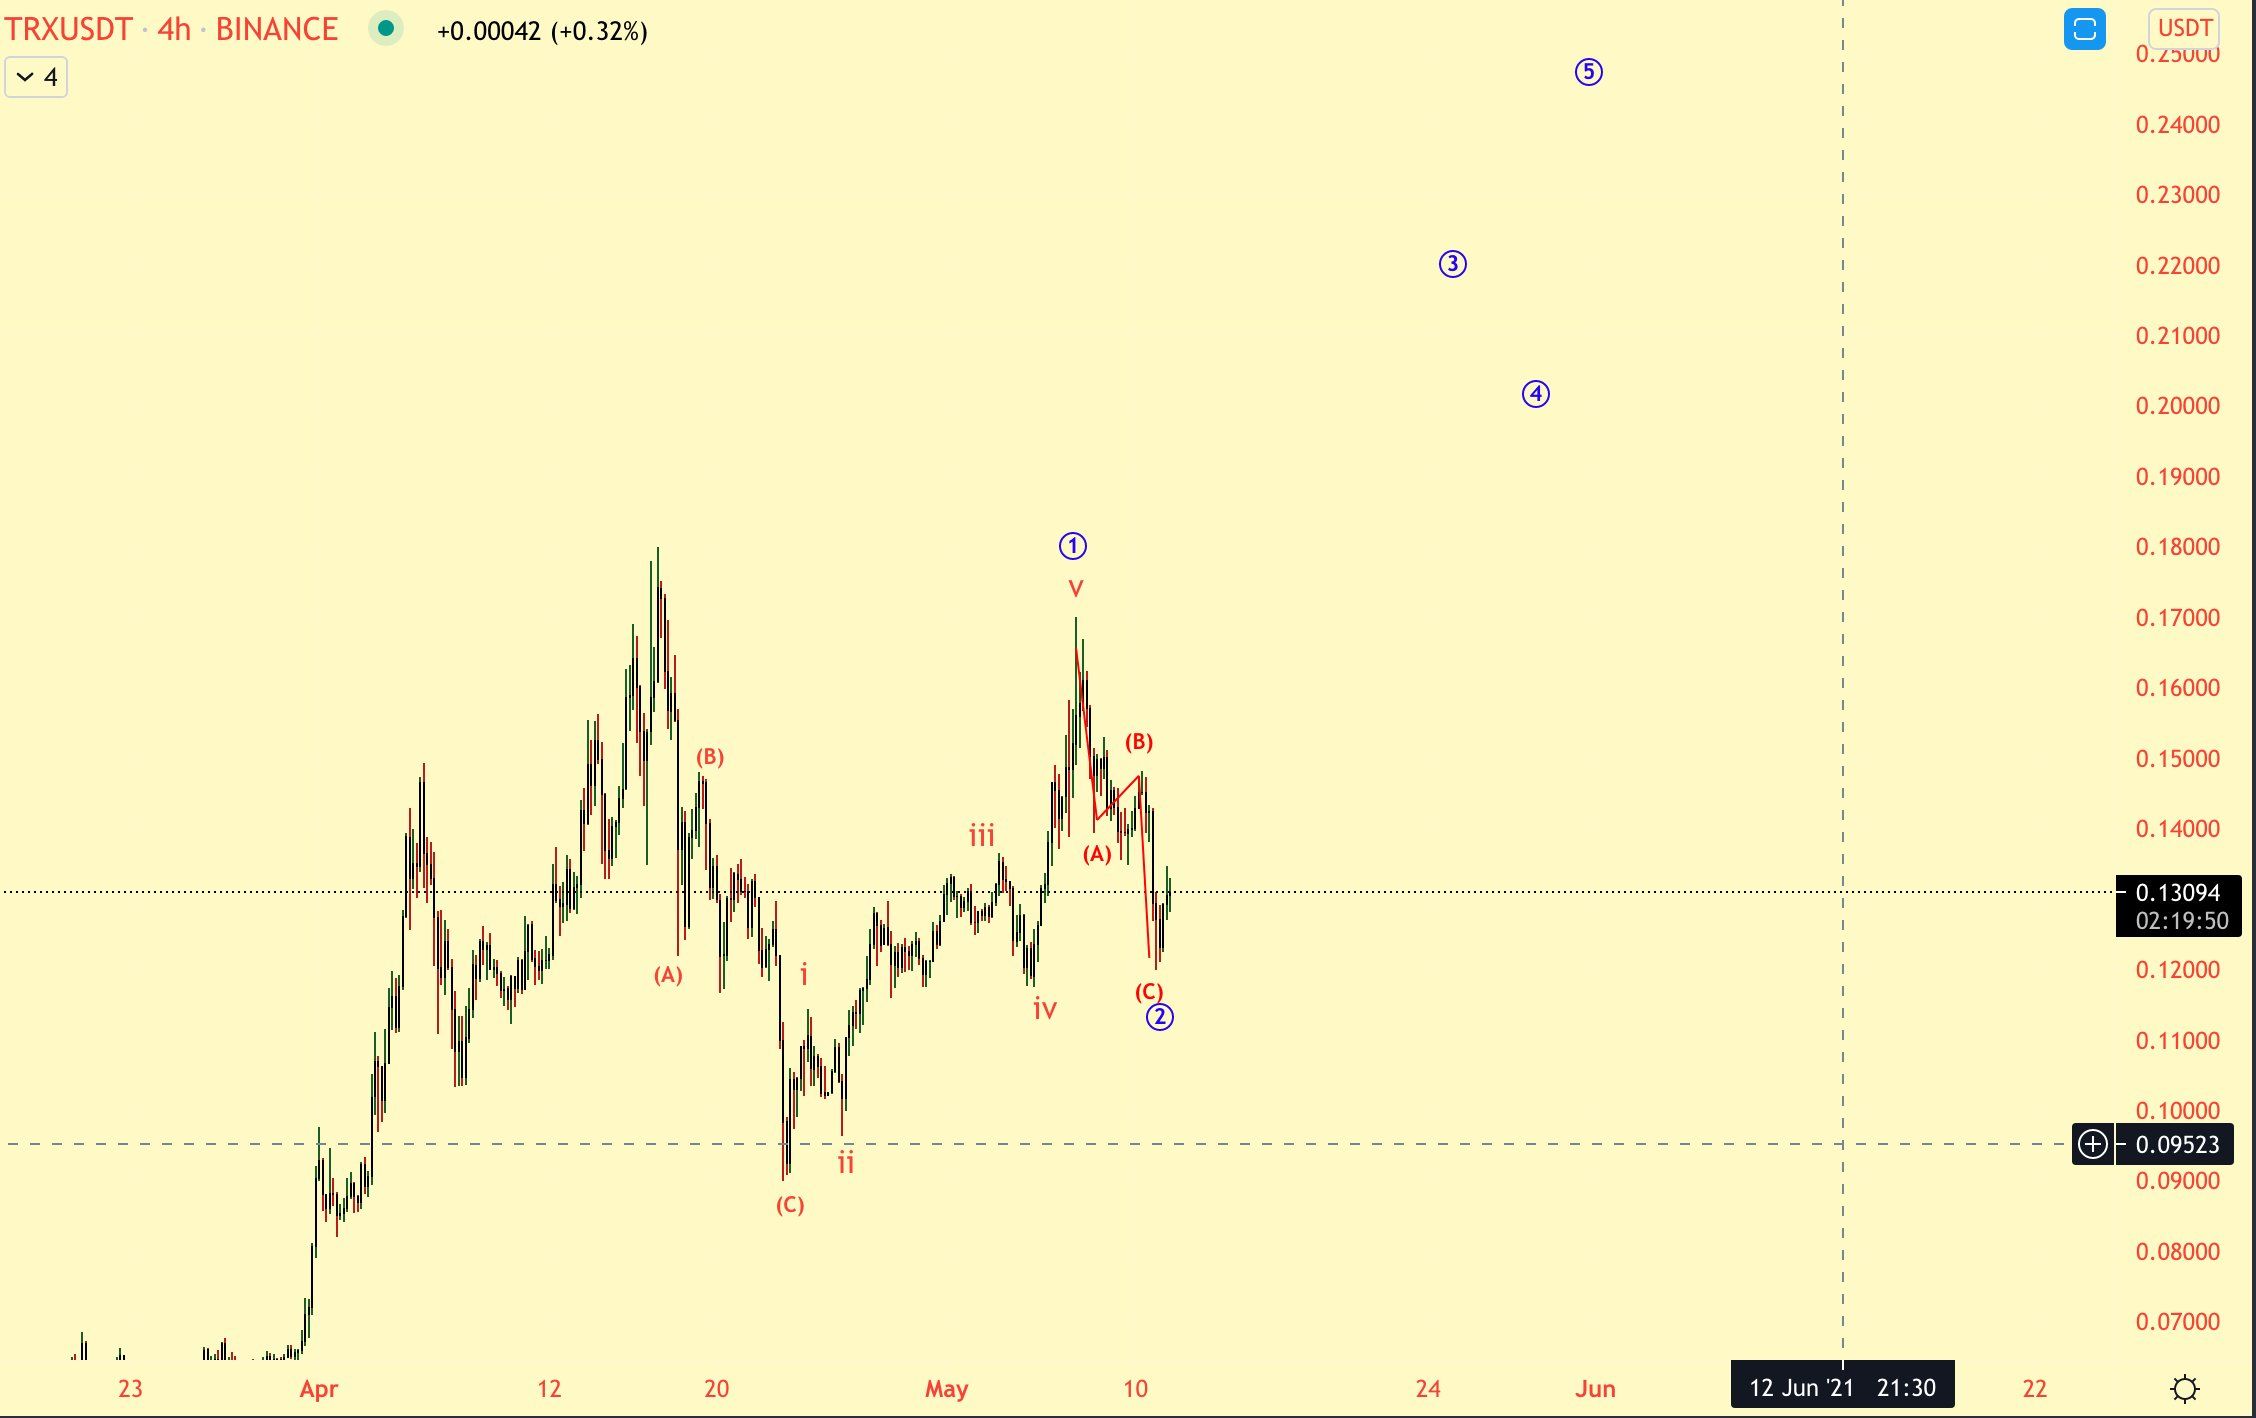
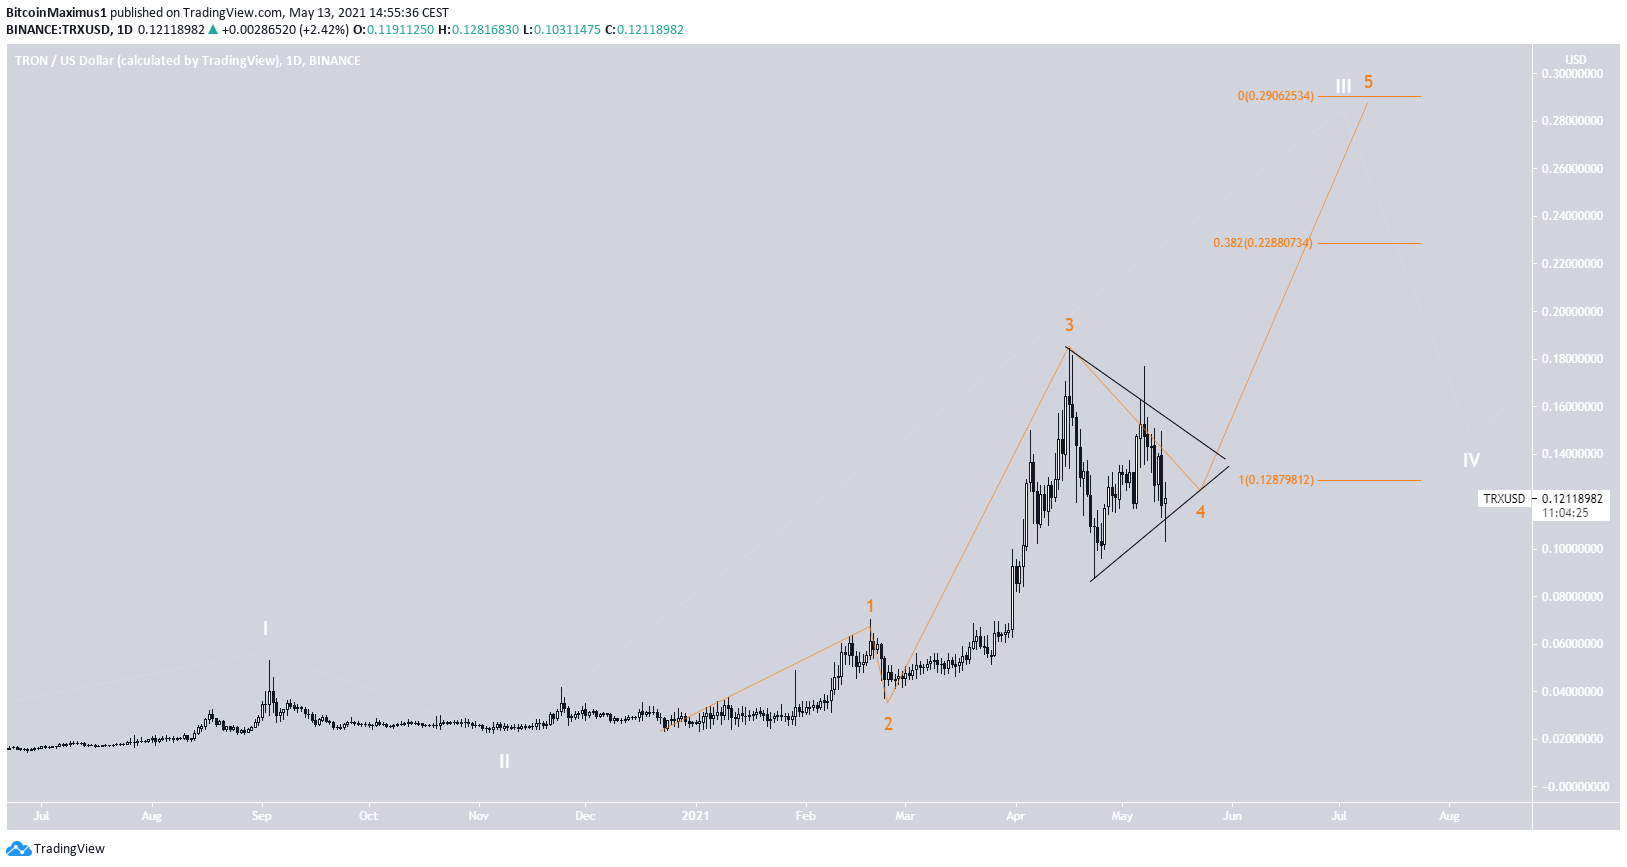
The wave count indicates that the price is likely just beginning the fifth and final sub-wave of a long-term wave three (white).
However, it seems to still be in sub-wave four (orange), which has developed into a triangle.
The two most likely levels for the top are found at $0.228 and $0.29, respectively.
TRX/BTC
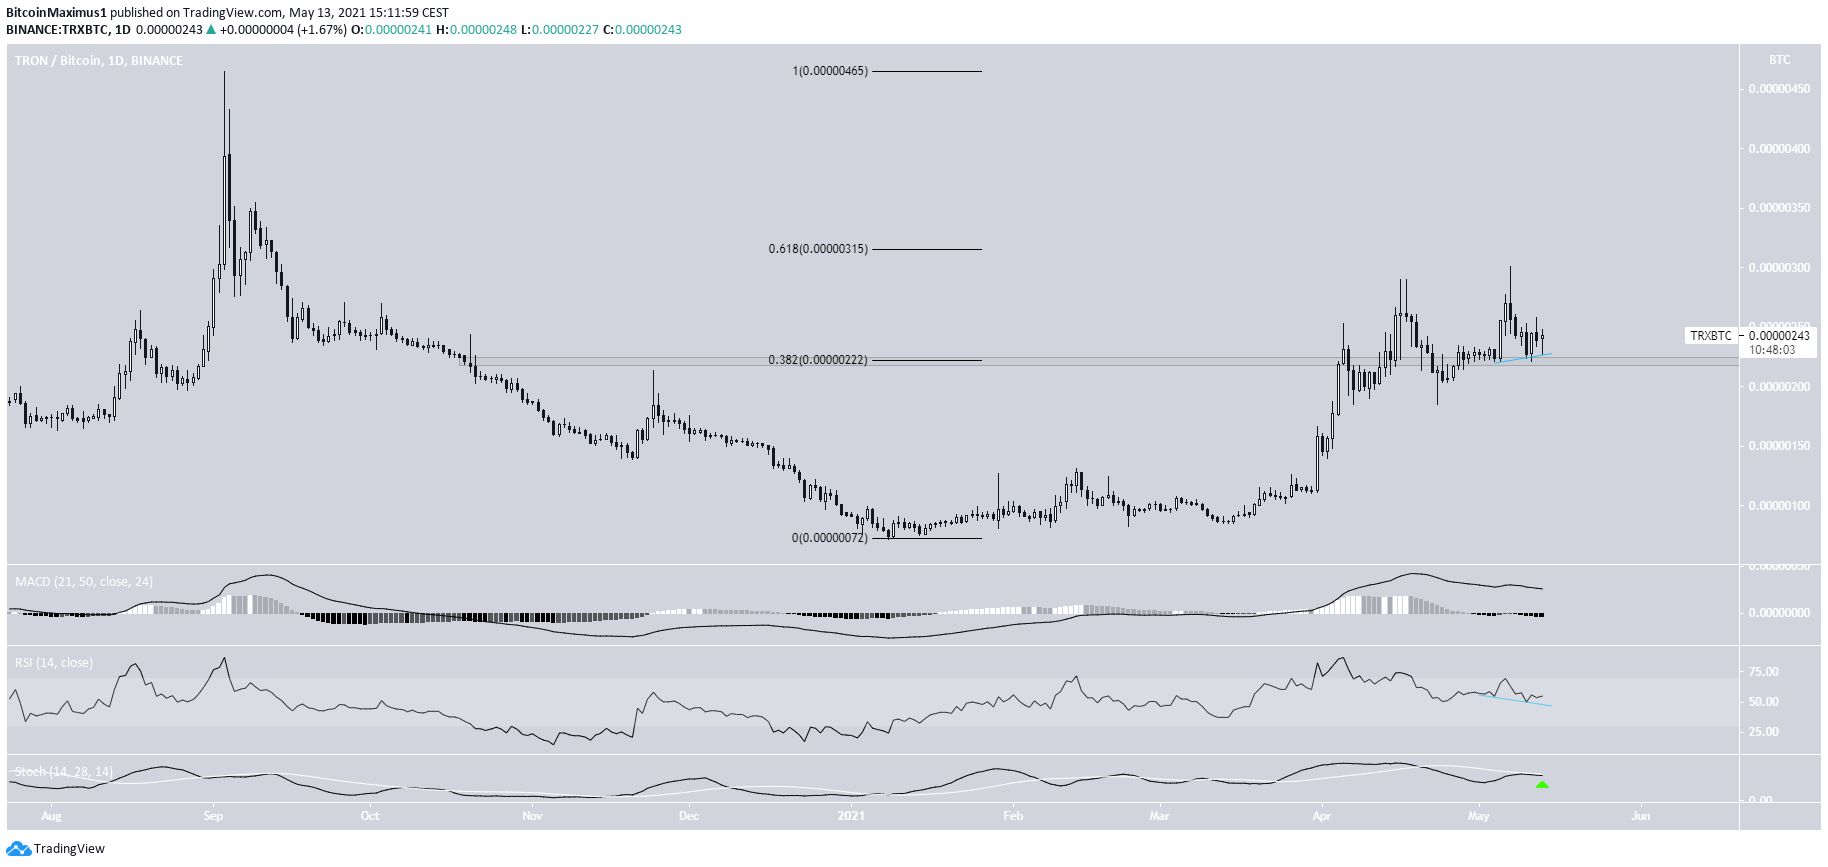
At the beginning of April, TRX/BTC moved above the 222 satoshi area and validated it as support afterwards.
The next closest resistance area is found at 315 satoshis, created by the 0.618 fib retracement level of the most recent downward movement.
Technical indicators are bullish, supporting the possibility that the token reaches it and breaks out. This is especially evident by the hidden bullish divergence in the RSI. In addition, there is a potential bullish cross in the Stochastic Oscillator (green arrow). If so, the next resistance area would be found at 465 satoshis.
To conclude, TRX/USD is expected to break out from the current pattern and increase towards a new all-time high price.
TRX/BTC is expected to reach the 315 satoshi resistance area and eventually break out.
For BeInCrypto’s latest bitcoin (BTC) analysis, click here.
