


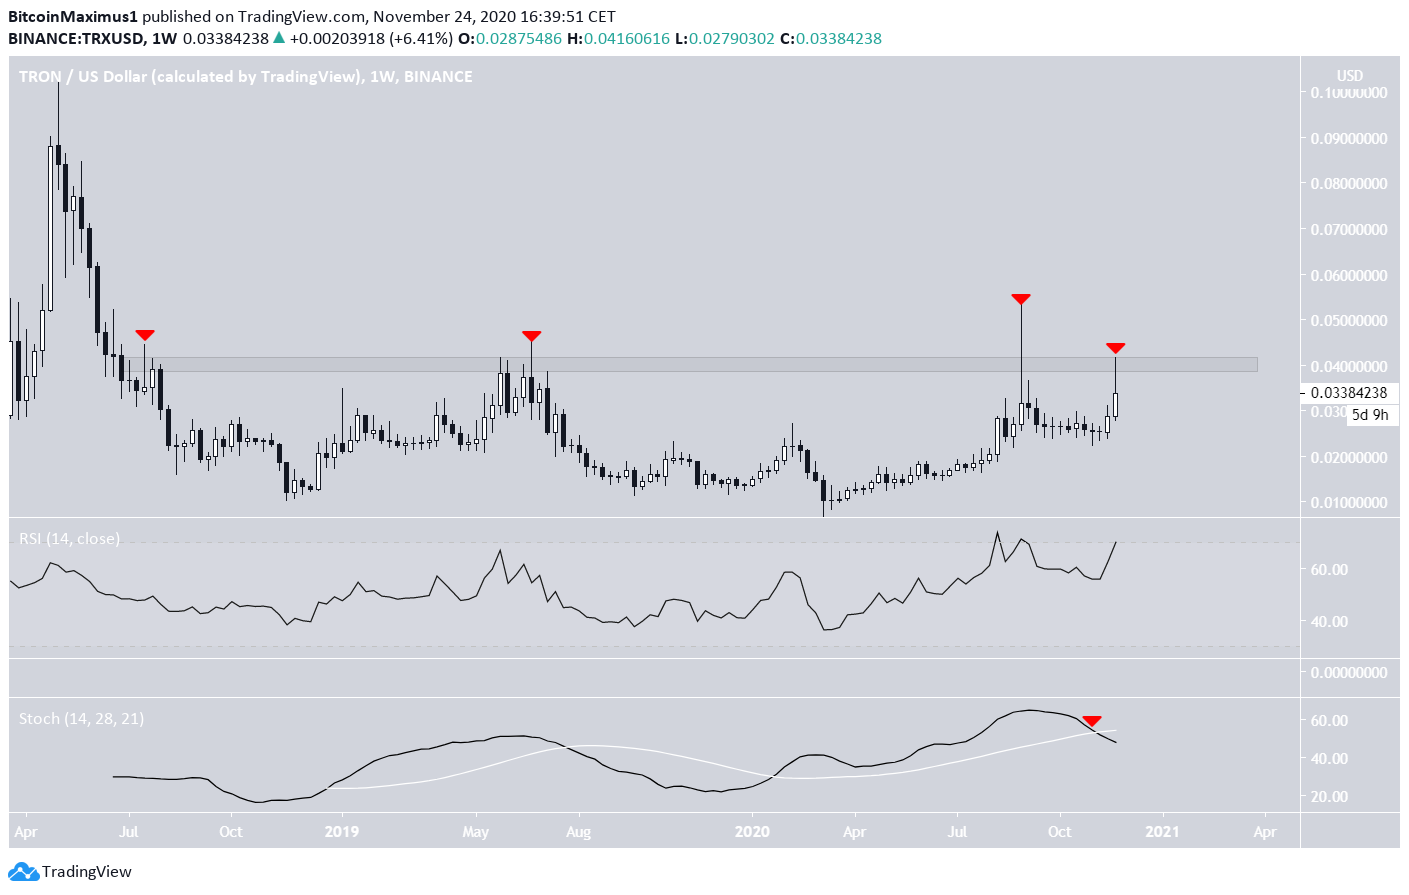
The TRON (TRX) price was recently rejected by the $0.04 resistance area for the fourth time since July 2018.
TRX is expected to eventually be successful in breaking out from this area and begin moving towards higher resistance levels.
TRX Long-Term Resistance
The TRX price has been trading below the $0.04 resistance area since July 2018. While the price has moved above this level three times since, it has failed to reach a weekly close above it, creating long upper wicks each time.
TRX again reached the $0.04 level yesterday but was rejected and is currently in the process of creating a long upper wick.
The Stochastic oscillator has made a bearish cross, suggesting that a downward move is in store. The RSI has not confirmed its bearish divergence but is overbought.
If the price were to break out, there is almost no resistance until $0.09.
Will TRX Break Free?
A look at the daily time-frame shows that the $0.04 resistance area is also the 0.618 Fib retracement level of the entire previous downward move, further strengthening its significance.
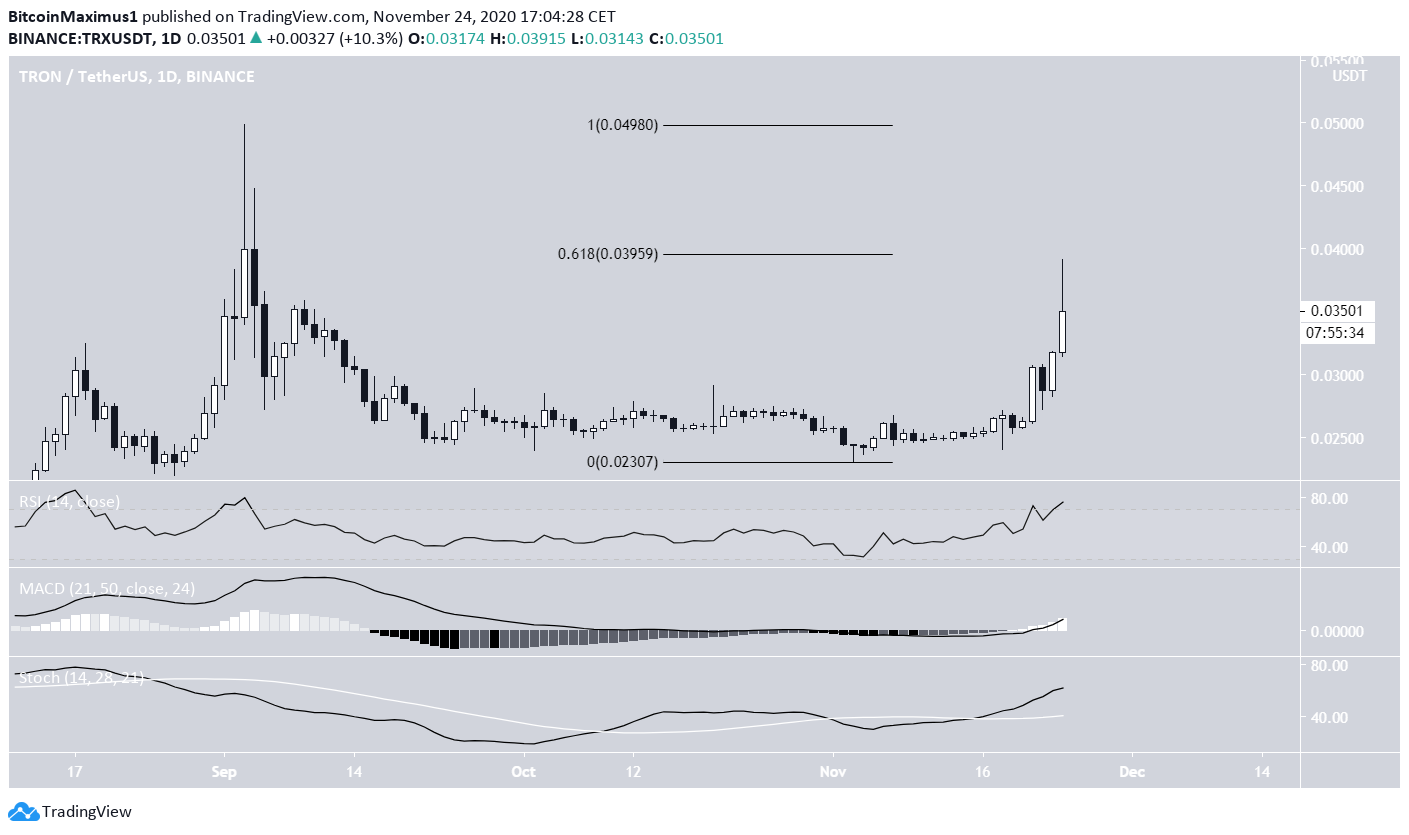
Despite the rejection, technical indicators are bullish and support a continued increase, which could lead to a breakout from the $0.04 level.
Cryptocurrency trader @mesawine1 outlined a TRX chart, stating that the price is likely to increase, suggesting a movement similar to that of THETA, which created a cup-and-handle pattern.
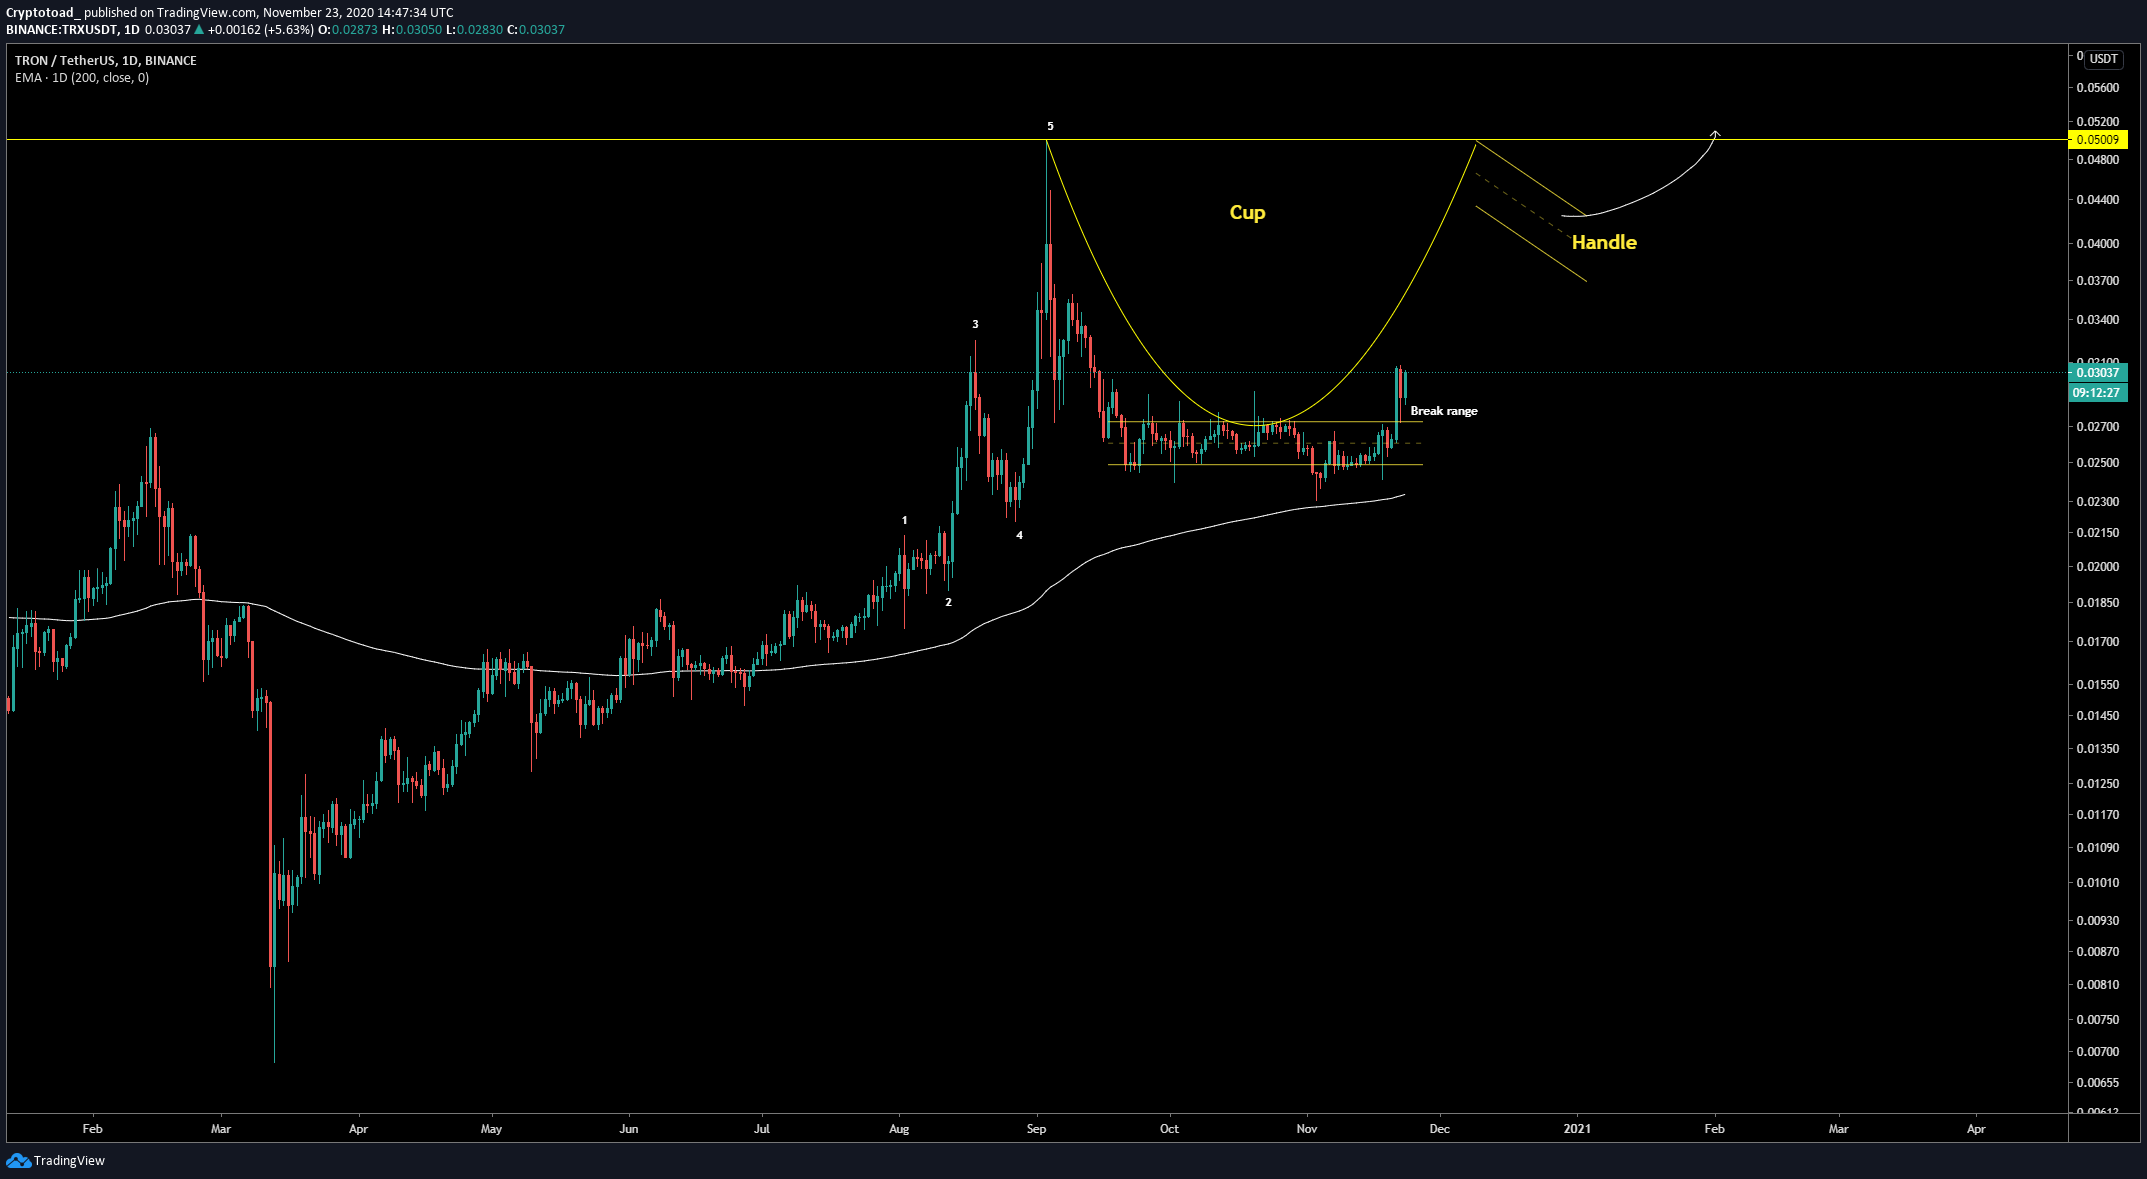
The readings from technical indicators in the daily time-frame make this likely.
However, the resistance line for the pattern would be expected to fall at $0.040 instead of the wick highs at $0.050, since the area has acted as resistance over the past two years.
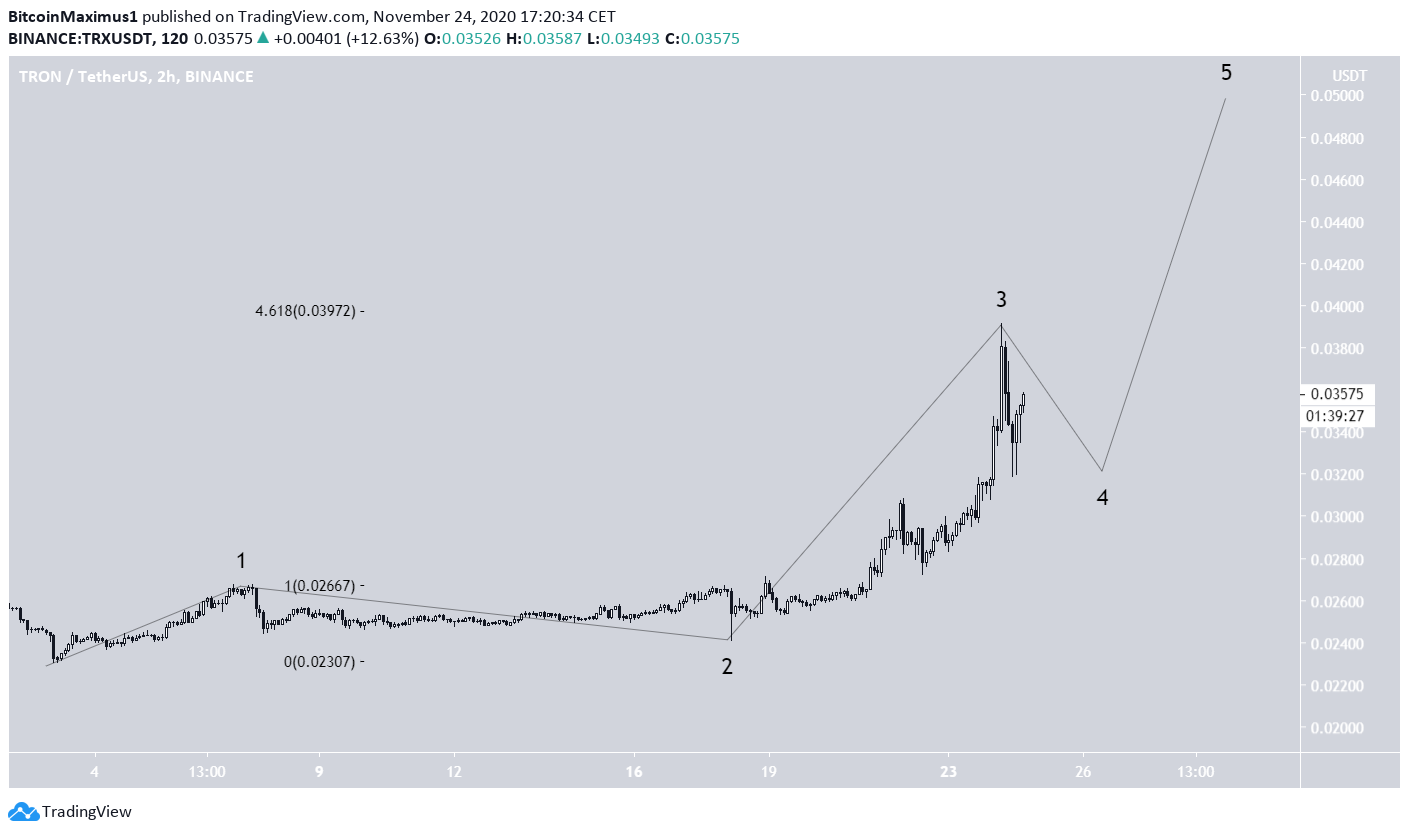
Wave Count
The wave count for TRX suggests that the price began a bullish impulse after the Sept. 3 low and has currently completed wave 3 (shown in black below).
While it is not yet certain whether wave 4 has already been completed, TRX is expected to increase and break out after doing so.
Conclusion
The TRX price is expected to break out from the $0.04 resistance area and move towards $0.05.
For BeInCrypto’s latest Bitcoin analysis, click here!
Disclaimer: Cryptocurrency trading carries a high level of risk and may not be suitable for all investors. The views expressed in this article do not reflect those of BeInCrypto


