

Binance Coin (BNB) is garnering praise from significant voices in the crypto industry. On Mar 5, the CEO of TRON (TRX) called it the new Bitcoin.
Prices have subsequently skyrocketed, but will the rise continue?
Key Highlights For Mar 7, 2019
- The price of BNB was $9.53 on Mar 5.
- It launched a rapid upward move which took it to a high of $15.86 on Mar 7.
- Since Mar 5, the price has increased by 40%.
- The price is possibly trading inside an ascending wedge.
- There is short-term bearish divergence developing in the RSI and the MACD.
Ascending Support Line
The price of Binance Coin (BNB) on Binance is analyzed on 30-minute intervals from Mar 5 to Mar 7. The price of BNB was $9.53 on Mar 5. It has made higher lows since. The ascending support line is created by tracing these successive lows.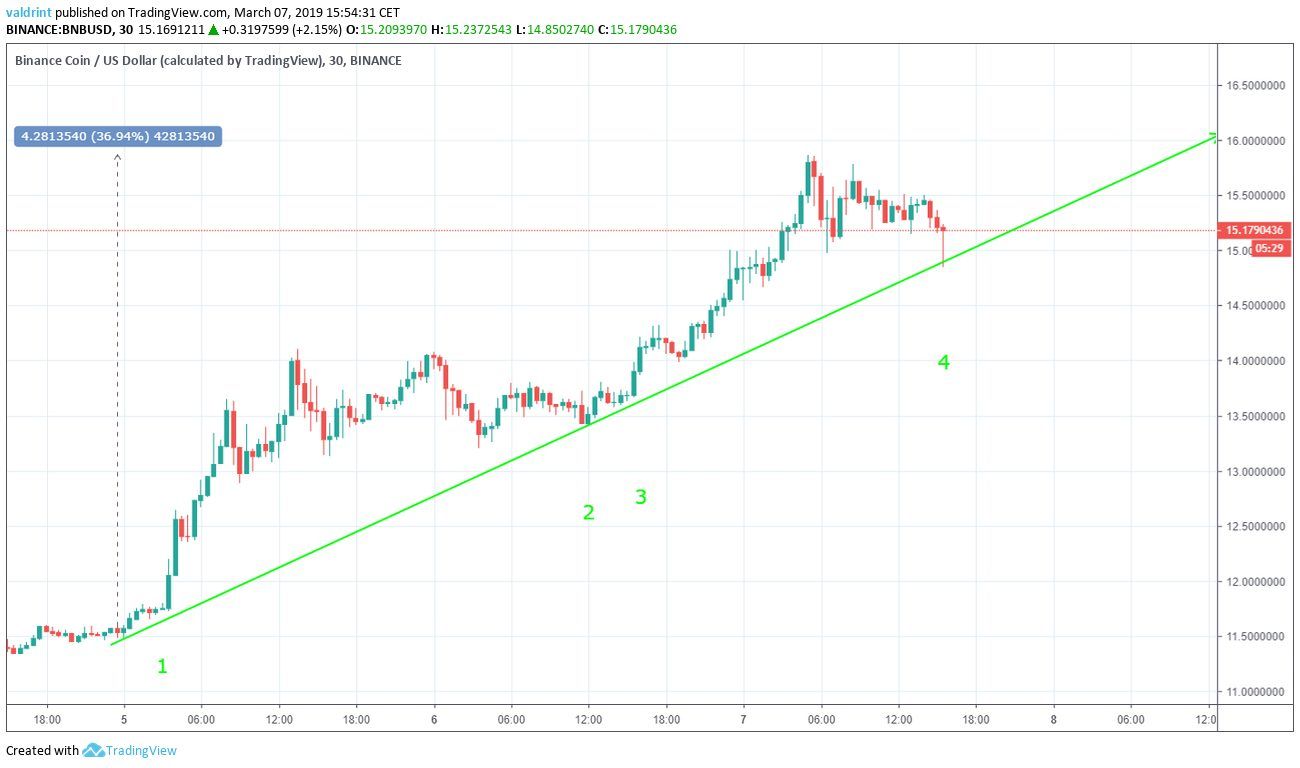 The dates in which the line was touched are:
- Mar 5
- Mar 6 (twice)
- Mar 7
Possible Ascending Wedge
The price reached a swing high of $12.16 on Mar 5. It made a higher high of $15.78 on Mar 7. Connecting these successive highs gives us the ascending resistance line. The resistance and support lines create a possible ascending wedge.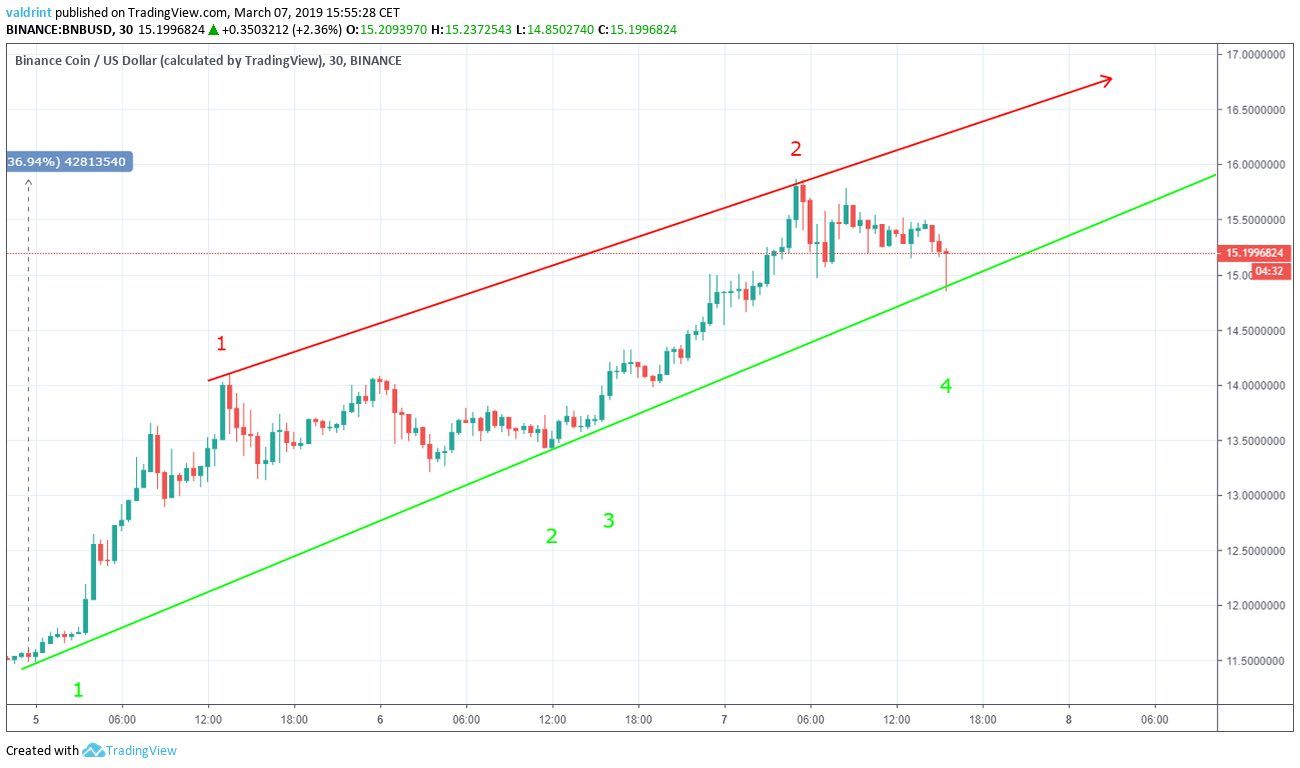 The dates in which the line was touched are:
- Mar 5
- Mar 7
Looking Out For Divergence
The moving average convergence divergence (MACD) is a trend indicator that shows the relationship between two moving averages (long and short-term) and the price. It is used to measure the strength of a move. The relative strength index (RSI) is an indicator which calculates the size of the changes in price in order to determine oversold or overbought conditions in the market. Combining MACD and RSI bullish/bearish divergence with support/resistance essentially predicts price fluctuations. The price reached a high of $12.16 on Mar 5. It reached a higher high of $15.78 on Mar 7.
The MACD and RSI both reached a swing high on Mar 5. However, they both made a lower high on Mar 7.
The divergence is not very significant in either category but is more pronounced in the MACD.
The prediction arising from divergence can be especially effective when there is a bearish divergence on a bearish pattern and vice versa. If both indicators are in agreement, they can be used to further add validity to the divergence analysis.
This is the case in BNB, since the ascending wedge is a bearish pattern, making a breakdown more likely.
The price reached a high of $12.16 on Mar 5. It reached a higher high of $15.78 on Mar 7.
The MACD and RSI both reached a swing high on Mar 5. However, they both made a lower high on Mar 7.
The divergence is not very significant in either category but is more pronounced in the MACD.
The prediction arising from divergence can be especially effective when there is a bearish divergence on a bearish pattern and vice versa. If both indicators are in agreement, they can be used to further add validity to the divergence analysis.
This is the case in BNB, since the ascending wedge is a bearish pattern, making a breakdown more likely.
Possible Reversal Areas
The price of BNB on Binance is analyzed on one-day intervals from June 2018 to Mar 2019. Resistance and support areas are formed when the price reaches a certain level several times. They can act as a ceiling/floor that prevents the price from moving further in that direction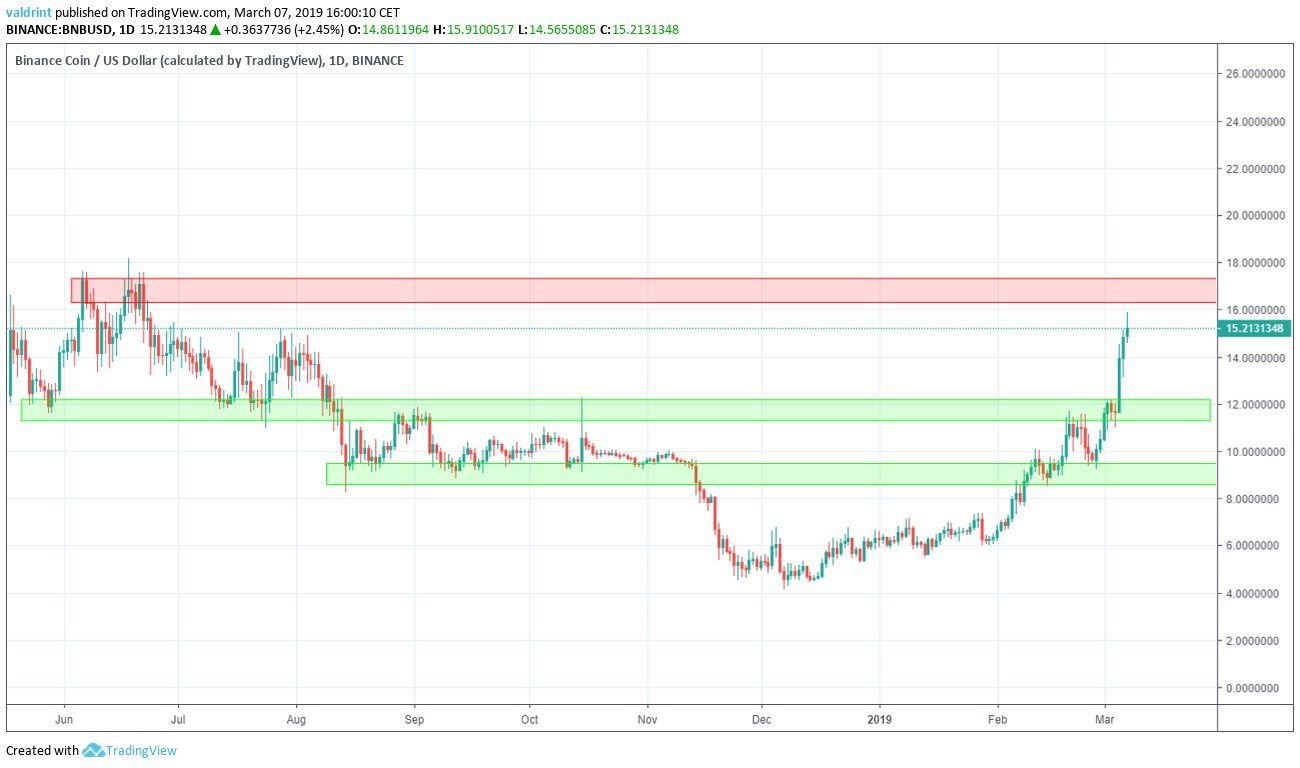 The closest resistance area is found near $17. It is formed by the highs of June 2018.
The closest support area is found near $12.
Another support area is found near $9. If price were to start a rapid downward movement, these two areas would be likely to provide a reversal.
Based on this analysis, the price is likely to move inside the ascending wedge in the short-term, possibly making another high. If the price makes a higher high, such a prediction could be partially validated. If it reaches $17 the prediction would be fully validated.
Subsequent corrections resulting in perhaps rapid and significant price drops may follow beyond the short-term.
When do you think the price of BNB will finally come to a halt? Let us know in the comments below!
The closest resistance area is found near $17. It is formed by the highs of June 2018.
The closest support area is found near $12.
Another support area is found near $9. If price were to start a rapid downward movement, these two areas would be likely to provide a reversal.
Based on this analysis, the price is likely to move inside the ascending wedge in the short-term, possibly making another high. If the price makes a higher high, such a prediction could be partially validated. If it reaches $17 the prediction would be fully validated.
Subsequent corrections resulting in perhaps rapid and significant price drops may follow beyond the short-term.
When do you think the price of BNB will finally come to a halt? Let us know in the comments below!
And Check Out Our Latest Ethereum Analysis!
Disclaimer: This article is not trading advice and should not be construed as such. Always consult a trained financial professional before investing in cryptocurrencies, as the market is particularly volatile.
Top crypto projects in the US | April 2024
Trusted
Disclaimer
In line with the Trust Project guidelines, this price analysis article is for informational purposes only and should not be considered financial or investment advice. BeInCrypto is committed to accurate, unbiased reporting, but market conditions are subject to change without notice. Always conduct your own research and consult with a professional before making any financial decisions. Please note that our Terms and Conditions, Privacy Policy, and Disclaimers have been updated.

Valdrin Tahiri
Valdrin discovered cryptocurrencies while he was getting his MSc in Financial Markets from the Barcelona School of Economics. Shortly after graduating, he began writing for several different cryptocurrency related websites as a freelancer before eventually taking on the role of BeInCrypto's Senior Analyst.
(I do not have a discord and will not contact you first there. Beware of scammers)
READ FULL BIO
Sponsored
Sponsored