


TRON(TRX) aims to become the standard protocol for the development of decentralized applications (dApps).
On March 4, 2019, it reached a partnership with the stablecoin Tether (USDT), which will bring it into the Tron foundation in 2019.
Do you think the positive news will finally lead TRON out of this downward trend?
Key Highlights For March 7
- The price made a high of $0.0246 on Mar 5.
- It has made lower highs since.
- It is trading inside a parallel channel.
- The MACD and SMAs triggered a sell signal.
- The closest resistance area is found near $0.0243.
- The closest support area is found near $0.0229.
Descending Resistance Line
The price of Tron on Binance was analyzed at 30-minute intervals from Mar 5 to Mar 7.
The price reached a high of $0.0246 on Mar 5. It has gradually dropped and has made lower highs since. The resistance line is created by tracing the lower highs.
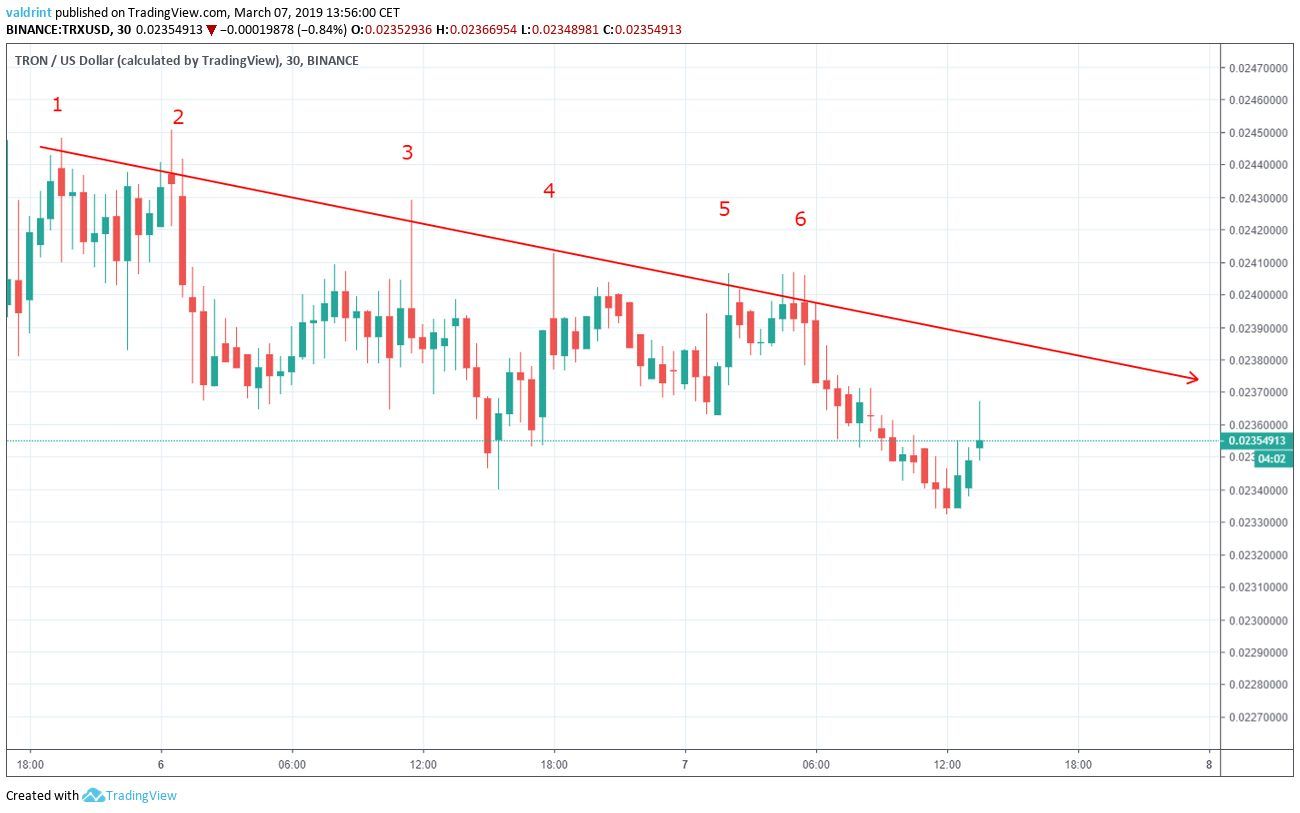
The dates in which it was touched are:
- Mar 5
- Mar 6 (three times)
- Mar 7(twice)
The resistance line can act as a ceiling to price, preventing further upward movement. However, a break above it can initiate a rapid rise in price.
The breakouts above the resistance line by a wick in a volatile market are relatively unimportant as long as they are not succeeded by continued breakouts. In the case of TRX, the 30-minute highs rarely broke out above the line and were not supported by maintained gains.
Parallel Channel
After the Mar 5 high, the price gradually dropped to $0.0236. Since then, it has made lower lows without significant fluctuations.
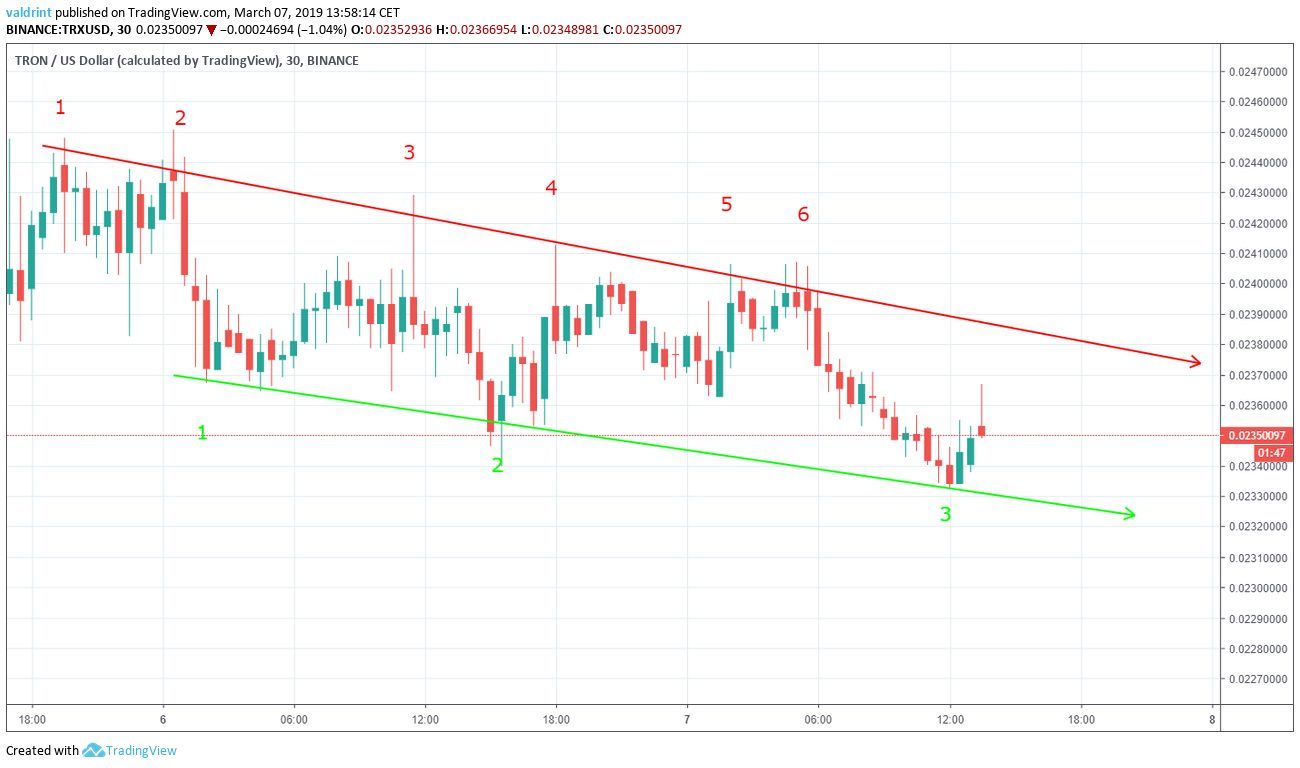
The support line is created by tracing these lows. The dates in which the line was touched are:
- Mar 6 (twice)
- Mar 7
Together, support and resistance lines create a parallel channel. If price moves outside this channel for an extended period of time, new resistance and support lines may develop.
The parallel channel aims to reduce the scope of price movements and contain them within a known range. The price has decreased at the rate predicted by channel. Future price drops may follow this trend unless Tether can perform a miracle.
A Signal Is Triggered
The moving average convergence divergence (MACD) is a trend indicator that shows the relationship between two moving averages (long and short-term) and the price. It is used to measure the strength of a move.
Combined with simple moving averages (SMA), MACD can be used as a trigger for buy and sell signals. Signals are triggered whenever the MACD line is above 0 and the price is above the 21 (red) and 50-period (green) SMAs
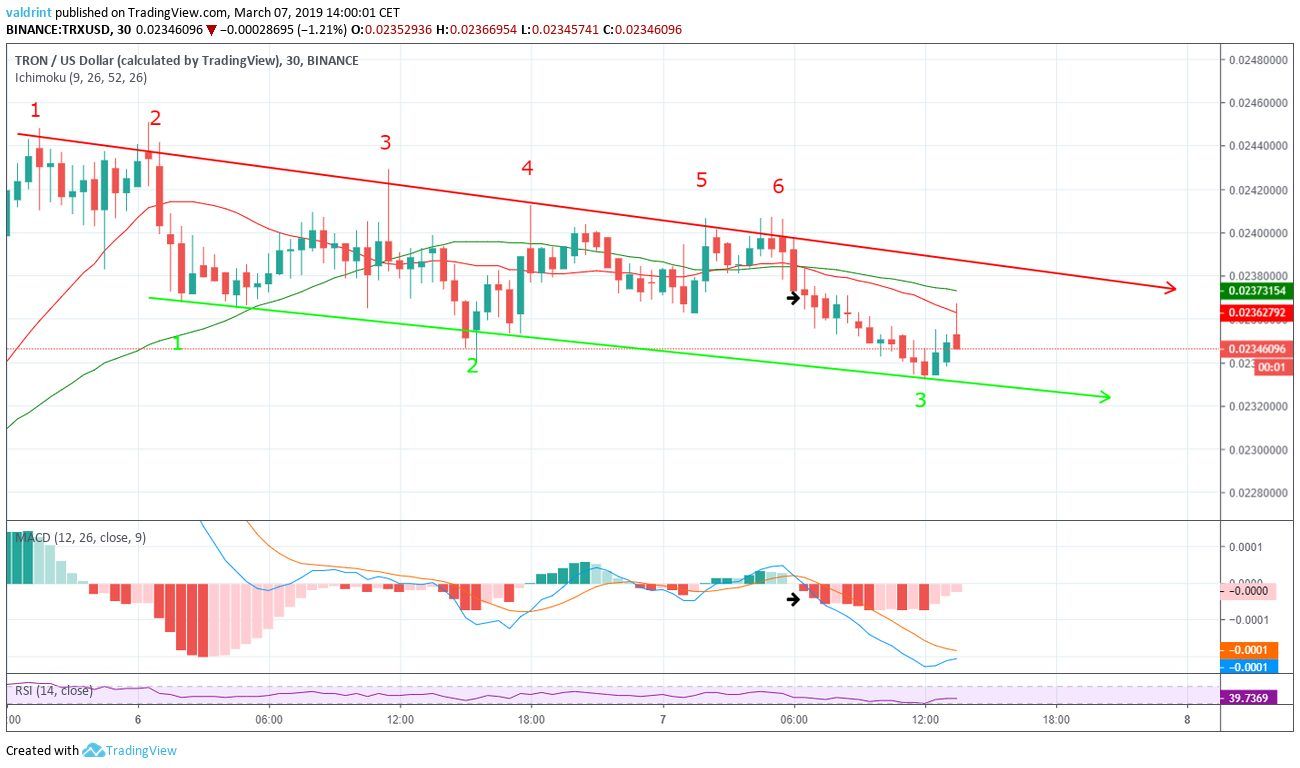
On Mar 7, the price touched the resistance line for the 6th time at $0.024. Afterward, it dropped at $0.0236 within two 30-minute candles. This movement took it below the 21 and 50-period SMAs.
Similarly, during the same interval, the MACD crossed below 0. This movement would trigger a sell signal, indicating that a downtrend may be starting, and lower prices are in store for future movements.
It would be invalidated by a break above the resistance line.
Support And Resistance
The price of TRX on Binance is analyzed at 30-minute intervals from Mar 2 to Mar 7
Resistance and support areas are formed when the price reaches a certain level several times. They can act as a ceiling/floor that prevents the price from moving further in that direction.
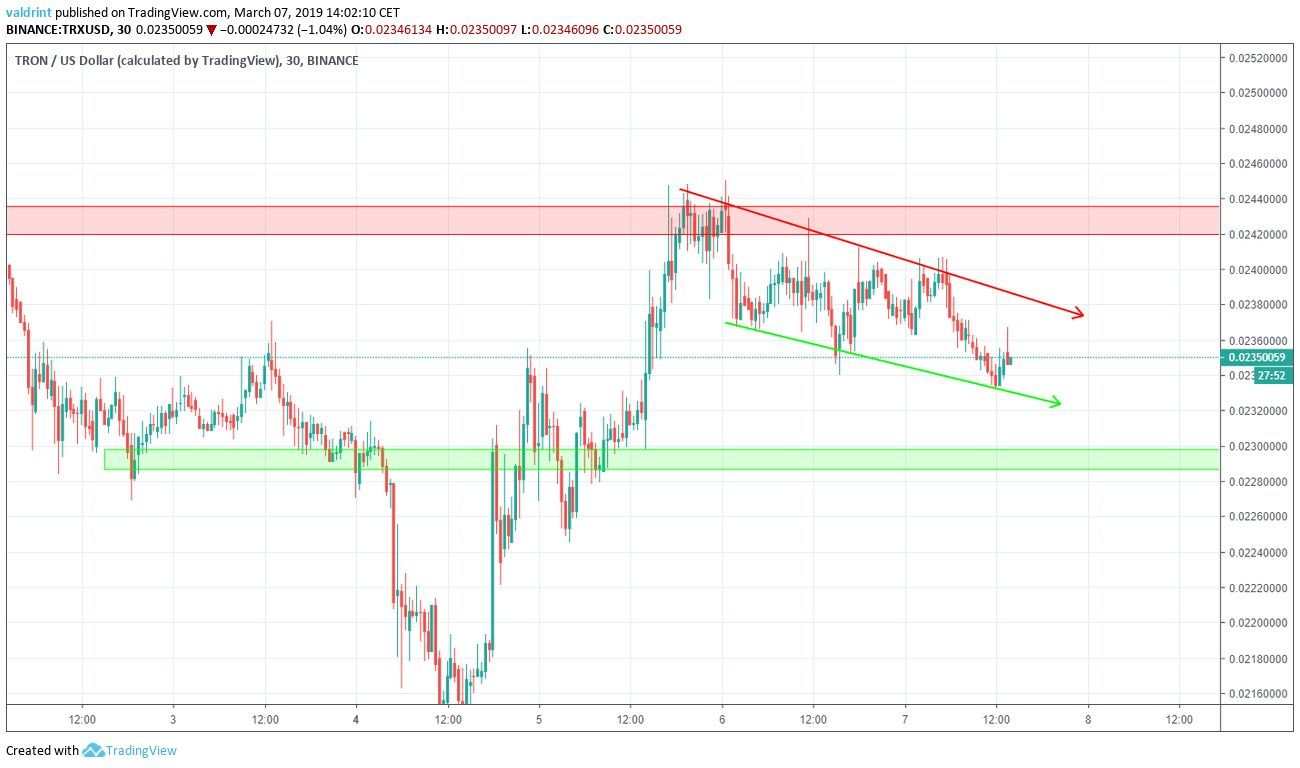
The closest resistance area is found near $0.0243. If price were to break out from the channel this would be a likely area for reversal
The closest support area is found near $0.0229. If price were to break down from the channel this would be a likely area for reversal.
Based on this analysis, a breakdown below the support seems more likely than a breakout above the resistance. If the price stays close to the support line of the channel, such a prediction would be partly validated. If it breaks down and reaches the support area, the prediction would be fully validated.
Do you think Tether will help TRON break out of this downward trend or will the parallel channel continue? Let us know your thoughts in the comments below!
And Check Out More TRON Analysis!
Disclaimer: This article is not trading advice and should not be construed as such. Always consult a trained financial professional before investing in cryptocurrencies, as the market is particularly volatile.


