


The Optimism (OP) price has yet to break out from its main resistance area, but the wave count provides a bullish outlook, indicating a breakout will follow soon.
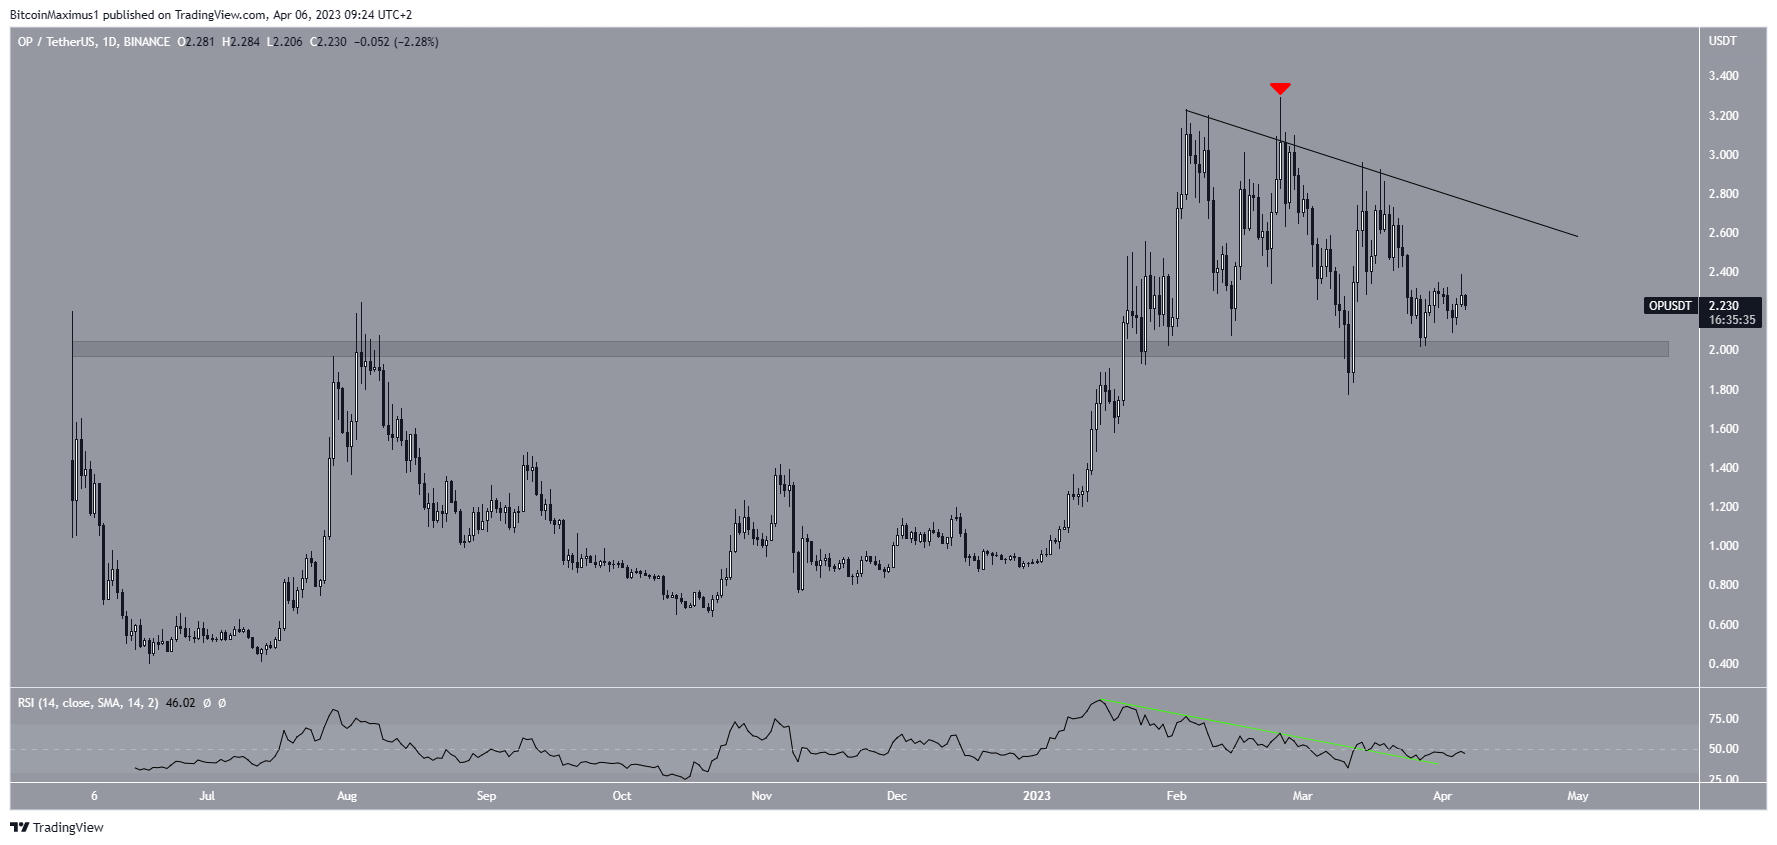
The OP price has fallen under a descending resistance line since Feb. 3. The line caused numerous rejections, most notably the long upper wick of Feb. 24, which contains the all-time high price of $3.29.
However, the Optimism price also trades above the $2 horizontal support area, a crucial level previously acting as resistance. Hence, the price action is ambiguous.
The daily RSI provides a similar outlook. While the breakout from the bearish divergence trendline (green) is bullish, the fact that the indicator is still below 50 is bearish.
As a result, the price action and indicator readings from the daily time frame are inconclusive in providing a clear direction for the future price trend.
Here’s Why Optimism (OP) Price Prediction for April Is Bullish
The wave count provides a bullish outlook, suggesting a new all-time high price will be reached in April. The OP price has completed a fourth wave pullback by bouncing at the previous channel’s resistance line. So, it is likely in wave five (white).
Both the external Fib retracement of wave four (black) and the length of waves one and three (white) give a similar target at an average price of $4.11-$4.35. As a result, the price will likely reach a top at this level.
On the other hand, a decrease below the wave one high (red line) of $1.42 would invalidate this bullish forecast. This would also cause a breakdown from the ascending parallel channel. Hence, the wave count and price action would both turn bearish simultaneously.
In that case, the OP token price could drop to the closest horizontal support area at $1.
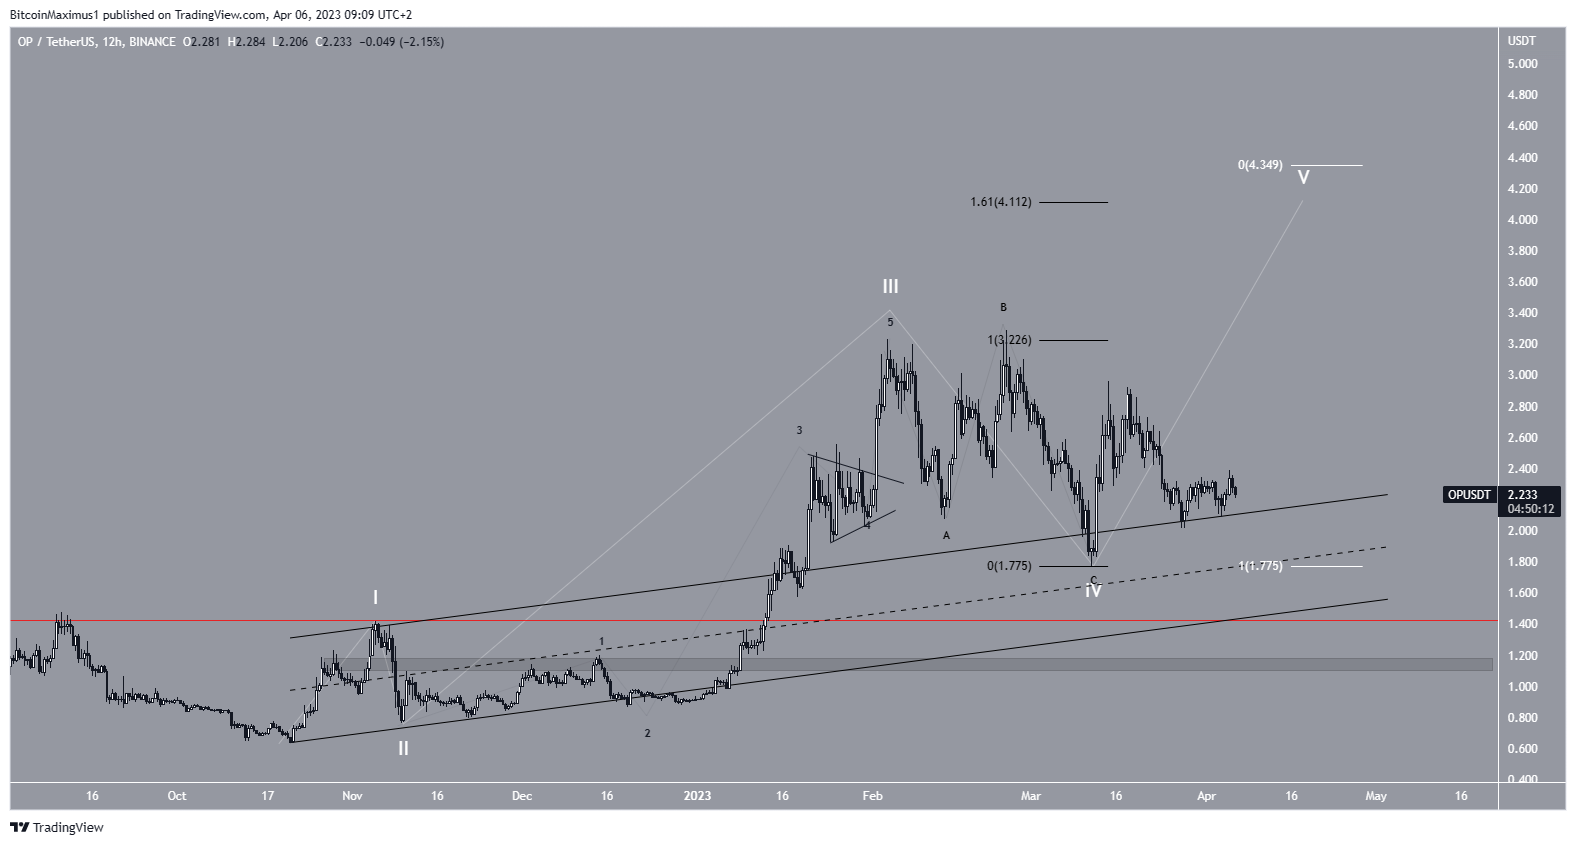
To conclude, the most likely OP price forecast suggests that a new all-time high will be reached in April at $4.11-$4.35. This bullish outlook will be invalidated with a drop below $1.42, which could catalyze a fall toward $1.10.
For BeInCrypto’s latest crypto market analysis, click here.


