


The MATIC network has been one of the best performers in November, having more than doubled its value from the low of $0.0131 reached at the beginning of November.
This increase has been especially pronounced when looking at the Bitcoin (BTC) pairing since BTC has been gradually decreasing. The MATIC/BTC price is close to reaching an all-time high.
However, the the price has reached a resistance area. The steepness of the increase makes it likely that the price will decrease until it finds support and moves at a more gradual rate.
Full-time trader @MacnBTC stated that the MATIC price is very close to reaching a top, after possibly making its final leg upward.
https://twitter.com/MacnBTC/status/1201324007364141056
He posted an outline of future movement, in which we continue this decrease, make another wave up which fails to break above the previous high and then initiate a rapid decrease towards 240 satoshis.
Let’s take a closer look at the price movement and see if this outline is likely.
MATIC Pattern Breakout
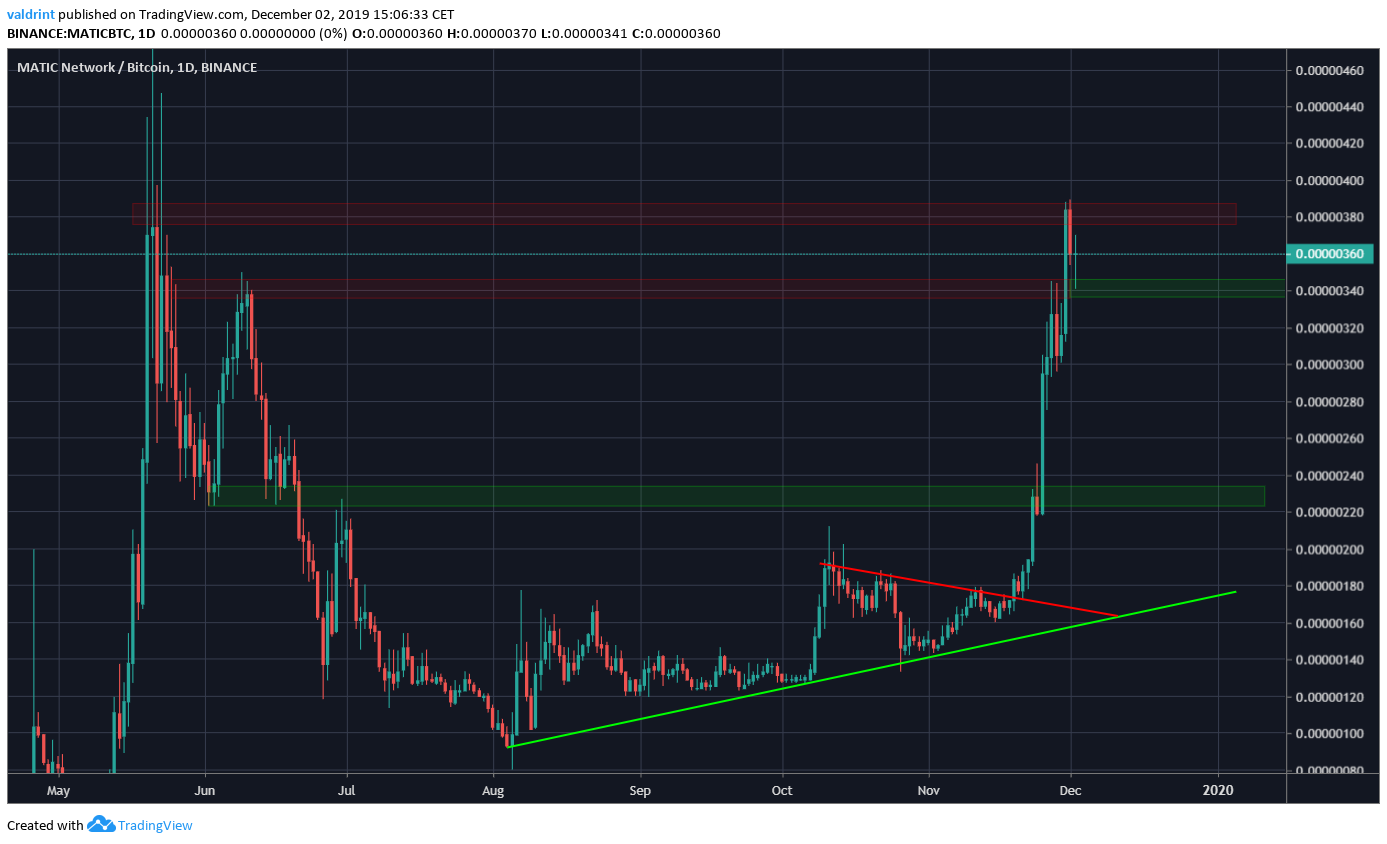
The MATIC price has been following an ascending support line since August 4. In late November it broke out above the current resistance and intensified its rate of increase.
It moved quickly above two resistance areas, at 230 and 345 satoshis respectively and has reached the third area at 385 satoshis before retracing slightly.
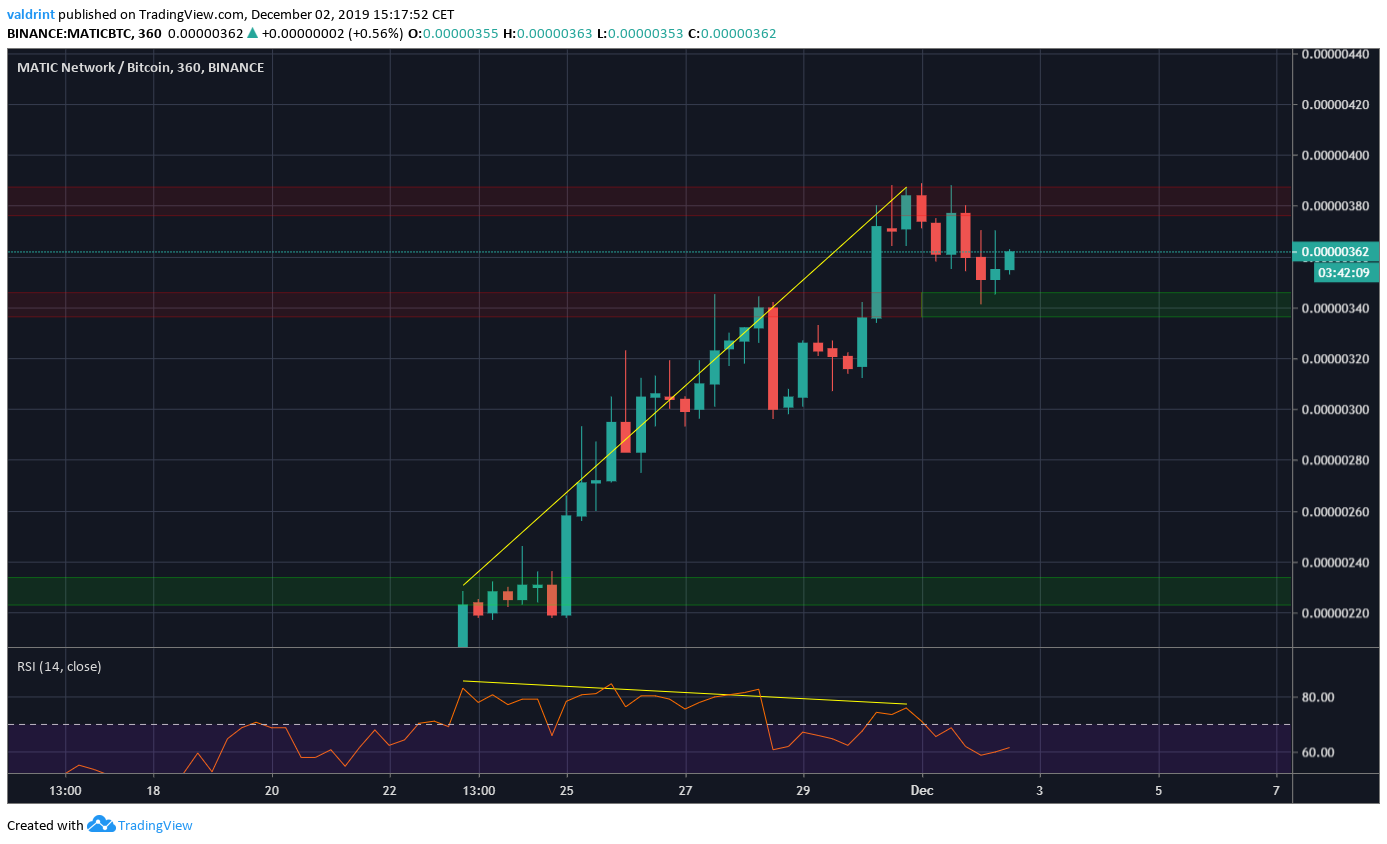
The RSI has begun to generate bearish divergence in medium-term time-frames. But, the price is not following any clear trading patterns and the increase is very steep, possibly unsustainable.
If the price falls below the support area at 340 satoshis and validates it as resistance, we could see a rapid downward move.
Future Movement
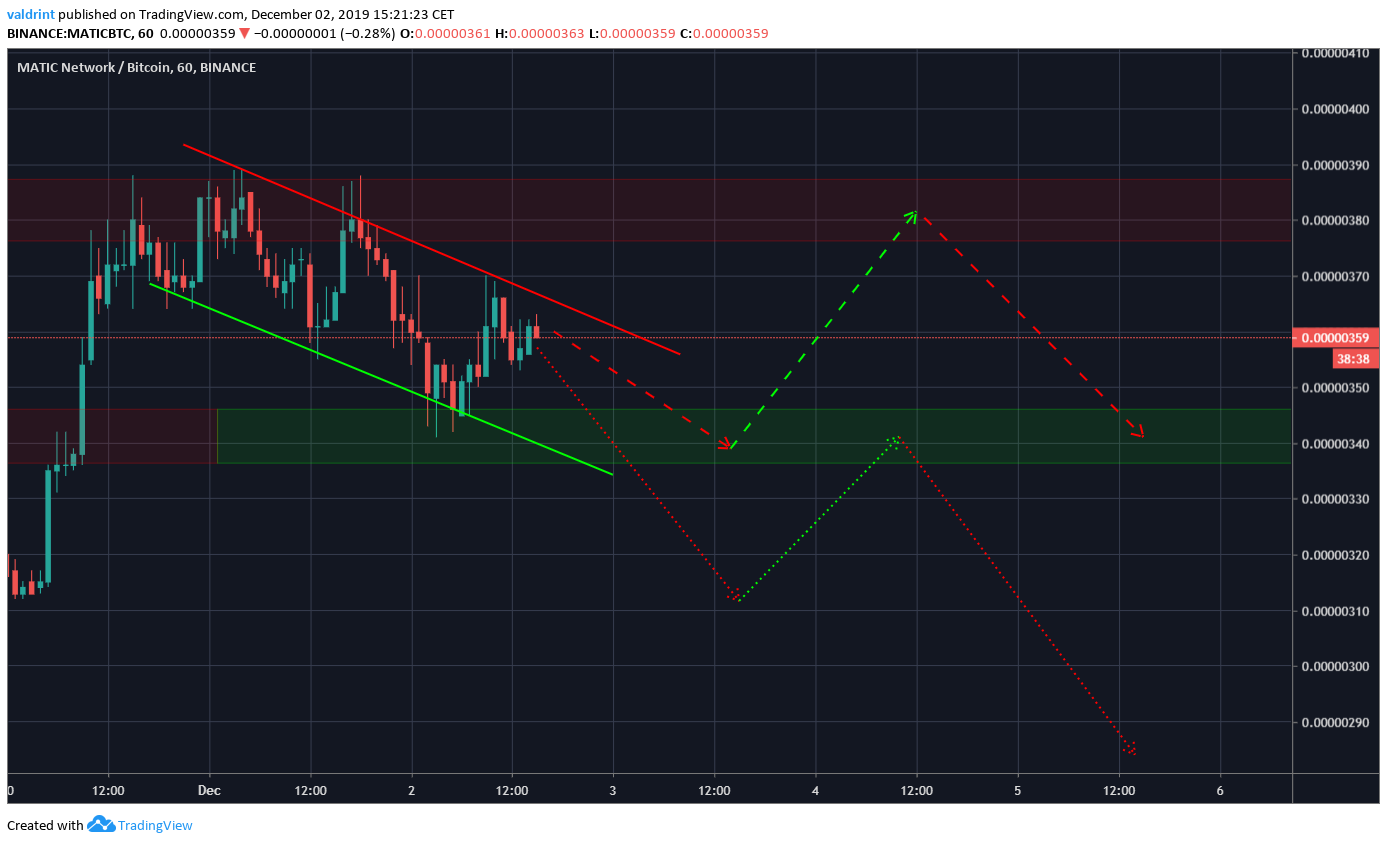
In the short-term, MATIC is trading inside a descending channel. There are two possibilities for future movement:
- The price falls to the 340 support area, finds support above it and continues moving upward towards 385 satoshis (dashed line).
- The price decreases below the support area, before validating it as resistance and continuing its downward movement (dotted line).
To conclude, the MATIC price is likely very close to reaching a top. The price action in regards to the 340 support area will indicate whether the price will immediately continue downward or it will consolidate for a while more before moving downward.
Due to the extreme slope of the upward move and technical readings, a breakdown seems inevitable.
Disclaimer: This article is not trading advice and should not be construed as such. Always consult a trained financial professional before investing in cryptocurrencies, as the market is particularly volatile.


