


Curve DAO Token (CRV) is attempting to find support after a short-term retracement that began on July 21. The direction of the long-term trend is still unclear.
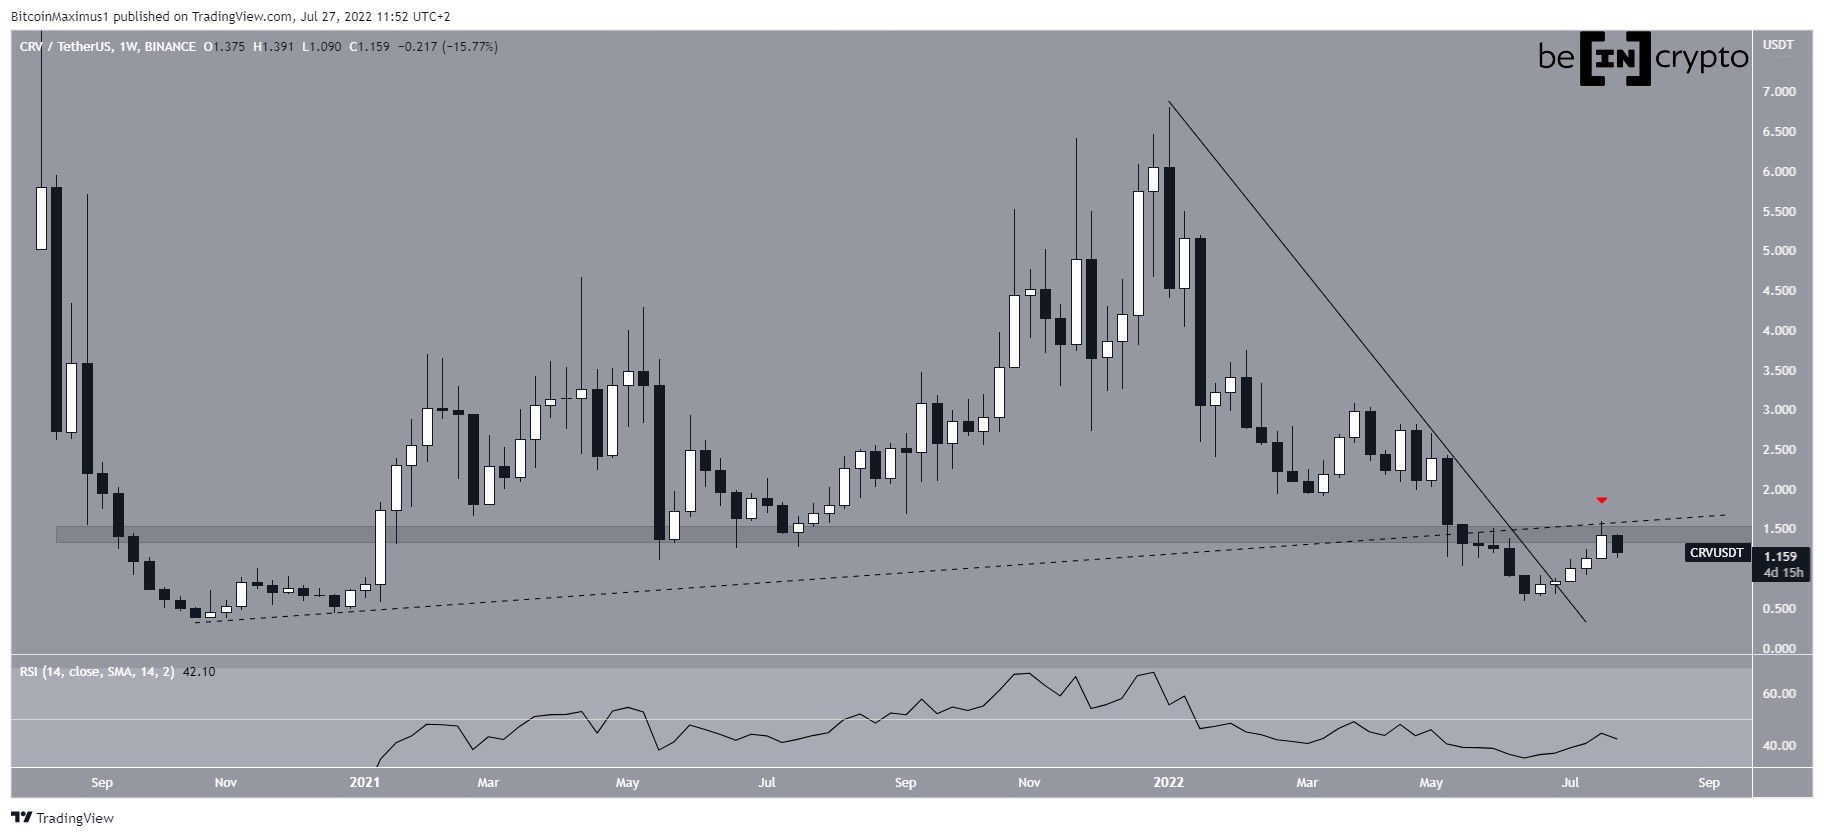
CRV has been falling underneath a descending resistance line since reaching an all-time high price of $6.80 in Jan. So far, the downward movement has led to a low of $0.53 in June.
However, the price has been moving upwards since and has managed to break out from the aforementioned descending resistance line.
Currently, it is facing crucial resistance at $1.40 (red icon), created by a horizontal support area and a long-term ascending support line from which it previously broke down (red icon).
A potential breakout above this level would be a decisive sign that a bullish reversal is in place.
Additionally, this would likely cause the weekly RSI to move above 50, in what would also be considered a sign of a bullish trend.
Ongoing increase
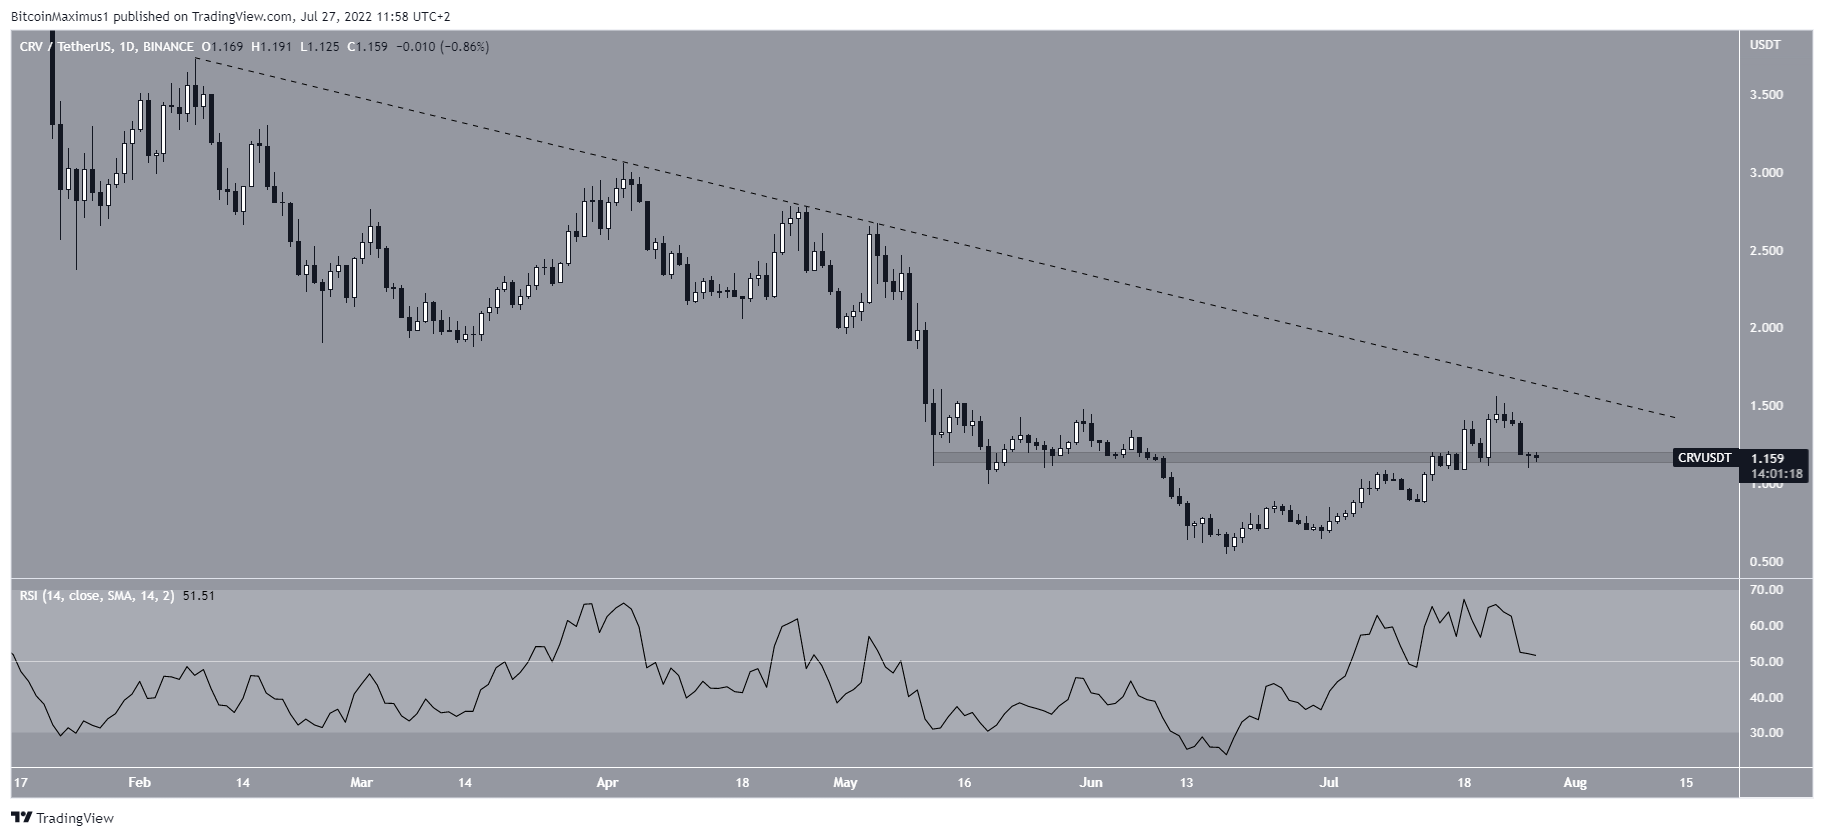
The daily chart shows that CRV has been increasing since June 18. During this upward movement, it managed to reclaim the $1.15 area and validate it as support afterward. Additionally, the daily RSI has moved above 50.
On the other hand, the price seems to be following a shorter-term descending resistance line, which has been in place since the beginning of Feb. The line coincides with the previously outlined confluence of resistance levels at $1.40.
In order for the trend to be considered bullish, the price has to break out above this level.
CRV wave count analysis
Cryptocurrency trader @Thetradinghubb tweeted a chart of CRV, stating that the price is completing an A-B-C corrective structure.
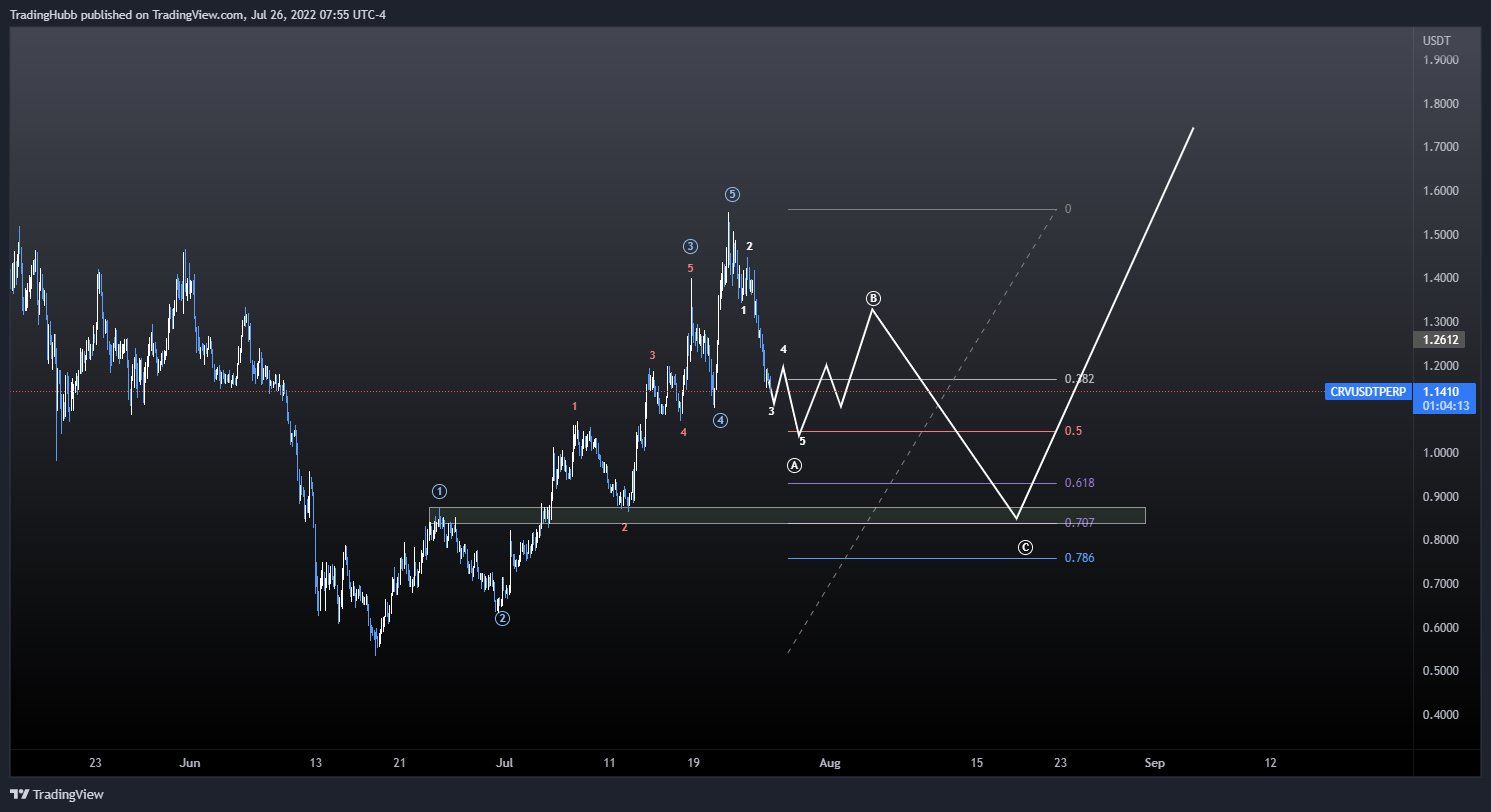
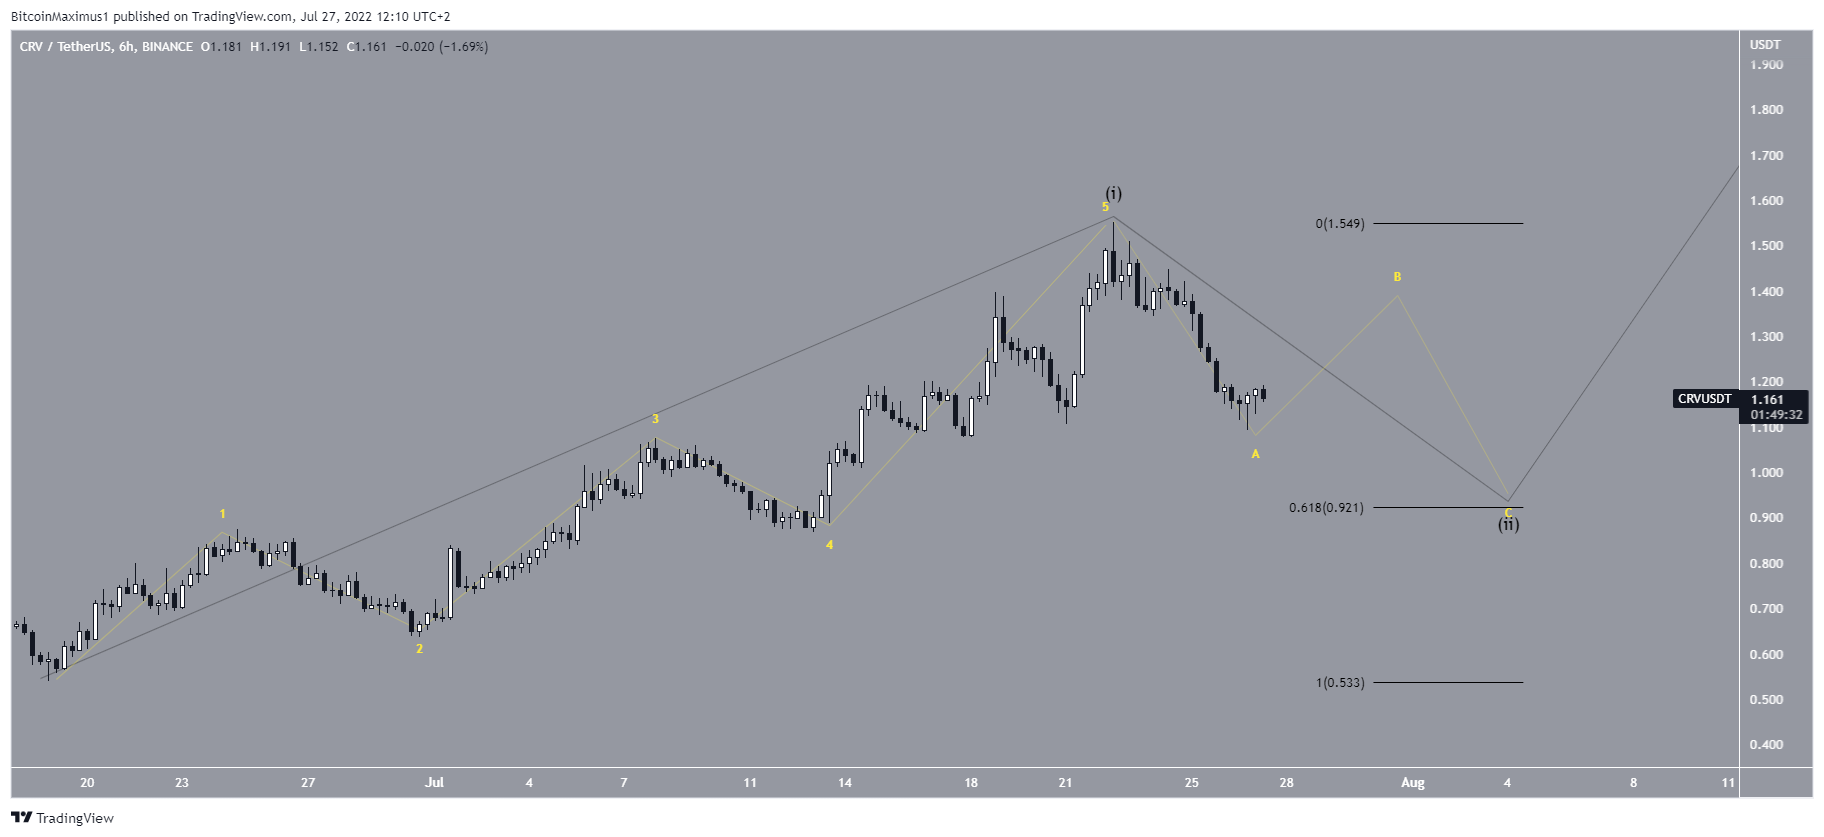
The most likely wave count suggests that CRV has completed wave one (black) of a longer-term five-wave upward movement, or potentially an upward A-B-C structure. The sub-wave count is given in yellow, and suggests that the price is in wave A of an A-B-C corrective structure.
If so, a short-term bounce is expected, before the price decrease once more towards the 0.618 Fib retracement support level.
Afterward, the upward movement could continue.
For Be[in]Crypto’s latest Bitcoin (BTC) analysis, click here


