


The Polkadot (DOT) price has broken down from a long-term resistance level but is trading inside a short-term bullish pattern.
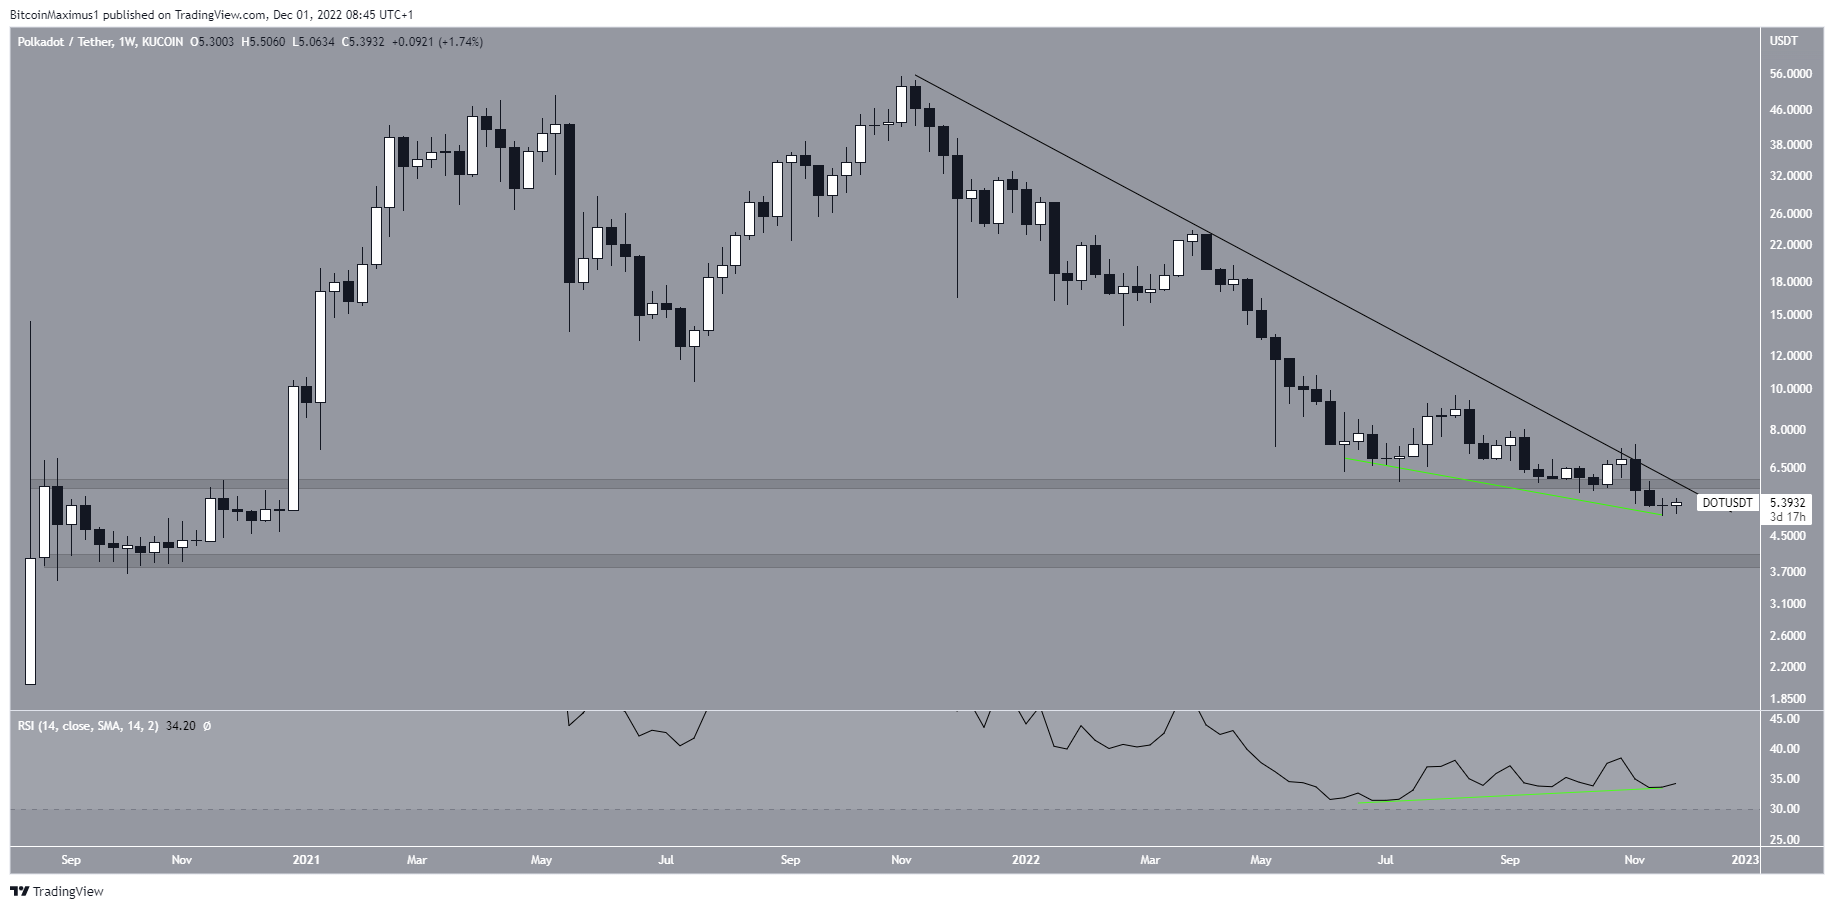
The Polkadot price has decreased underneath a descending resistance line since reaching an all-time high of $55.1 on Nov. 2021. The downward movement led to a minimum price of $5 in Nov. 2022. This caused a breakdown from the long-term support area at $6.
It is worth mentioning that the weekly RSI fell to an all-time low in July 2022 and has now generated bullish divergence (green line). If the divergence catalyzes an upward movement and breaks out from the $6 area, that would be considered an extremely bullish sign for Polkadot.
Besides confirming the current breakdown as a deviation, it would also cause a breakout from the descending resistance line, which coincides with the $6 area.
However, if the decrease continues, the next closest support area will be at $3.90.
Therefore, whether the DOT price reclaims the $6 area will determine the future Polkadot price prediction.
Polkadot Price Trades in Bullish Pattern
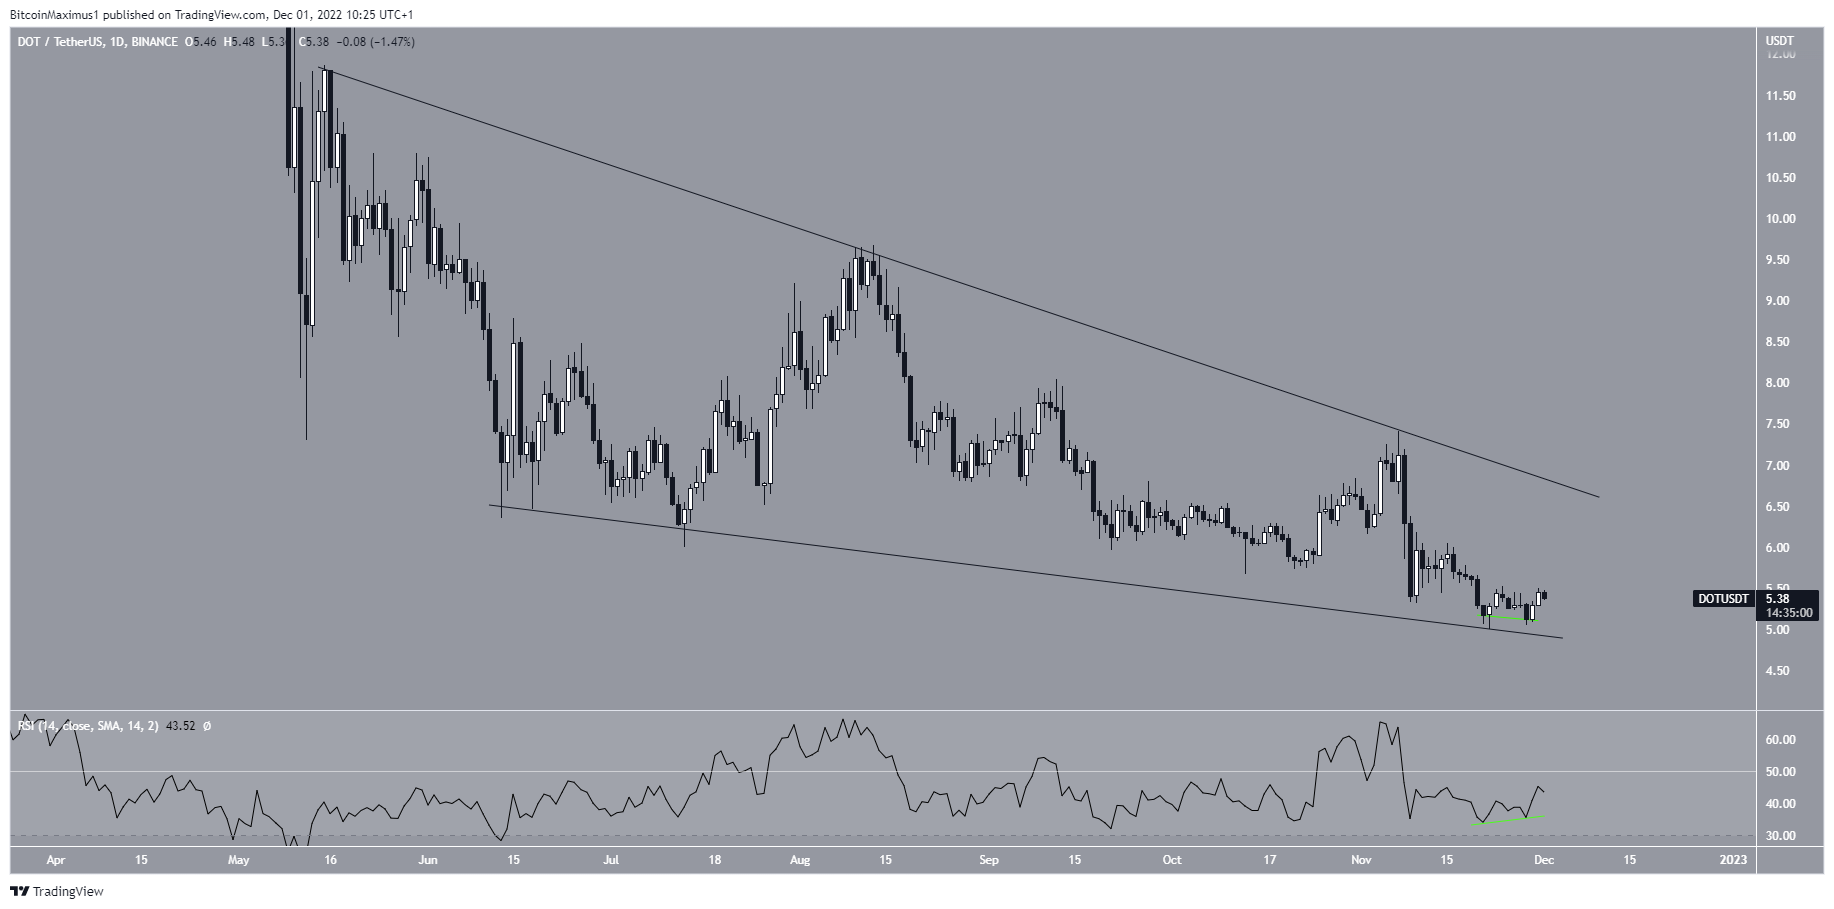
The price chart from the daily time frame shows that Polkadot has been trading inside a descending wedge since May 15. The descending wedge is considered a bullish pattern, meaning that it leads to breakouts the majority of the time.
The Polkadot price bounced at the support line of the wedge on Nov. 22. Afterward, the daily RSI generated bullish divergence, catalyzing the current increase.
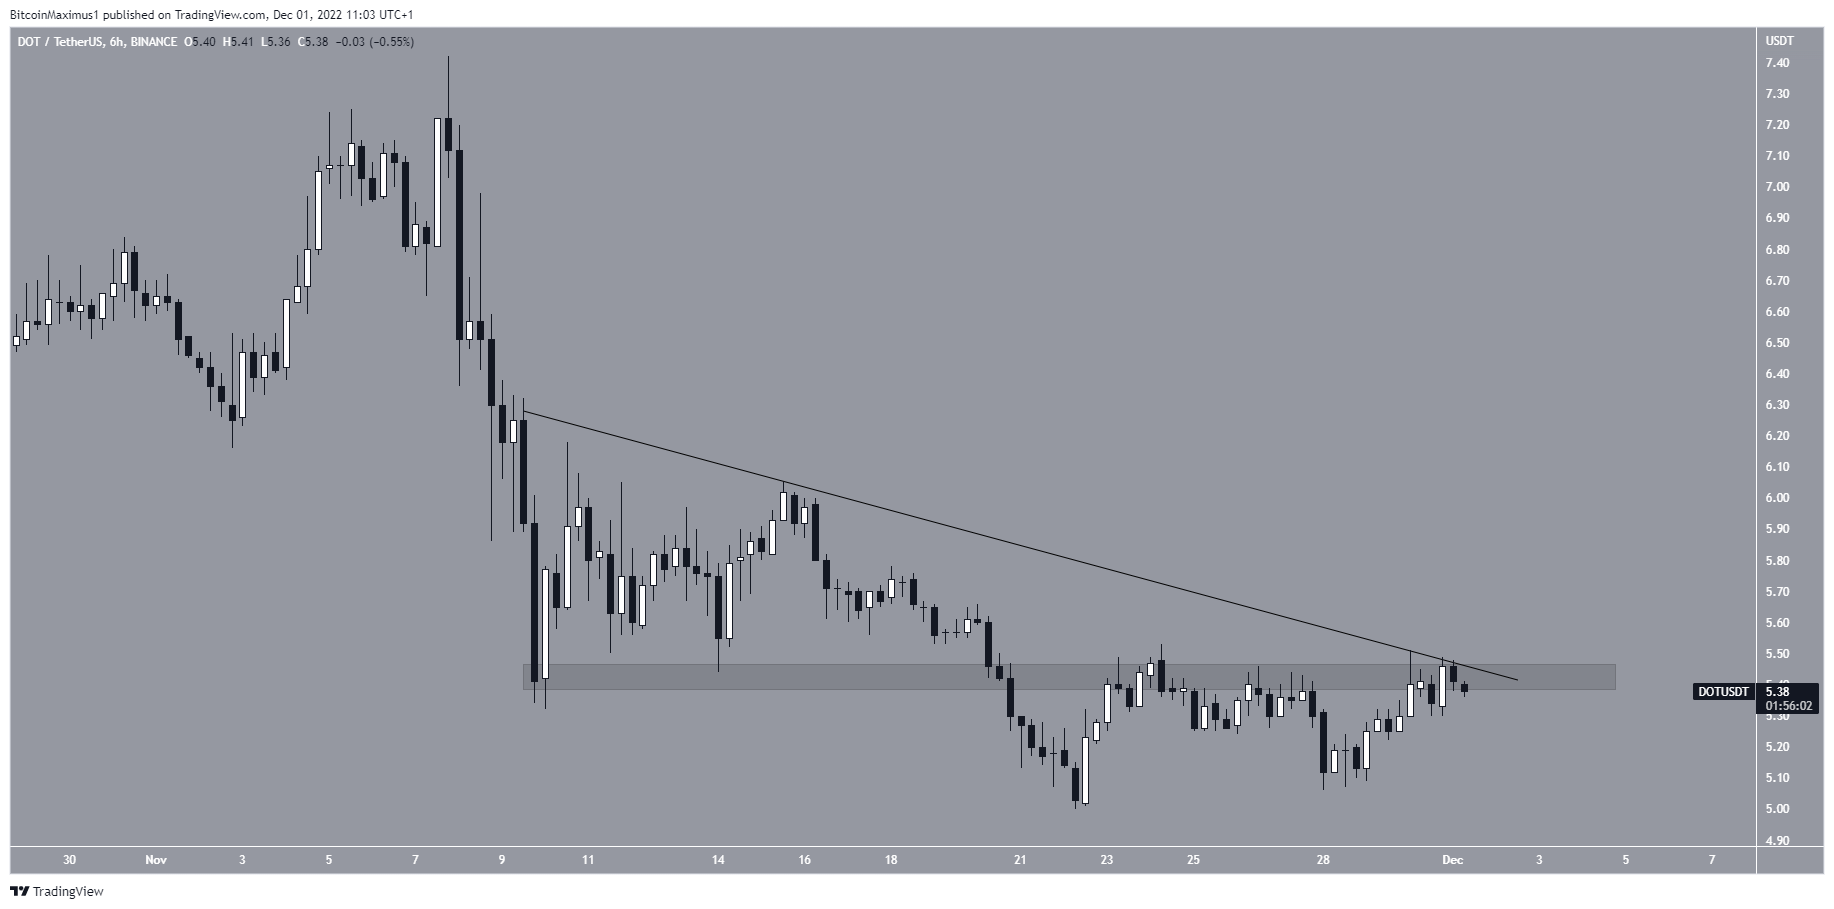
However, the six-hour chart shows that the DOT price is still following a descending resistance line and has been rejected by the $5.40 resistance area.
So, the most likely DOT price prediction suggests that a rejection and decrease will follow. This would potentially validate the support line of the wedge once more.
Conversely, a reclaim of the $5.40 area would invalidate this bearish Polkadot price prediction.
For BeInCrypto’s latest crypto market analysis, click here.
Disclaimer: BeInCrypto strives to provide accurate and up-to-date news and information, but it will not be responsible for any missing facts or inaccurate information. You comply and understand that you should use any of this information at your own risk. Cryptocurrencies are highly volatile financial assets, so research and make your own financial decisions.


