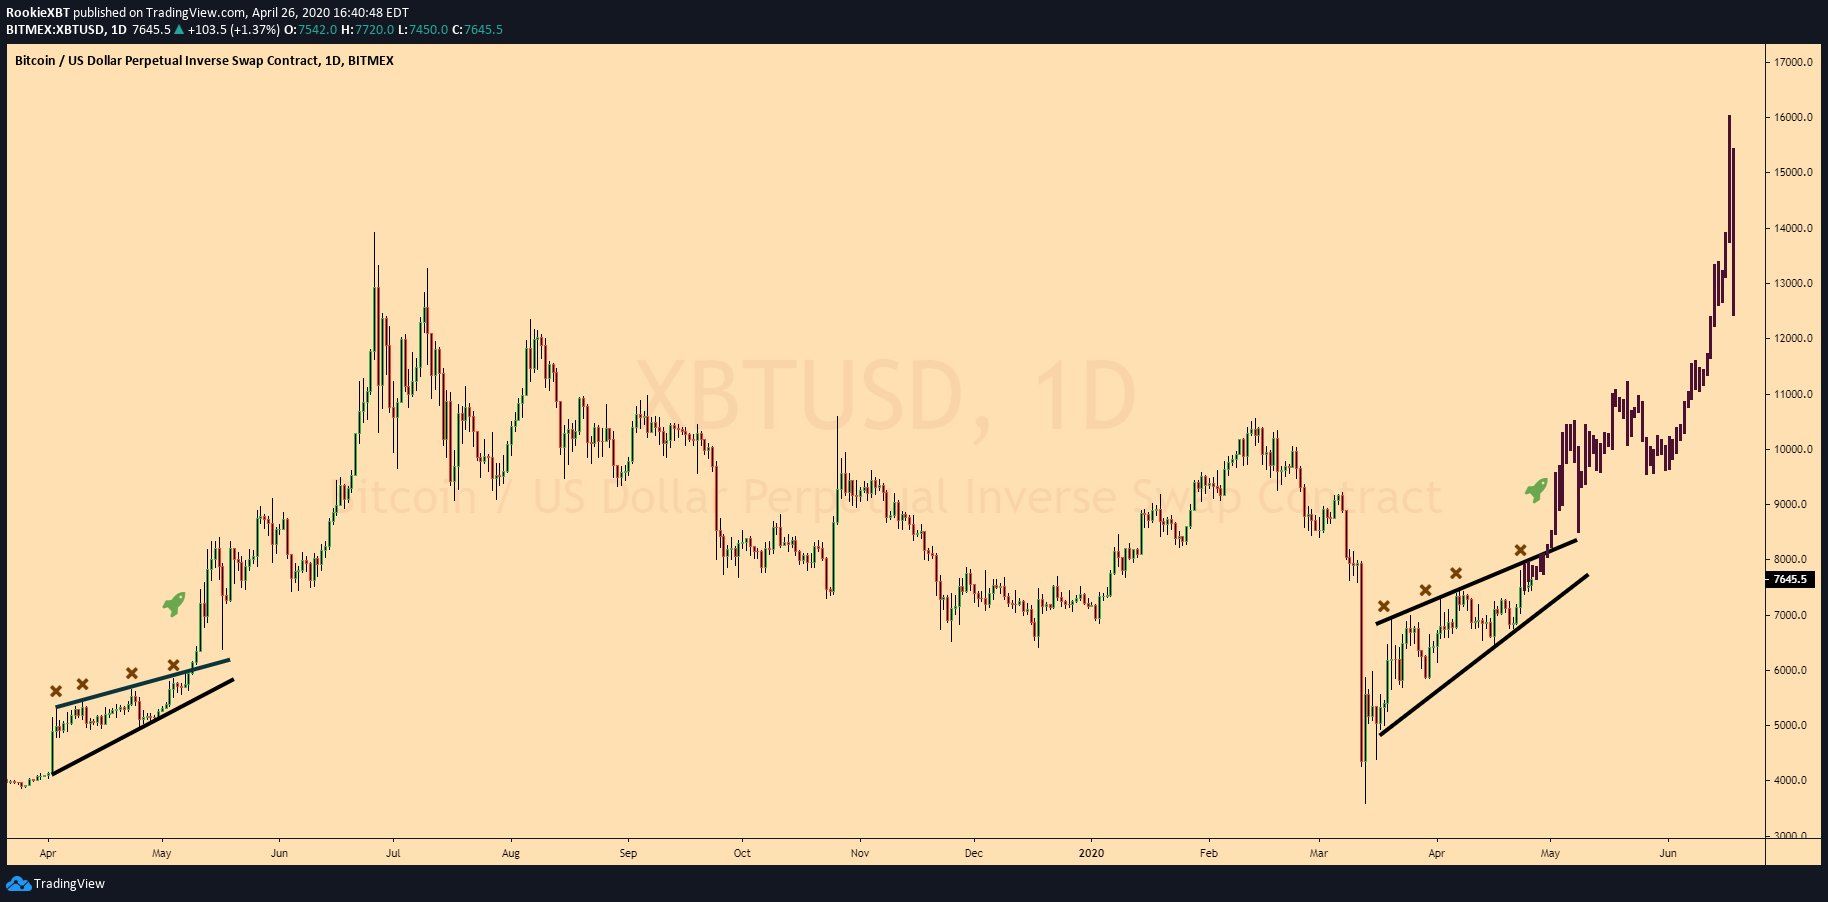
Throughout April and May 2019, the Bitcoin (BTC) price has traded inside an ascending wedge. Even though this is considered a bearish reversal pattern, the price broke out and increased by more than 100 percent afterward.
Interestingly, since reaching a bottom on March 13, the price has been trading inside a similar ascending wedge.
This caused the well-known cryptocurrency trader @RookieXBT to investigate the possibility that the movement afterward will also be similar. He outlined a BTC chart showing the two ascending wedges from 2019 and the present.
He suggests that the movement afterward will be similar, and the BTC price could reach a high of $16,000 by July.

The chart bears do not want you to see. Do not underestimate #Bitcoin Disclaimer: This is for entertainment purposes only (or is it)…
Bitcoin Fractal Comparison
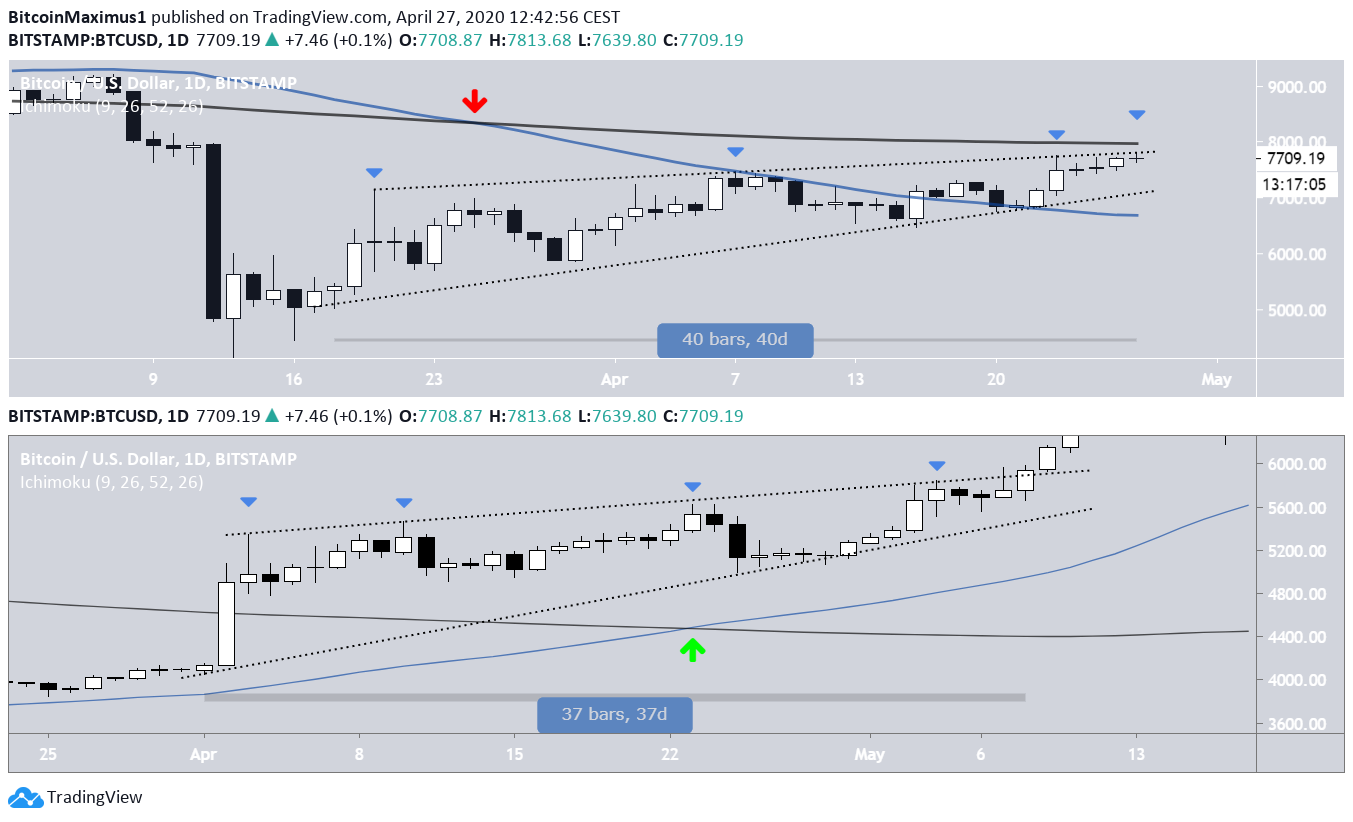
When looking at both charts, the first things that stand out are the similarities in time periods and the number of times the resistance line was touched — four in both cases. In 2019, the price broke out after 37 days, while currently, it’s on day 40. The biggest dissimilarity comes from the 50 and 200-day moving averages (MA) and the relationship of the price to them. In the 2019 movement, the price was trading above both MAs, which had previously made a bullish cross (green arrow). On the other hand, the price is facing very heavy resistance from the 200-day MA in the current movement. In addition, the same MAs have previously made a bearish cross (red arrow). Therefore, the momentum was on the bullish side during the 2019 movement, while it is on the bearish side at present. This raises the likelihood that the price will break down, rather than break out as it did in 2019.
Important Levels
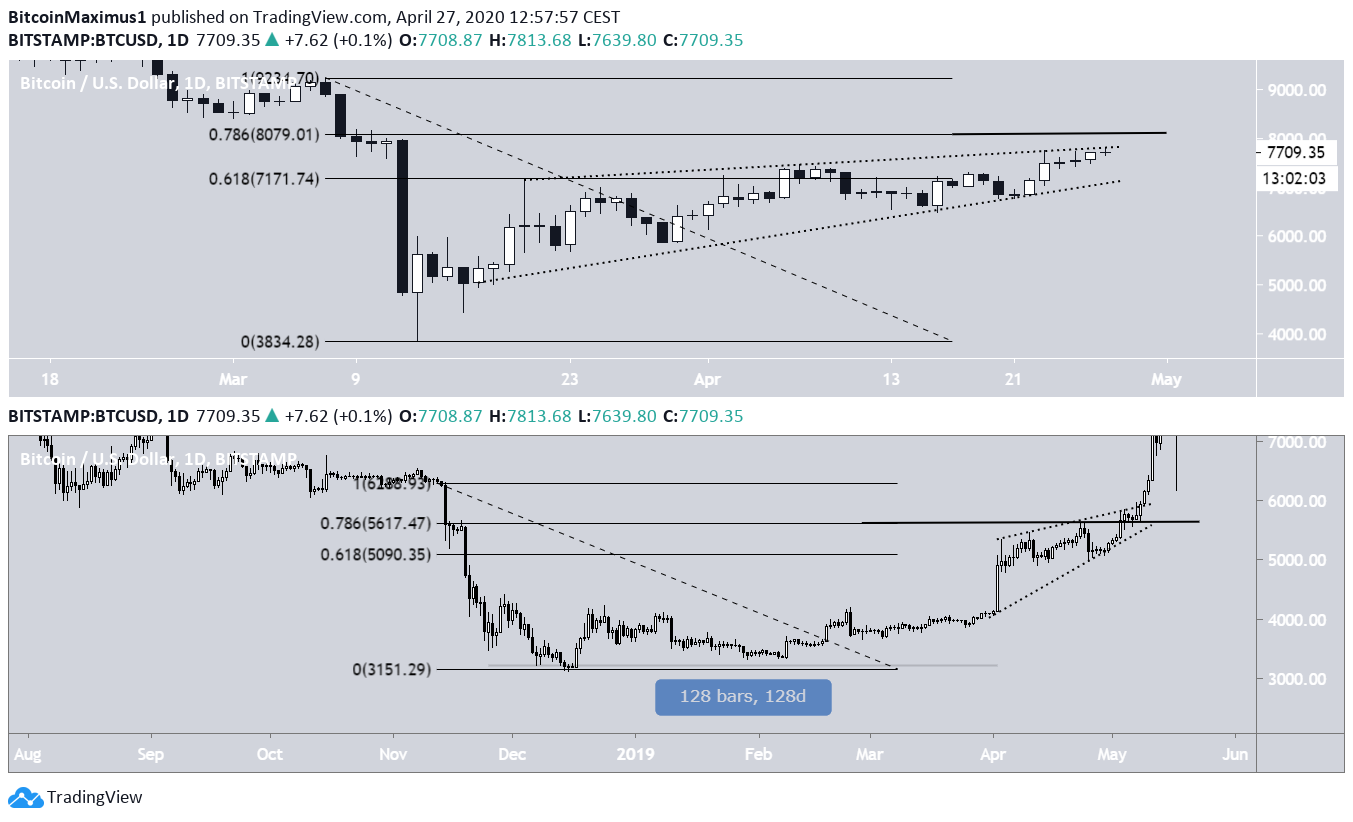
Another difference appears when looking at the movement preceding the wedge and incorporating Fibonacci levels in the analysis. In the current movement, the wedge was created right after the rapid drop. At the time of writing, the price was trading between the 0.618 and 0.786 fib levels, a likely place to initiate a trend reversal. In the 2019 movement, the price consolidated for 128 days before creating the wedge. This raised the possibility of the price breaking out to the upside, due to the very long accumulation period prior to the creation of the wedge. To contrast this with the current movement, a breakout would complete a V-shaped recovery, which is much more uncommon. Furthermore, in the 2019 movement, the price had moved above the 0.786 fib level well before the breakout. This further confirms the findings from the previous section, in which we stated that ‘the momentum was on the bullish side during the 2019 movement, while it is in the bearish side in the current movement.’
Disclaimer
In line with the Trust Project guidelines, this price analysis article is for informational purposes only and should not be considered financial or investment advice. BeInCrypto is committed to accurate, unbiased reporting, but market conditions are subject to change without notice. Always conduct your own research and consult with a professional before making any financial decisions. Please note that our Terms and Conditions, Privacy Policy, and Disclaimers have been updated.

Valdrin Tahiri
Valdrin discovered cryptocurrencies while he was getting his MSc in Financial Markets from the Barcelona School of Economics. Shortly after graduating, he began writing for several different cryptocurrency related websites as a freelancer before eventually taking on the role of BeInCrypto's Senior Analyst.
(I do not have a discord and will not contact you first there. Beware of scammers)
READ FULL BIO
Sponsored
Sponsored

