During the recent Bitcoin (BTC) increase, the Bitcoin Cash (BCH) price has lagged behind considerably. This divide is best illustrated when looking at the BCH/BTC pair, which is rapidly approaching all-time lows.
Bitcoin enthusiast @Zackvoell tweeted a BCH price chart that shows that the price has decreased below a significant support level that has also acted as the 2020 low.

In this article, we will take a closer look at the BCH price movement and determine if a reversal is in the cards.
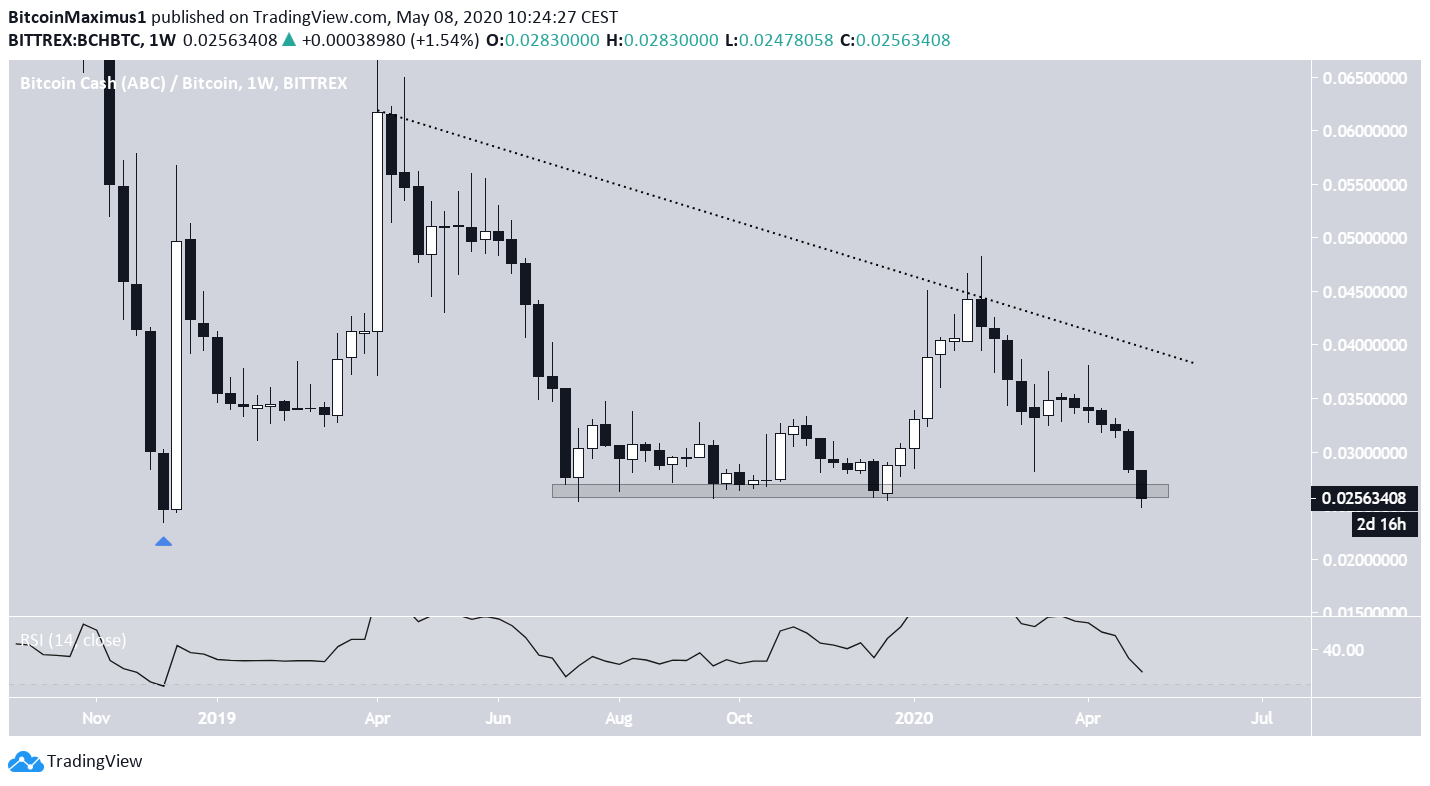
Bitcoin Cash Weekly
The BCH price has been decreasing since April 2019, when it reached a high of ₿0.067. The price seemingly began an upward move on January 2020, but that only served to create a lower-high before the price resumed its downward movement the next month.
At the time of publishing, the price was trading slightly below the ₿0.026 area, which has been acting as support since August 2019. A decrease below this area is likely to take the price to its all-time low of ₿0.0234.
The weekly RSI has not generated any bullish divergence nor is it inside oversold territory, so the downward move is likely to continue.
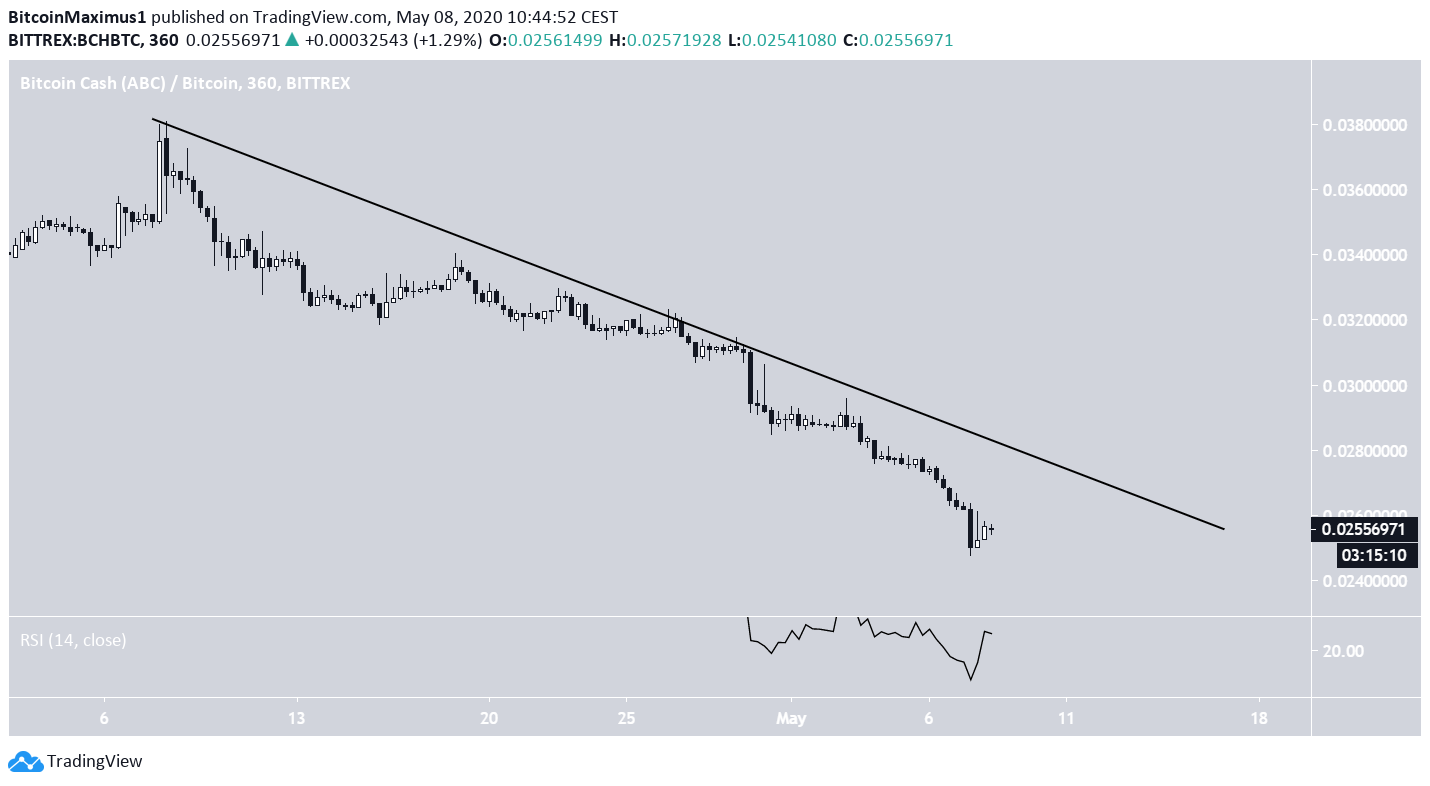
In the shorter-term, the price is similarly following a descending resistance line and has been doing so since April 8, when the rate of decrease really accelerated. The resistance line is very steep, and the price could decrease at this rate until it reaches its all-time low price.
A breakout above this line would indicate that the downtrend has ended, at least in the short-term, and initiate an upward move towards the dashed resistance line from the previous image.
BCH/USD Outlook
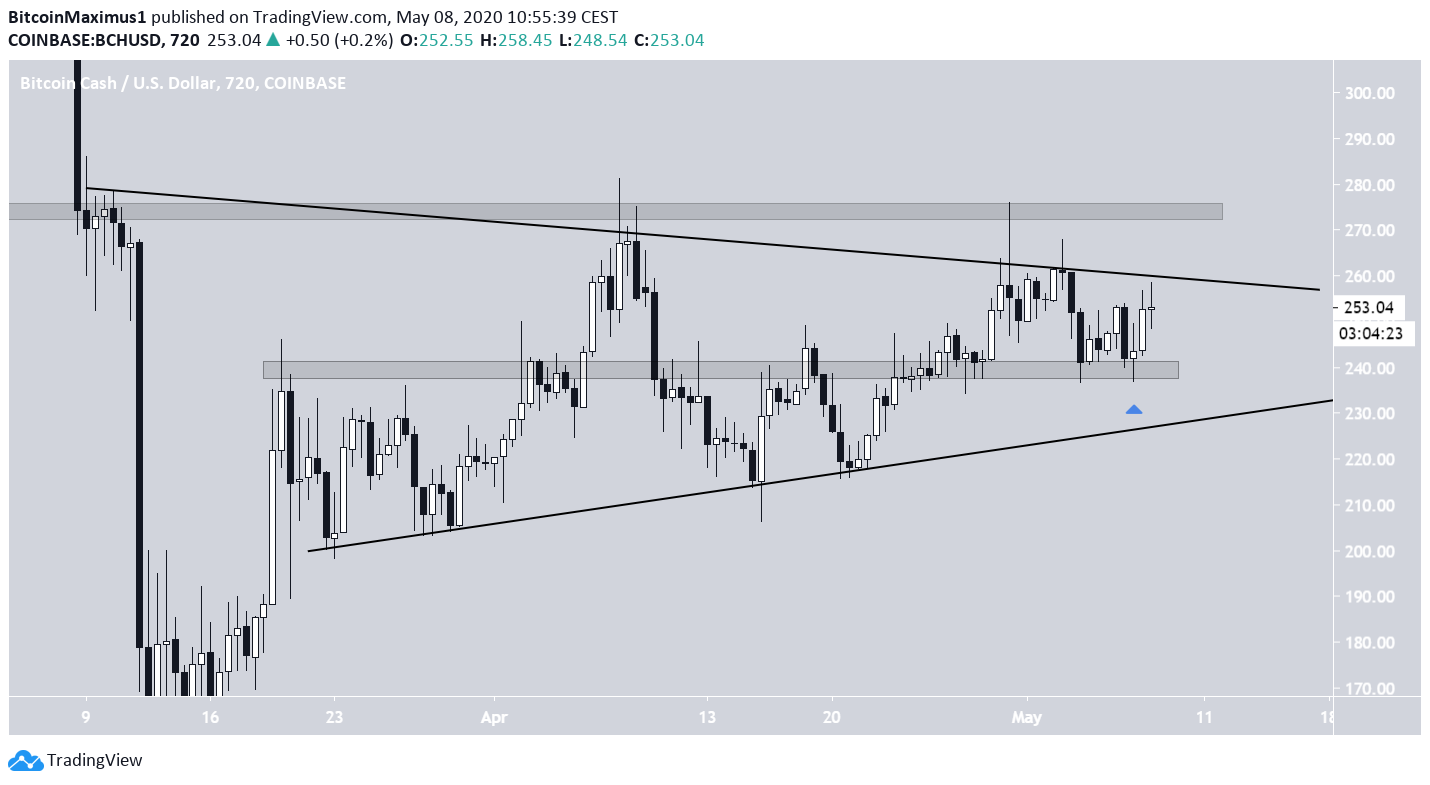
The BCH/USD pair is holding up better. The price has been trading inside a symmetrical triangle since March 9 and is currently very close to its resistance line. The price has shown strength by staying above $240, a sign that it might make another attempt at breaking out above the resistance line of the triangle.
However, the main area of importance is found at $275, a resistance which has rejected the price thrice before. Until the price is able to successfully break out above this level, its price movement is considered bearish.