


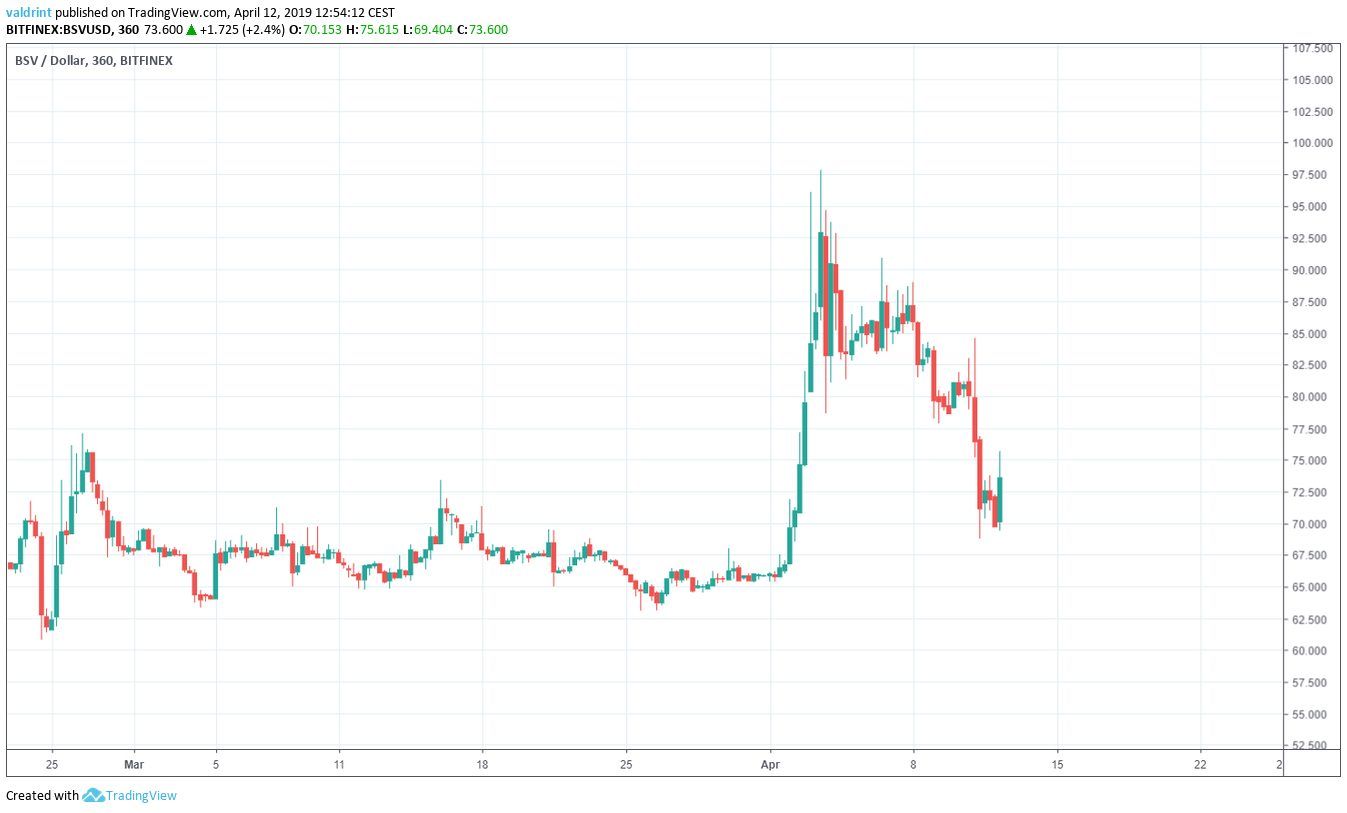
On Feb 26, 2019, the price of Bitcoin Cash SV (BSV) reached a high of $77.03. A gradual decrease ensued.
Bitcoin SV reached a high of $97.85 on Apr 3. This high followed a market-wide spike that began the day prior. Price has steadily fallen since.
Despite these losses, Bitcoin SV is still trading above the lows faced in March. However, if Bitcoin SV is delisted form Binance, we may expect rapid and significant prices drops.
Nonetheless, this has not yet happened, so we will analyze Bitcoin SV like any other cryptocurrency. This means we are taking a look at the numbers and indicators outside of qualitative factors.
Bitcoin Cash SV (BSV): Trends and Highlights For April 12, 2019
- BSV/USD made a high of $97.85 on Apr 3.
- It has been decreasing since.
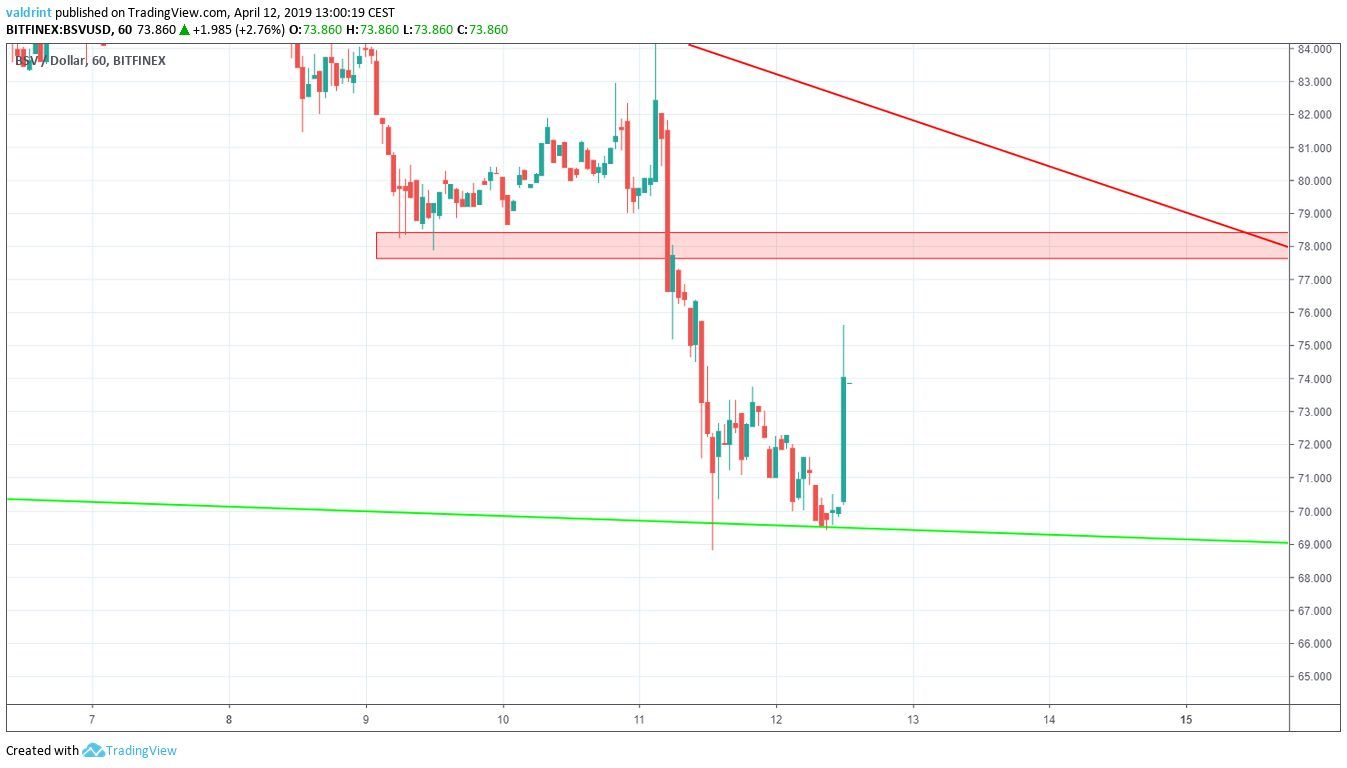
- The price of Bitcoin SV is trading inside a descending wedge.
- There is bullish divergence developing in the RSI.
- There is resistance near $78.
Descending Wedge
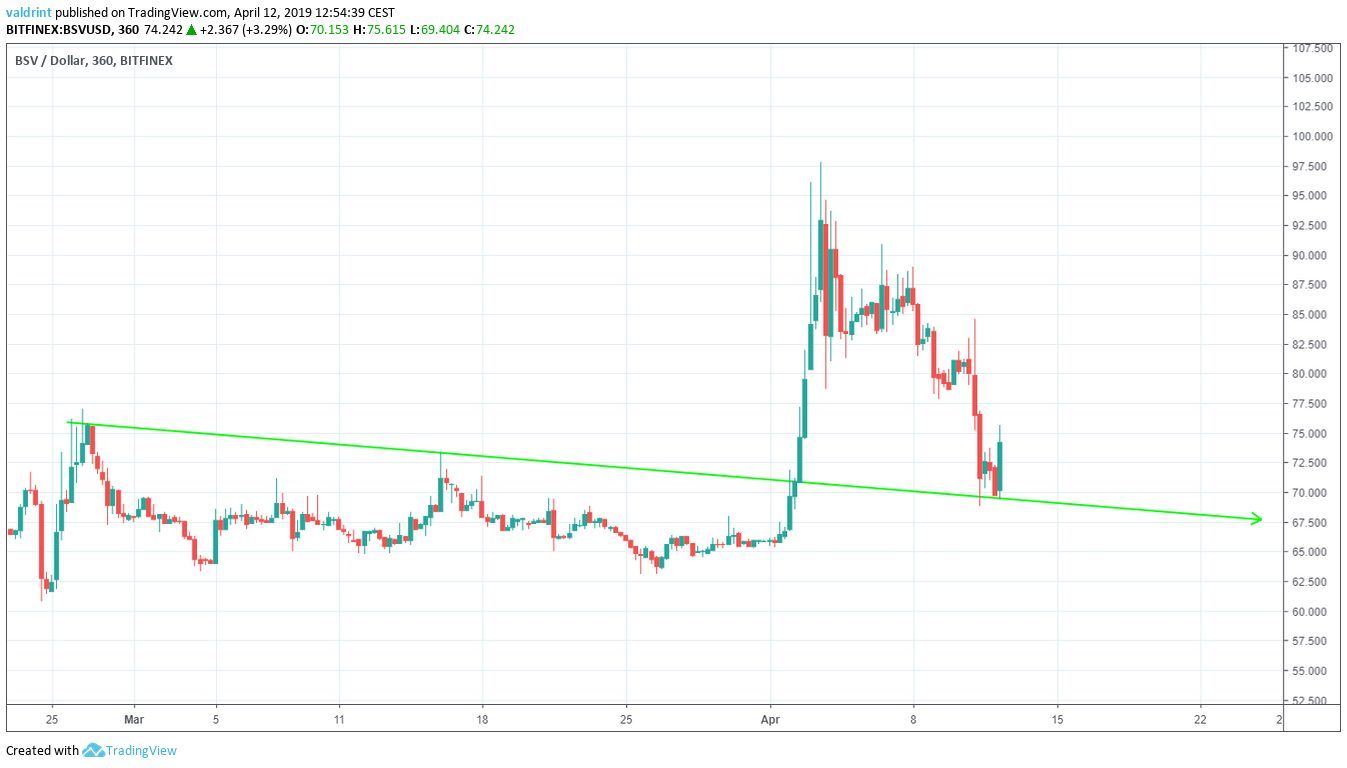
On Feb 26, Bitcoin SV reached a high of $77.03. A sharp decrease was followed by a gradual increase. Price made another lower high.
Tracing these highs gives us a descending resistance line.
The price broke out above this line on Apr 3. Since that time, the resistance line has acted as a support line. On Apr 12, the line was validated for a second time.
On Apr 3, the price made a high of $97.85. A sharp decrease in price ensued. The price has made several lower highs. Tracing these highs gives us a descending resistance line.
The support and resistance lines combine to create a descending wedge for the period Apr 2-12:
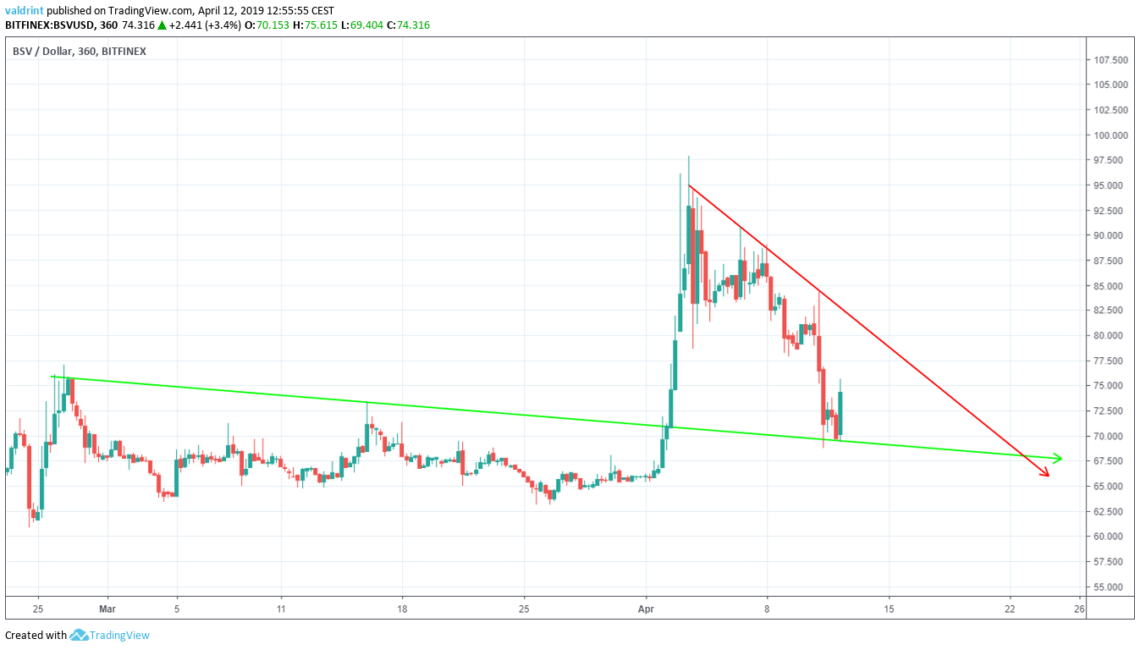
It is likely that the price will continue trading inside the confines of this wedge until a decisive move occurs. It is possible that the price could fall below the support line in the near future for four reasons:
- The former resistance line has only been validated as a support line twice—diminishing its overall validity.
- Bitcoin SV only rose above the support line during a market-wide spike initiated by Bitcoin (BTC).
- Currently, Bitcoin SV is trading near the support line after a significant drop.
- There remains the possibility of delisting on Binance. The threat alone could cause catastrophic price drops.
In order to predict whether or not a breakdown is likely, however, requires a look at some technical indicators.
Technical Indicators
RSI is shown beloew the current trading pattern in the chart below:
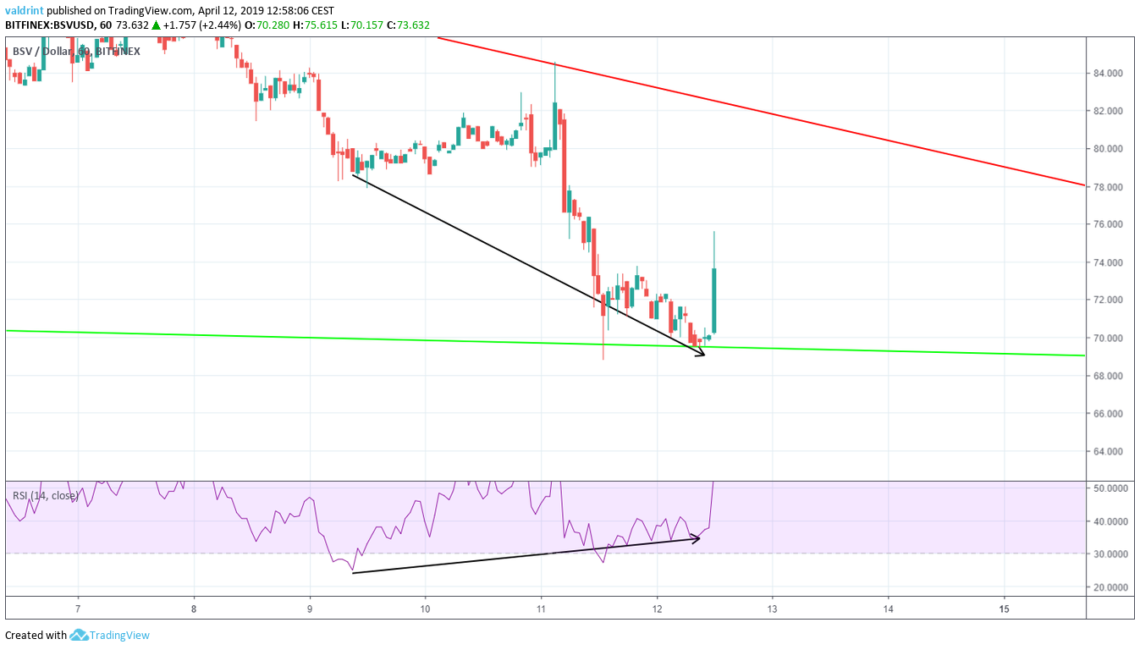
On Apr 9, the price made a low of $77.80. On Apr 11, it made another low of $68.80.
Similarly, the RSI made the first low on Apr 11. However, it has continued to generate higher values since.
This is known as bullish divergence and often precedes price increases.
Using this indicator, it is likely that the price will increase towards the resistance line of the wedge.
However, the divergence is only visible in short-term time frames. Furthermore, there are many factors which suggest price increases may not occur at all or that they may be very short-lived. A breakout does not currently appear likely.
Future Movement
The closest resistance area is found near $78. According to our analysis, it is possible that the price will reach this area.
Summary of Analysis
Based on this analysis, the price of Bitcoin SV is likely to increase and reach the resistance area we have outlined above. However, this is based on quantiative considerations alone.
If BCHSV is delisted from Binance, there could be drastic deviations from the predictions made above. The price may plummet as a result of qualitiatve conditions that cannot be accurately represented by statistical data alone.
LEARN ABOUT 0 COMMISION BTC INVESTING HERE!
Disclaimer: This article is not trading advice and should not be construed as such. Always consult a trained financial professional before investing in cryptocurrencies, as the market is particularly volatile.


