
The TRON (TRX) price broke down from the $0.055 long-term horizontal support area. The trend is considered bearish until this area is reclaimed.
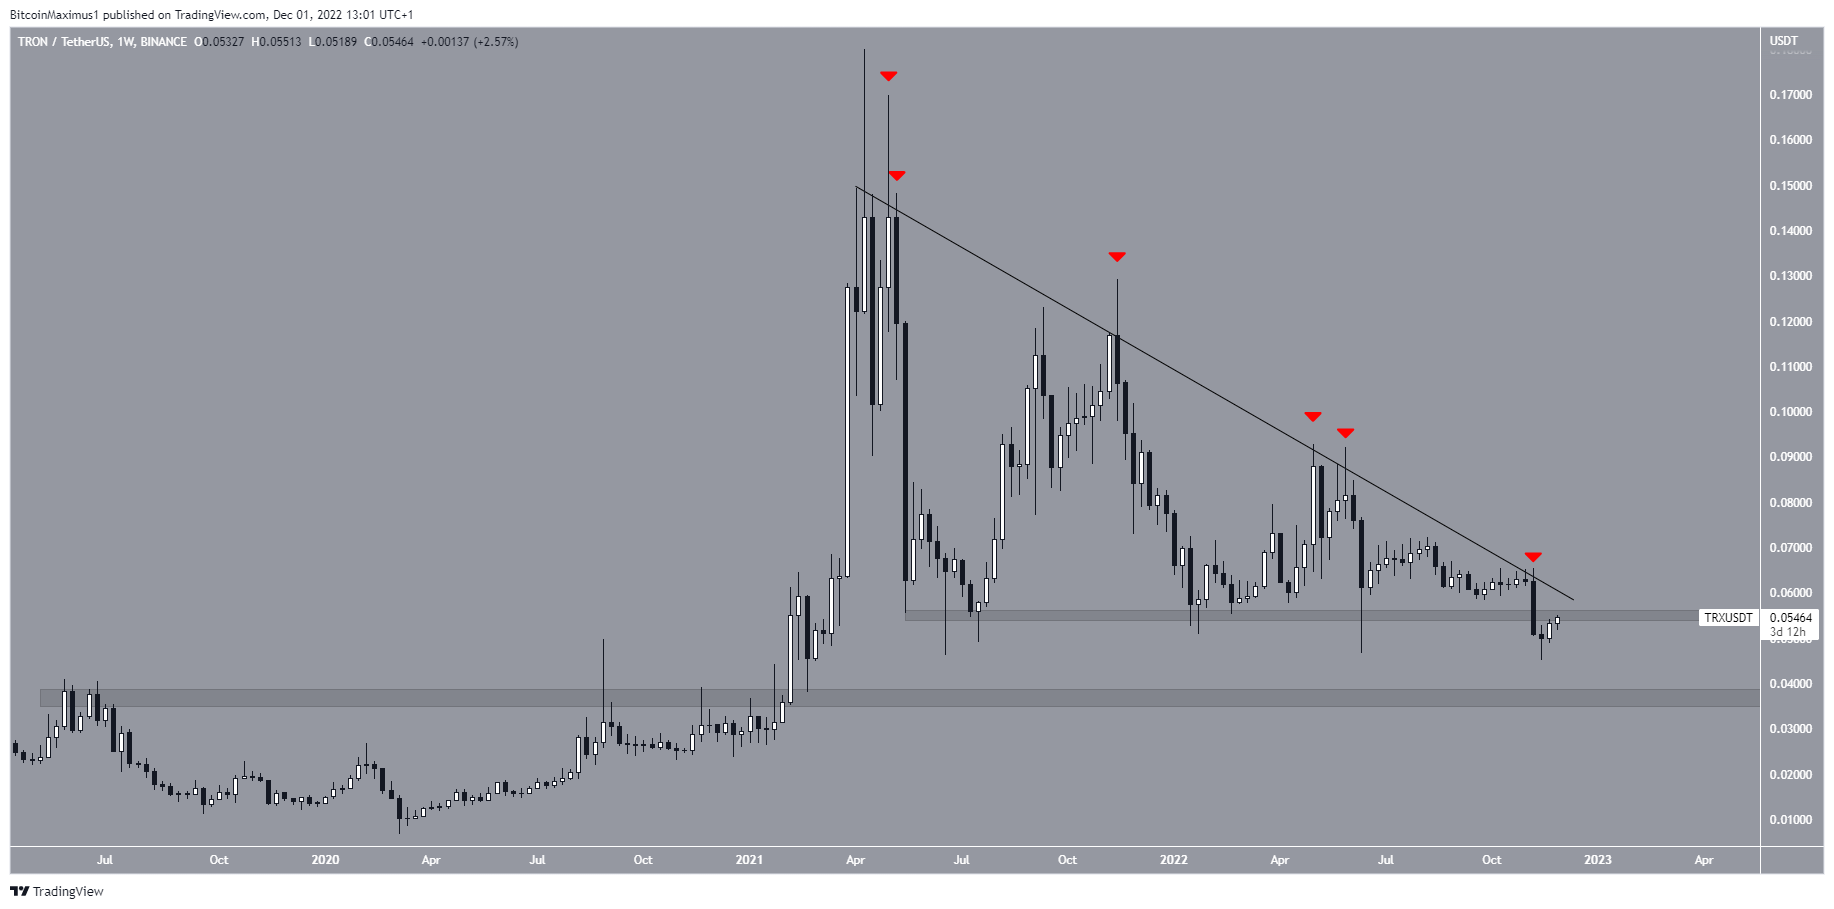
TRX is the native token of the TRON blockchain, created by Justin Sun. The weekly time frame technical analysis is bearish. It shows that the TRX price decreased below a descending resistance line since reaching a high of $0.188 on April 2021. The high was 50% below the Jan. 2018 all-time high of $0.35.
The line has caused six rejections so far (red icons). The most recent was on Nov. 7. It caused a breakdown from the long-term $0.05 support area, a decrease seen throughout the crypto market. This was considered a very bearish development since the area had been in place since May 2021.
As a result, the TRX price prediction is considered bearish until the price reclaims the $0.055 area. Since the area also coincides with the long-term descending resistance line, this seems unlikely.
If the downward movement continues, the next closest support area would be at an average price of $0.036.
TRX Price Prediction: TRON Faces Sheer Drop
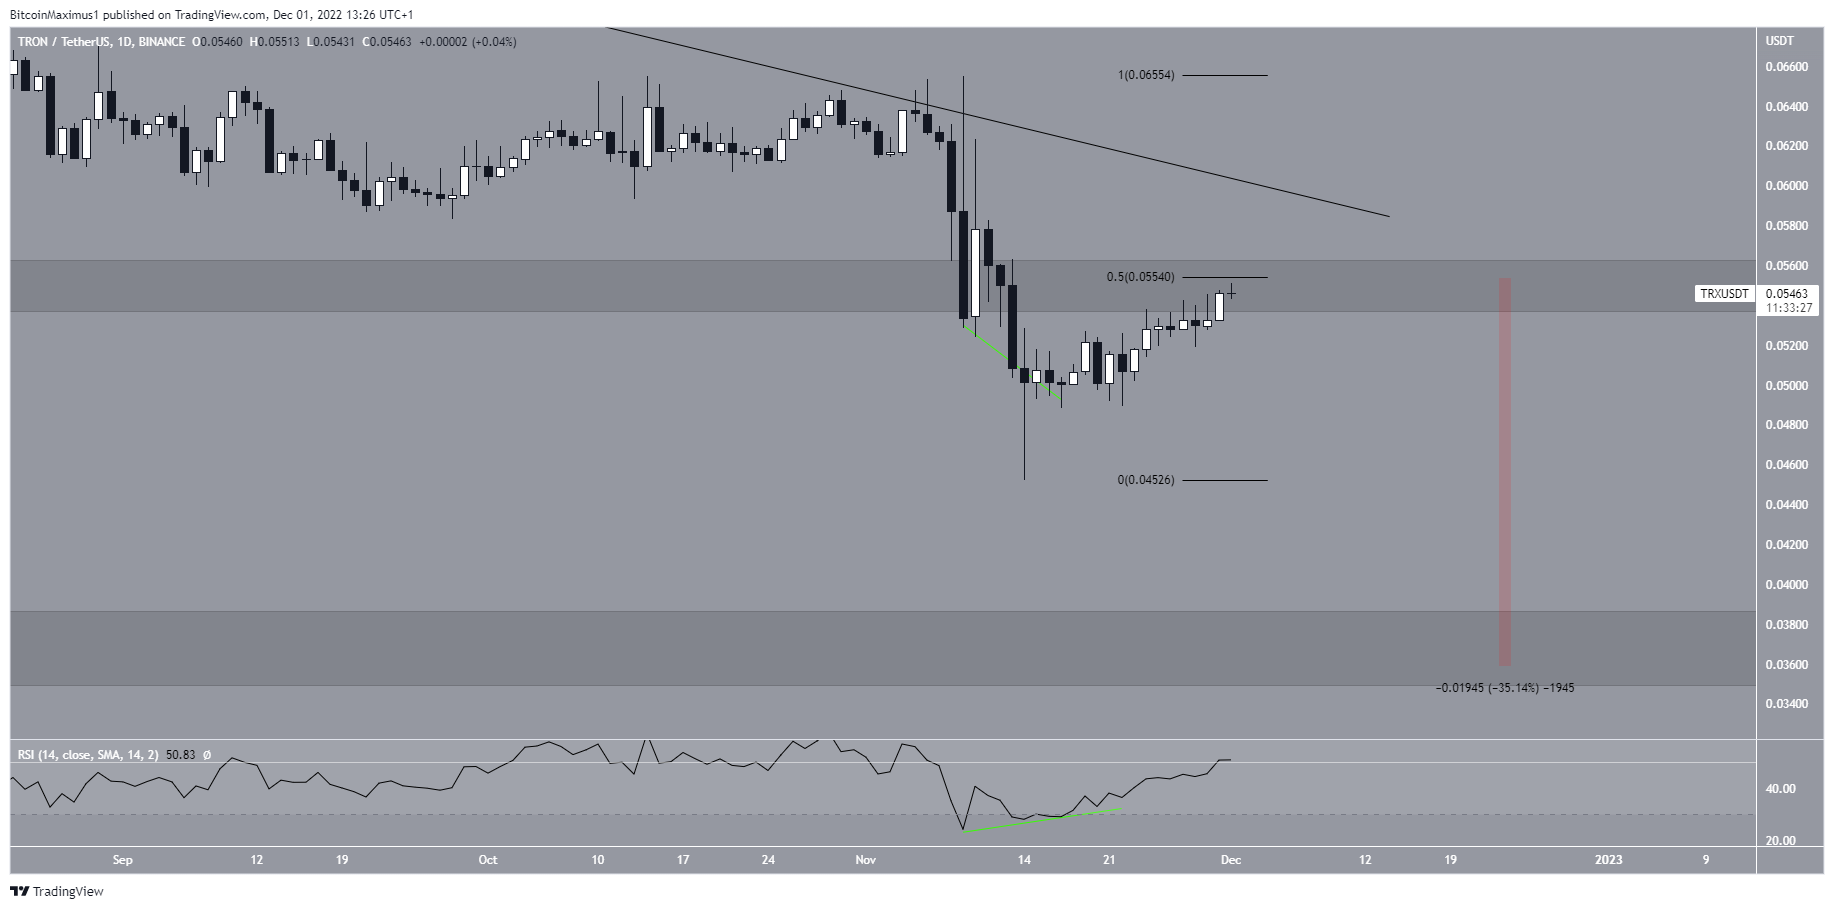
The daily chart shows that the TRX price began an upward movement on Nov. 14, creating a very long lower wick (green icon). Such wicks are considered signs of buying pressure.
Afterward, the daily RSI generated bullish divergence (green line), preceding the current upward movement. The rate of increase accelerated over the past 24 hours, taking the TRX price to the $0.055 resistance area, which also coincides with the 0.5 Fib retracement resistance level.
Therefore, the current level is ideal for a rejection due to the confluence of these resistance levels. Moreover, the daily RSI has reached the 50-line from below, strengthening the legitimacy of the resistance area.
If a rejection occurs, the TRX price could fall all the way down to the previously outlined support area of $0.036.
On the other hand, a reclaim of the $0.055 level would invalidate this bearish TRX price prediction.
For BeInCrypto’s latest crypto market analysis, click here.
Disclaimer: BeInCrypto strives to provide accurate and up-to-date news and information, but it will not be responsible for any missing facts or inaccurate information. You comply and understand that you should use any of this information at your own risk. Cryptocurrencies are highly volatile financial assets, so research and make your own financial decisions.
