On May 2, the prices of both EOS and XRP broke down below important support levels. While it is possible that a short-term bounce transpires, which causes a validation of these levels, it is likely that they both will continue decreasing towards their closest respective support areas.
The prices of both assets have been correlated, with EOS leading XRP slightly. Its chart was outlined by cryptocurrency trader @AltcoinSherpa, who noted that the price is decreasing towards its 2017 levels.
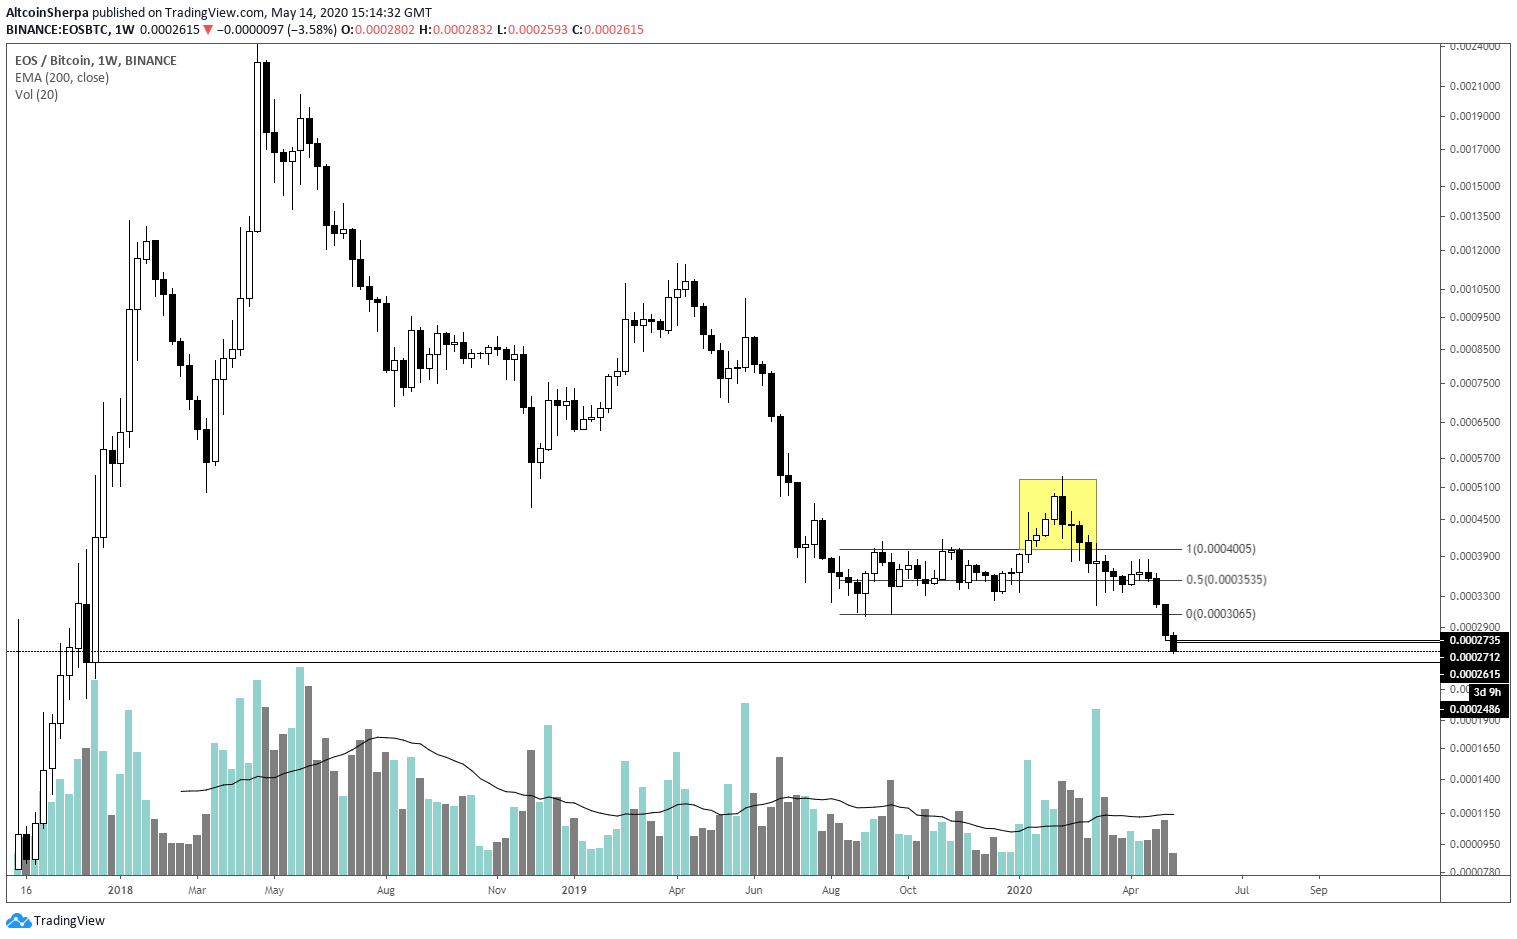
She stated that the price could decrease all the way to 25,000 satoshis.
$EOS #EOS: This looks horrible. Would definitely get out of this if…1D closes like this. 25k might be the next area up. Bearish af on all time frames.
In this article, we will take a closer look at the EOS price chart in order to determine where it will head to next. Since EOS and XRP have been previously correlated, we will also take a look at the XRP price movement.
EOS
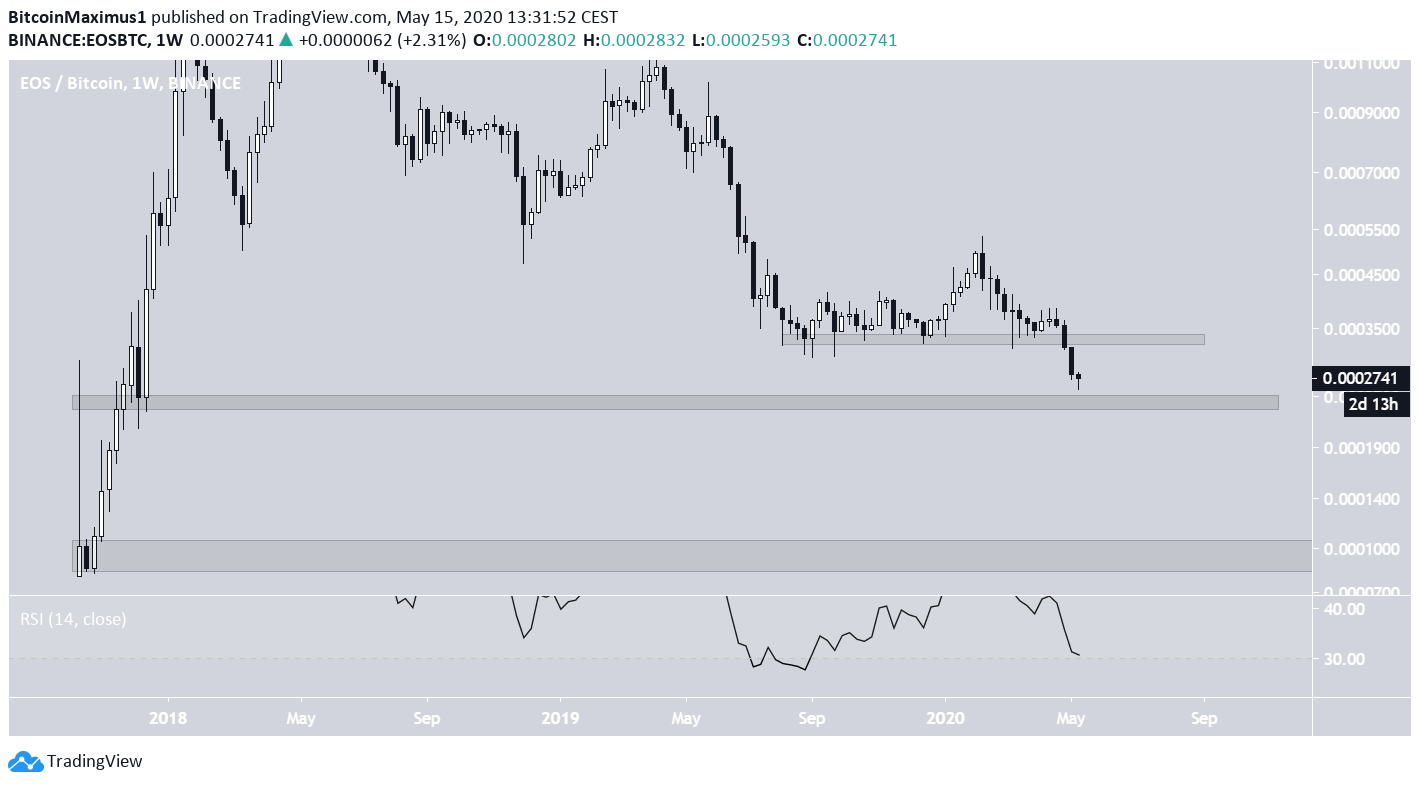
On May 2020, EOS broke down from the 33,500 satoshi area, which had been providing support since August 2019. The closest support area is found near 25,000 satoshis, only slightly below the current price.
If this area were to fail, EOS would likely head towards its all-time lows at 10,000 satoshis. While the RSI has been generating slight bullish divergence, the occurrence is not yet confirmed.
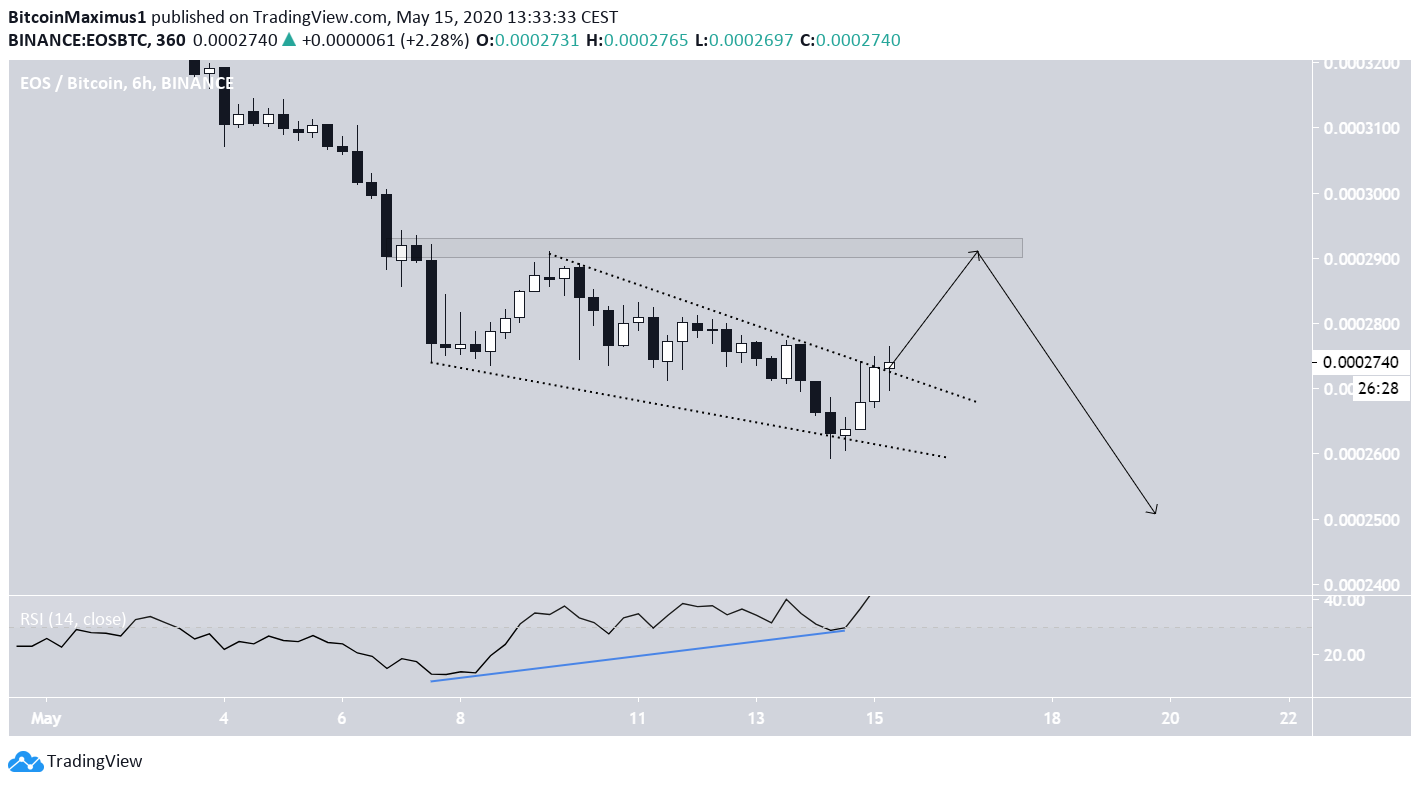
However, the short-term chart reveals that a bounce is likely. The price is in the process of breaking out from a descending wedge, which is known as a bullish reversal pattern. Furthermore, the RSI has been generating significant bullish divergence.
Therefore, it is likely that EOS breaks out from this wedge and validates the 29,000 satoshi resistance area before dropping towards the previously mentioned 25,000 satoshi support.
XRP
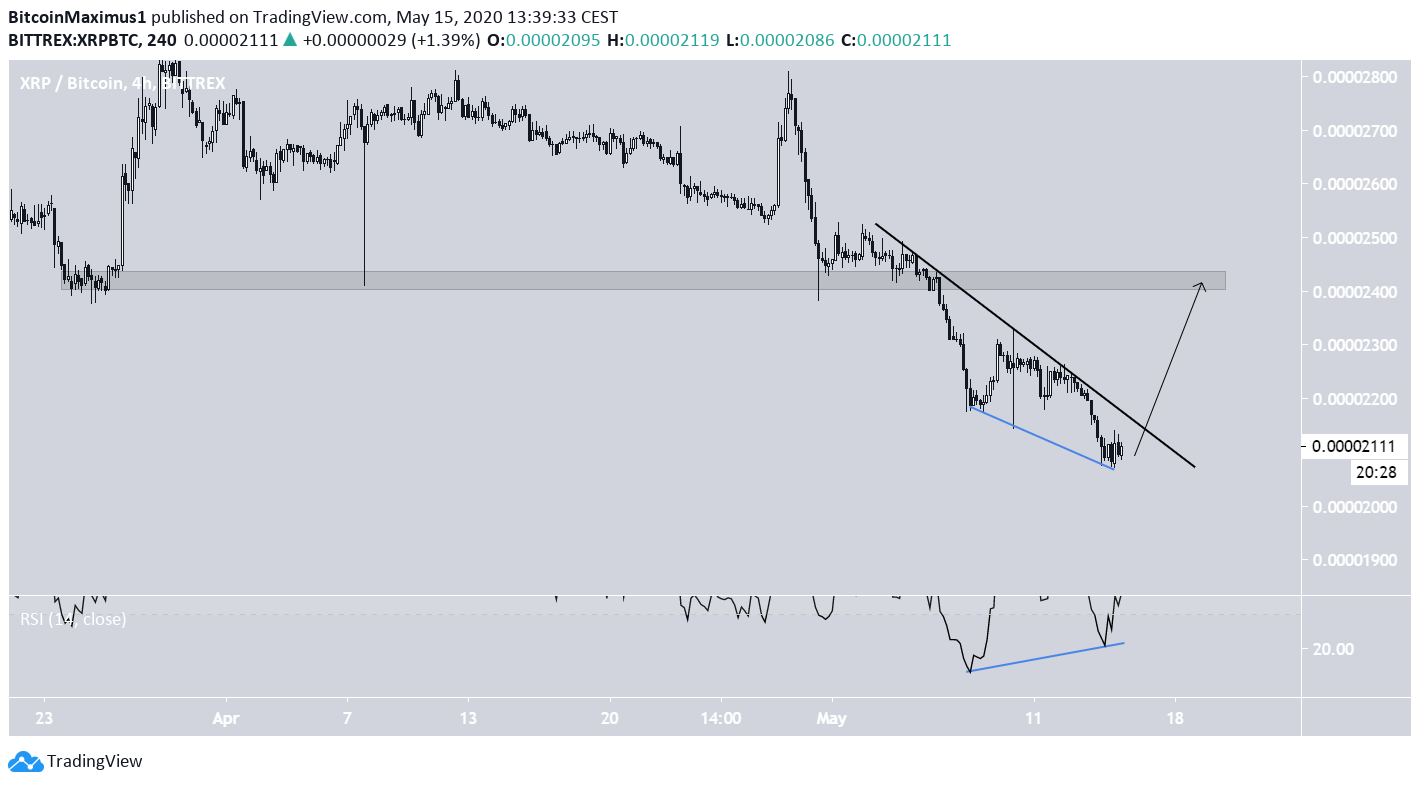
Similar to EOS, XRP broke down from a support level at 2,500 satoshis, one that it had been following since August 2019. The next support area is found at 1,450 satoshis. Therefore, XRP still has ample room to decrease before it reaches the closest support level.
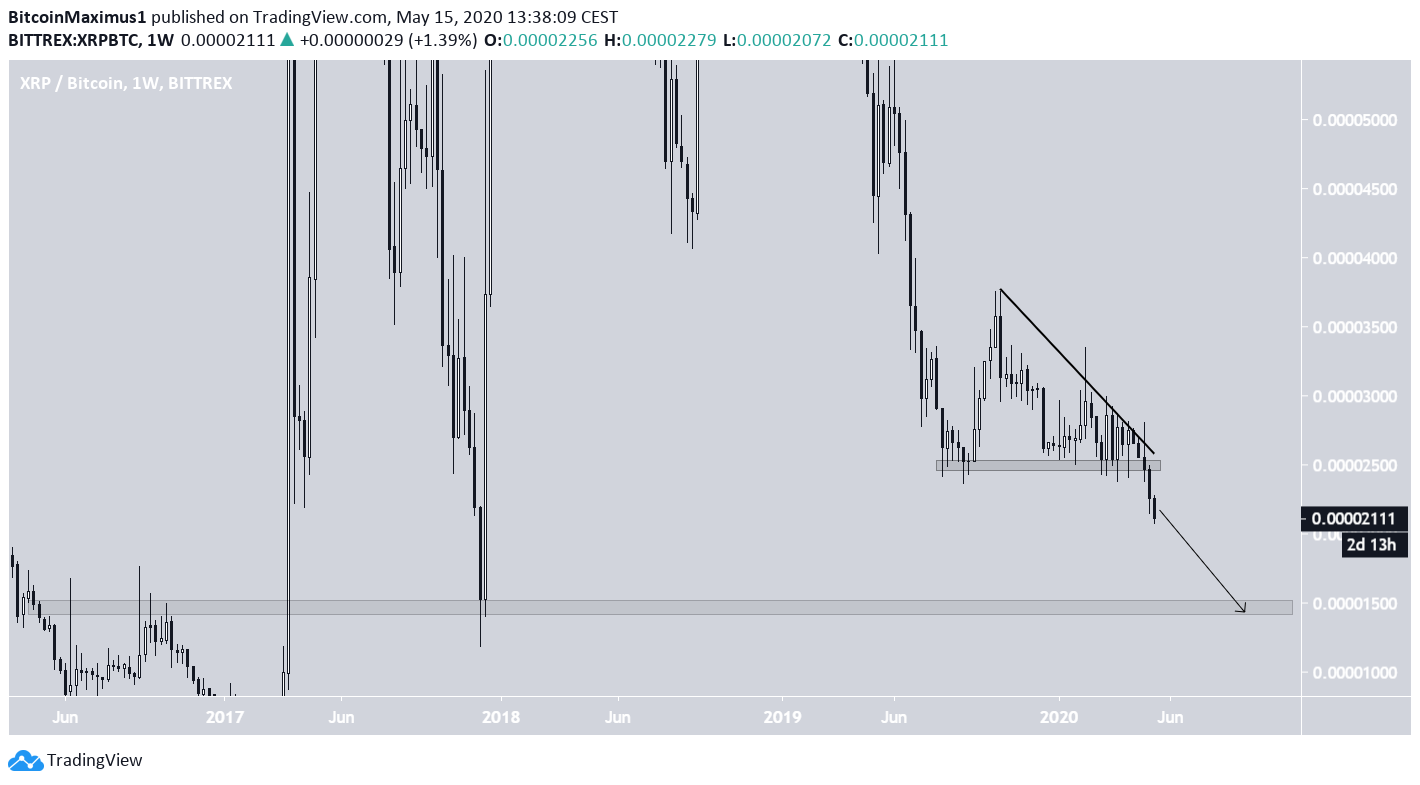
In the short-term, the price is following a very steep descending resistance line. As long as it is trading below it, its price movement is considered bearish.
However, the RSI has generated considerable bullish divergence, a sign that the price might break out. If so, it is likely to retest the 2,500 satoshi area from which it broke down before resuming its downward movement.