The XRP price has been decreasing since it reached a high of $0.326 on August 2. The move resembles a correction, which suggests that XRP will make a lower low before resuming its downward trend.
Top of the Upward Move?
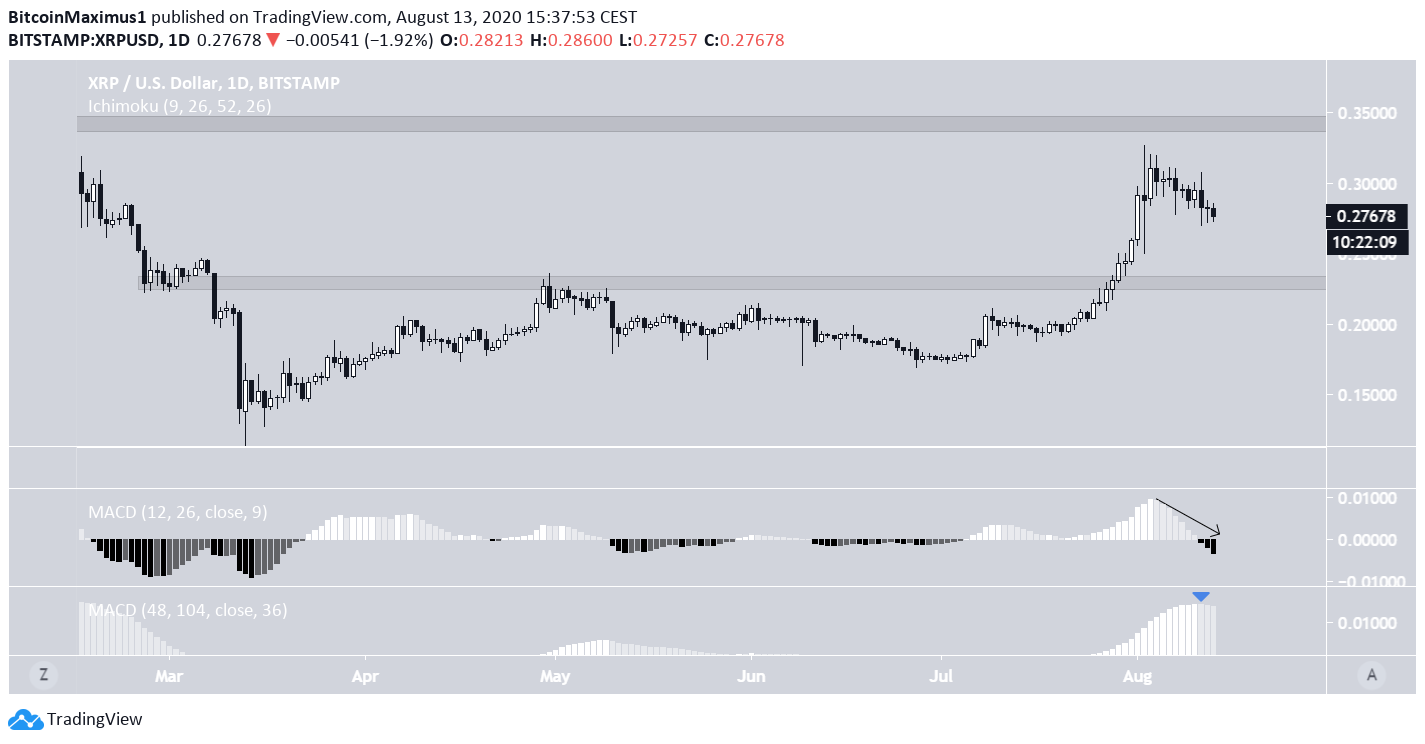
The XRP price has been increasing since March 13. On April 30, the price reached a high of $0.236, getting rejected by a long-term resistance area and initiating a downward correction that continued until June 27.
However, since then, XRP has been moving upwards at an accelerated rate, breaking out from the previous resistance area and increasing 95% since its low. However, after reaching a high of $0.326 on August 2, the price began a gradual downward retracement that is still ongoing.
The main long-term resistance and support levels are found at $0.345 and $0.230, respectively.
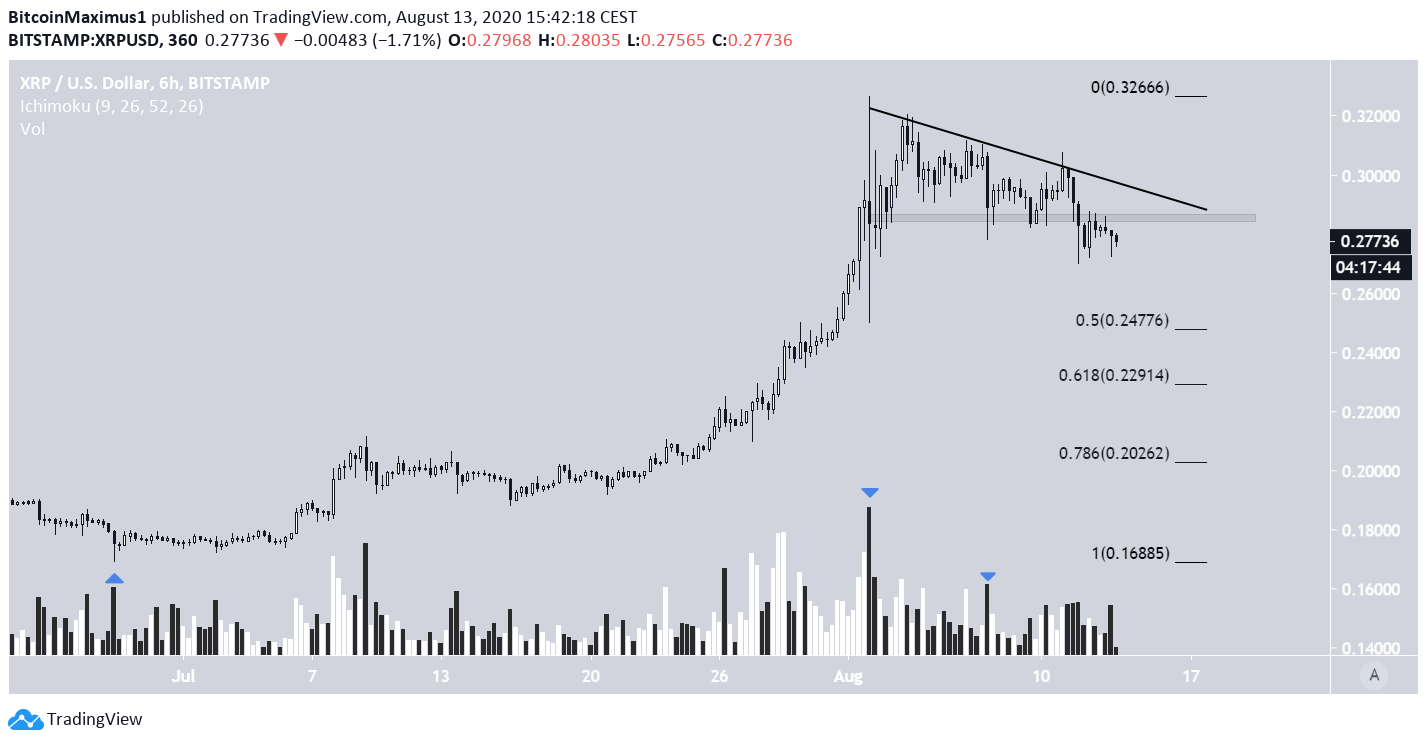
The shorter-term chart reveals that XRP has already lost the support of the $0.285 area, which is now likely to act as resistance. Furthermore, the price is following a descending resistance line from the August 2 high.
Unless the price successfully reclaims the support area and then breaks out from the resistance line, the price action is bearish. In addition, it’s notable that volume has been higher during bearish candlesticks than during their bullish counterparts.
If XRP continues falling, the closest support levels would be at the 0.5, 0.618, and 0.786 Fib levels, found at $0.247, $0.229, and $0.202, respectively.
XRP Wave Count
Cryptocurrency trader @Davecrypto83 posted an XRP chart, which shows a wave count of the price declining to $0.23, before a final pump towards $0.43.
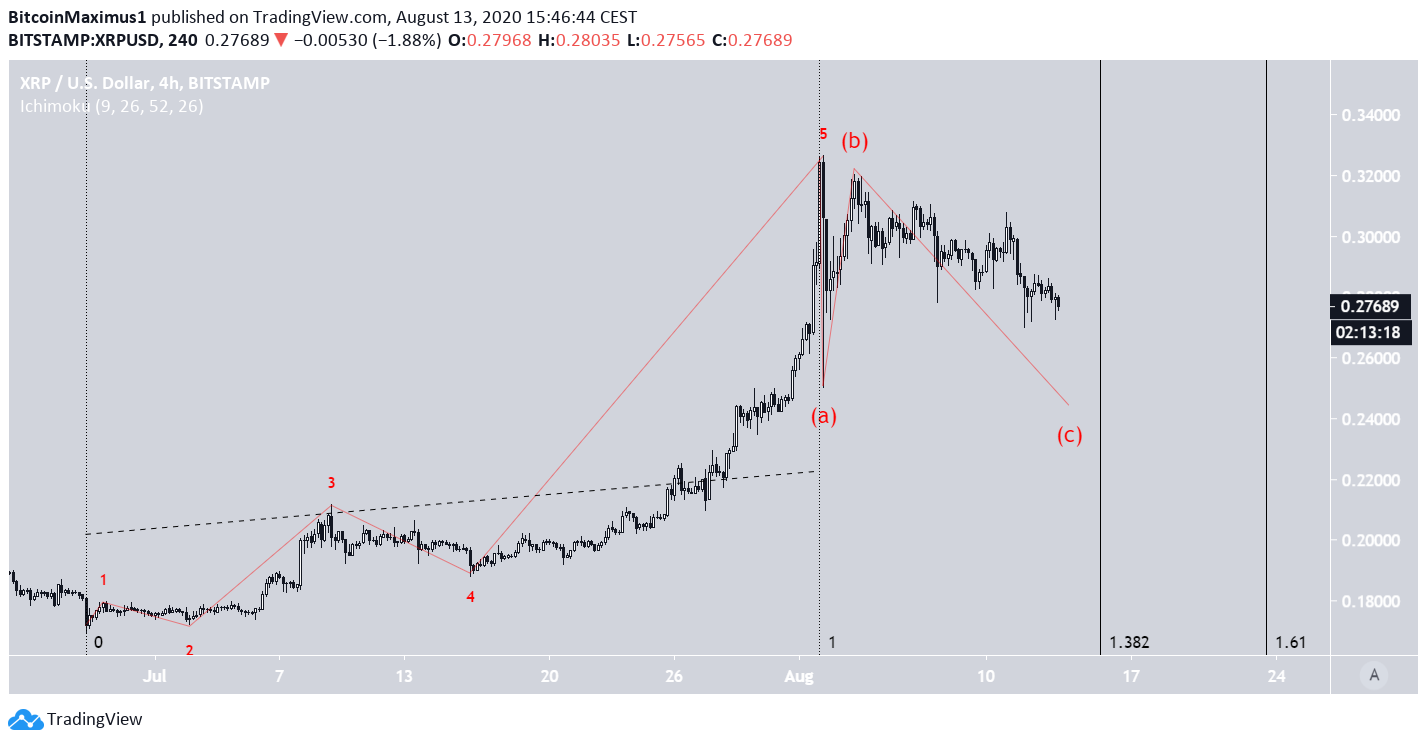
While our wave count is similar, measuring the upward move starting from June 27, it seems that the price has already finished a five-wave formation, based on the sub-wave count.
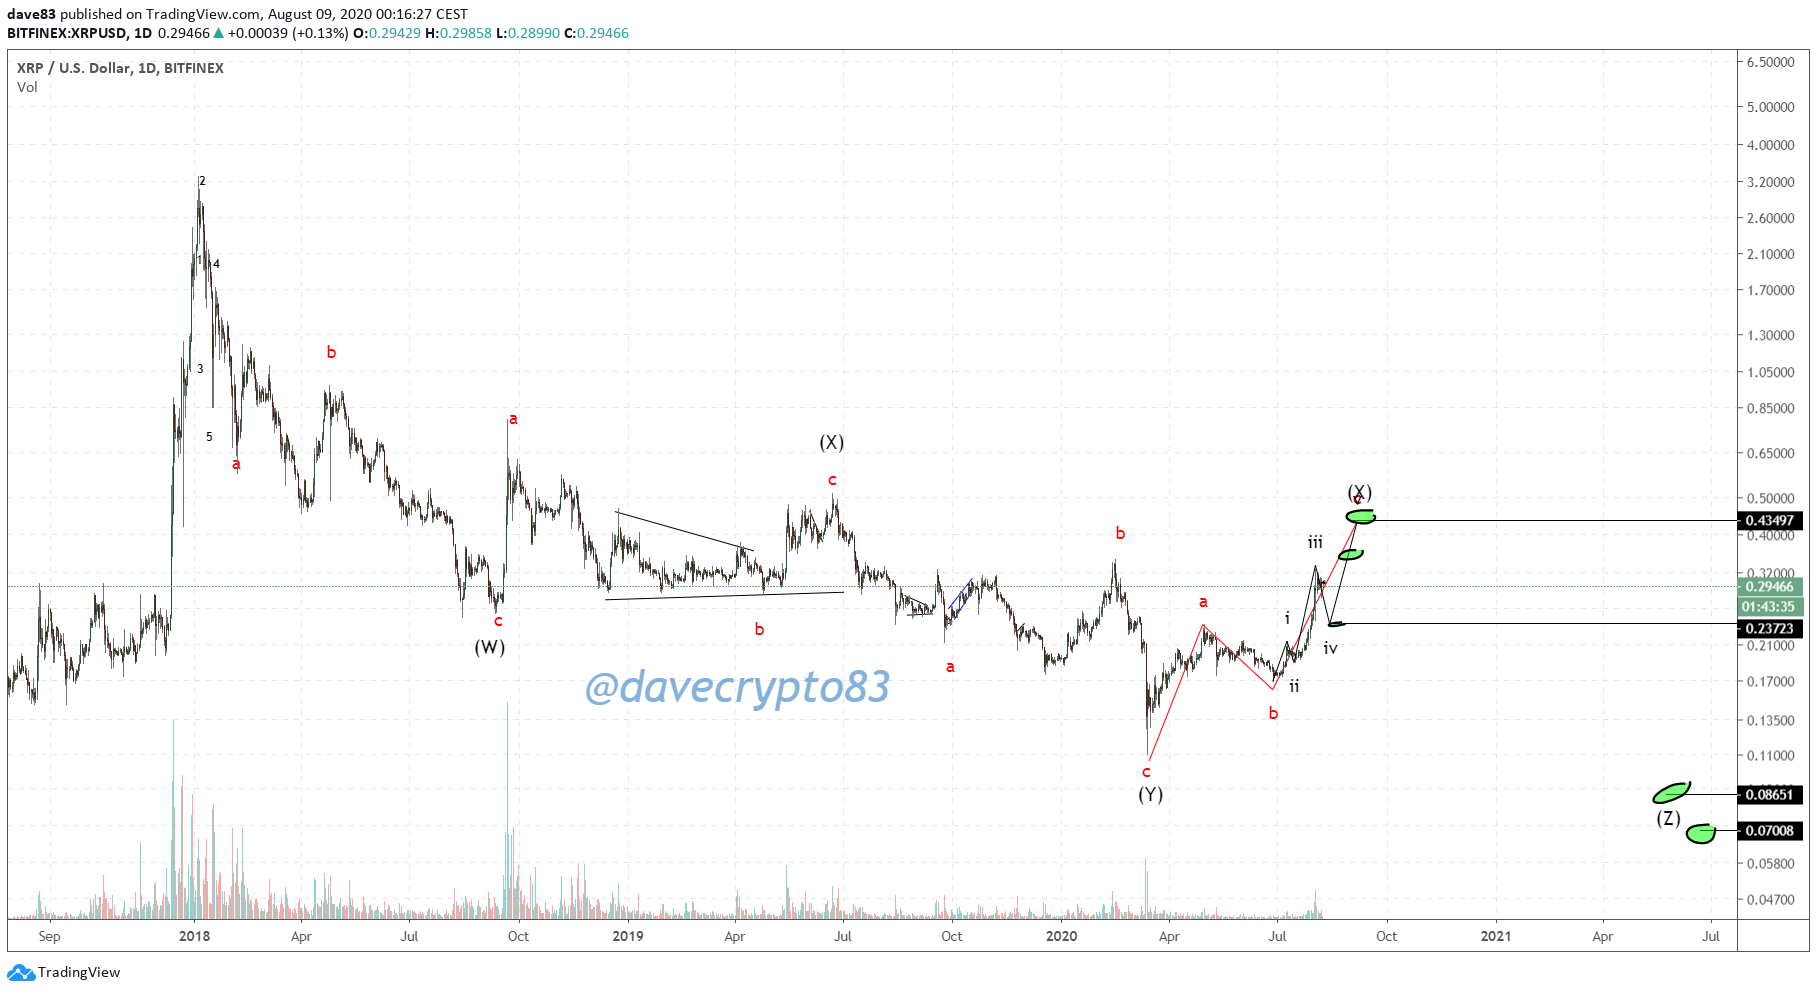
If so, the price is currently in the C wave of an A-B-C correction, which could end near the 0.5 Fib level from the previous section at $0.237.
The correction has yet to reach the 1.382 Fib retracement, so it’s likely not over yet. The price should make a low inside the 15 – 23 August range.
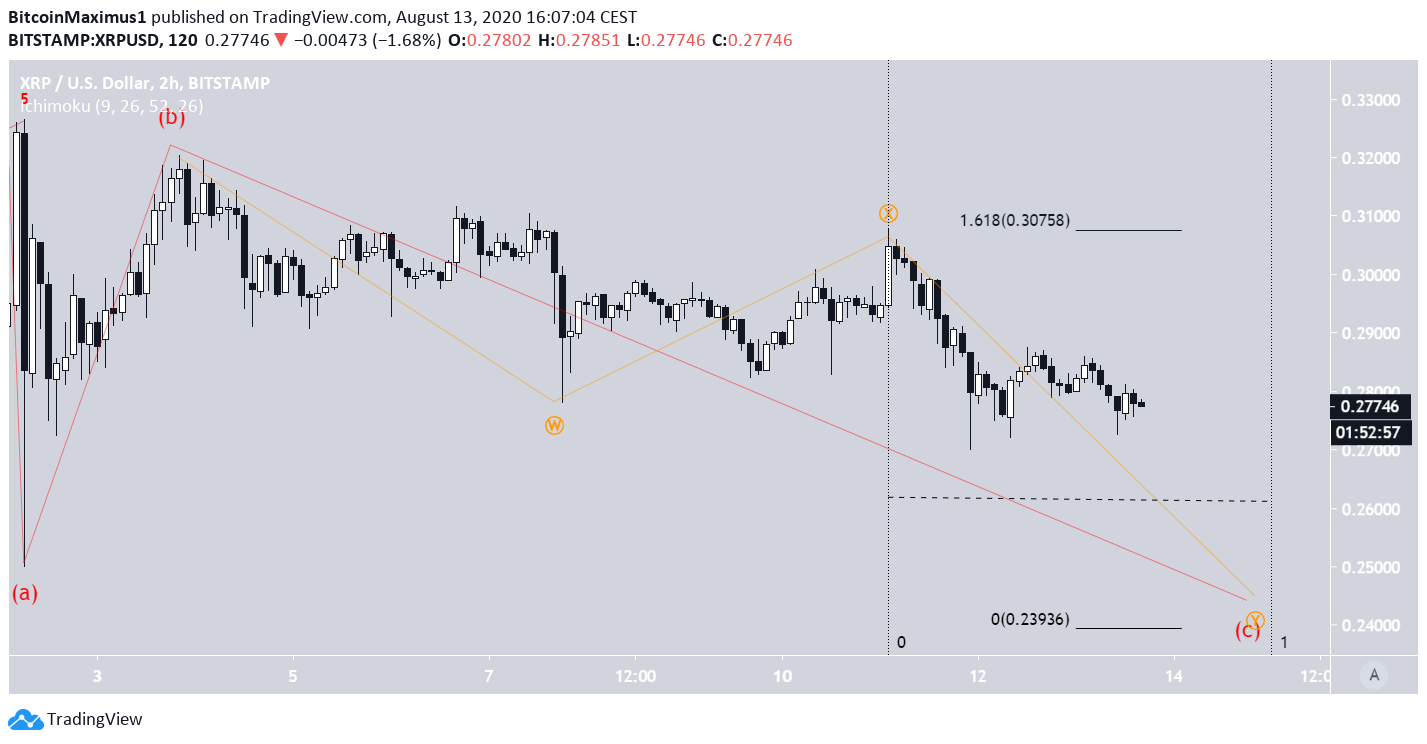
The shorter-term chart shows a possible W-X-Y sub-wave count, which is a complex correction. The Y wave is already longer than the W one, so if it extends to the 1.61 Fib level, the price will reach a bottom of $0.24, fitting with our previous prediction.
In addition, if it takes the same amount of time to complete as the W wave, the price would reach a bottom around August 15.