


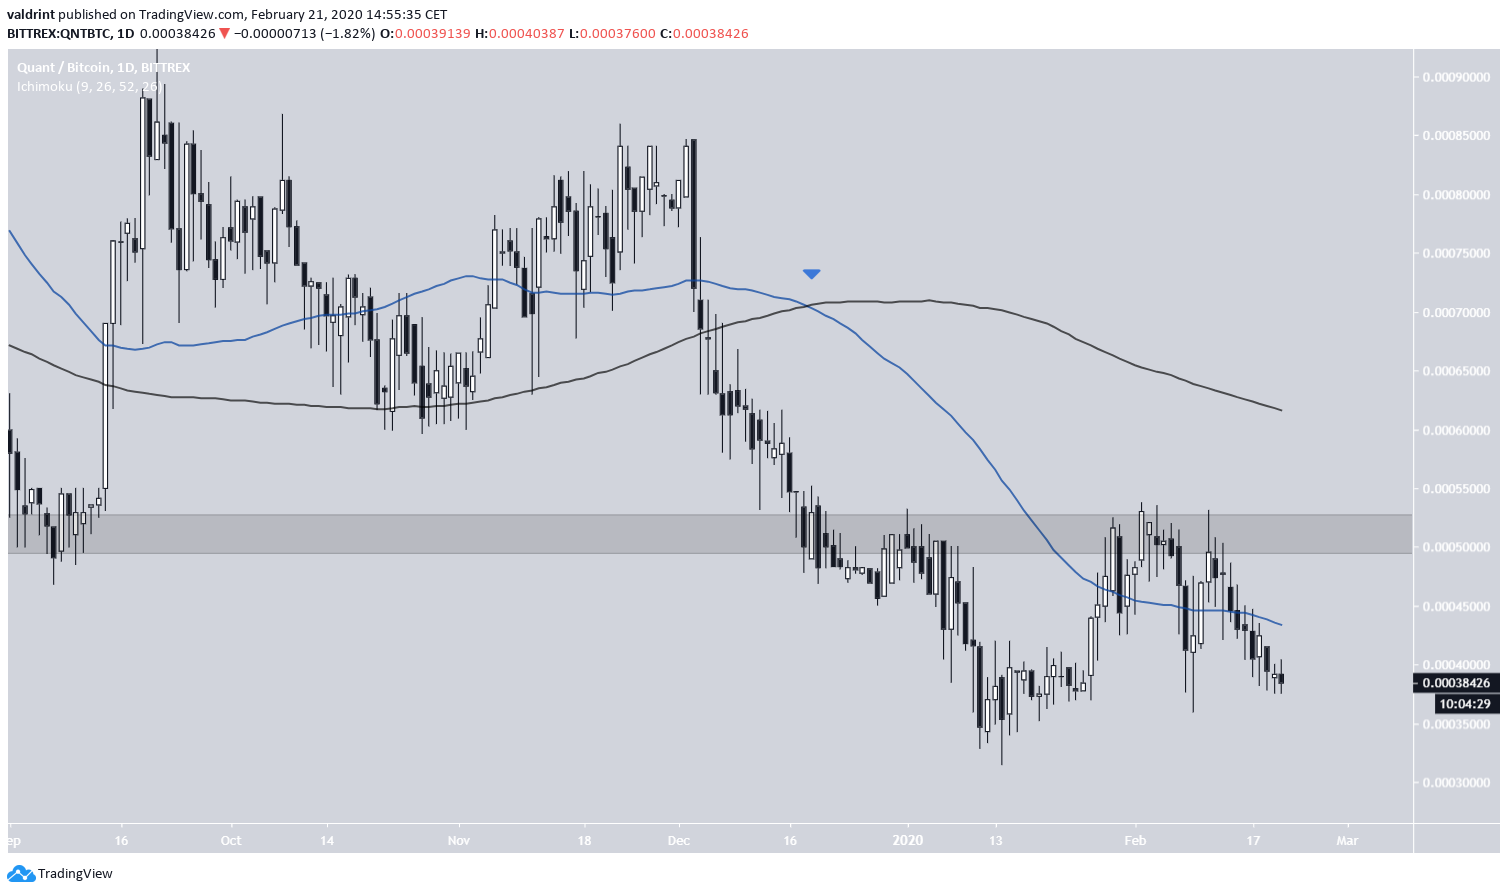
On February 11, the QNT price reached a high of 53,120 satoshis. It has been decreasing since.
Quant (QNT) Highlights
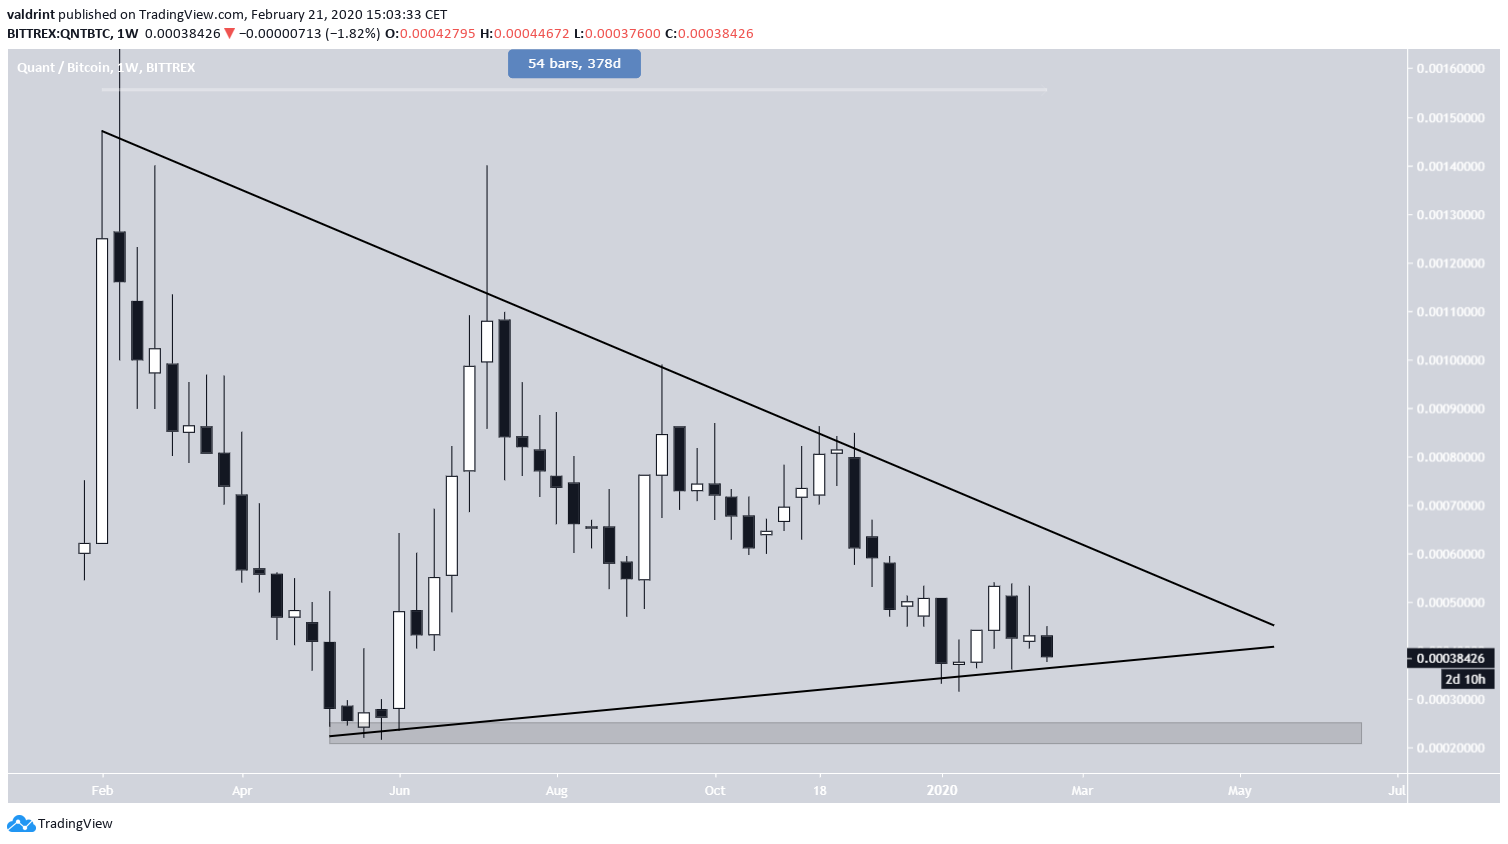
- The QNT price has been following a descending resistance line for the past 378 days.
- There is resistance at 50,000 satoshis.
- A death cross has transpired.
- The price could be trading inside a long-term symmetrical triangle.
Technical analyst @walter_wyckoff outlined a QNT chart that shows that the price is trading below every significant moving average (MA). He proposes to enter the trade at 22,000 satoshis if the price gets there.
$QNT under every possible DMA, I will buy purple level at 22k if it gives pic.twitter.com/YJqXqu71Ub
— Levi Alterman (@levi_alterman) February 20, 2020
Will the price reach the outlined target? If yes, where will it go to afterward? Continue reading below if you are interested in finding out.
Death Cross
The daily chart reveals that the main resistance area is found at 50,000 satoshis. In the period from January 28-February 11, the price made several unsuccessful attempts at breaking out above this area.
In addition, a bearish cross between the 50- and 200-day moving averages (MA), otherwise known as a death cross has transpired on December 19, 2019. This is a bearish development that suggests that the price will continue to move downwards. QNT is facing very close resistance from the 50-day MA.
The weekly chart reveals that the price has been following a descending resistance for 378 days. It is possible that the price is trading inside a long-term symmetrical triangle. However, the ascending support line has not been validated sufficiently to confirm this pattern.
If the price were to decrease below this line, it would likely reach the support area at 22,000 satoshis, as outlined in the tweet.
QNT Future Movement
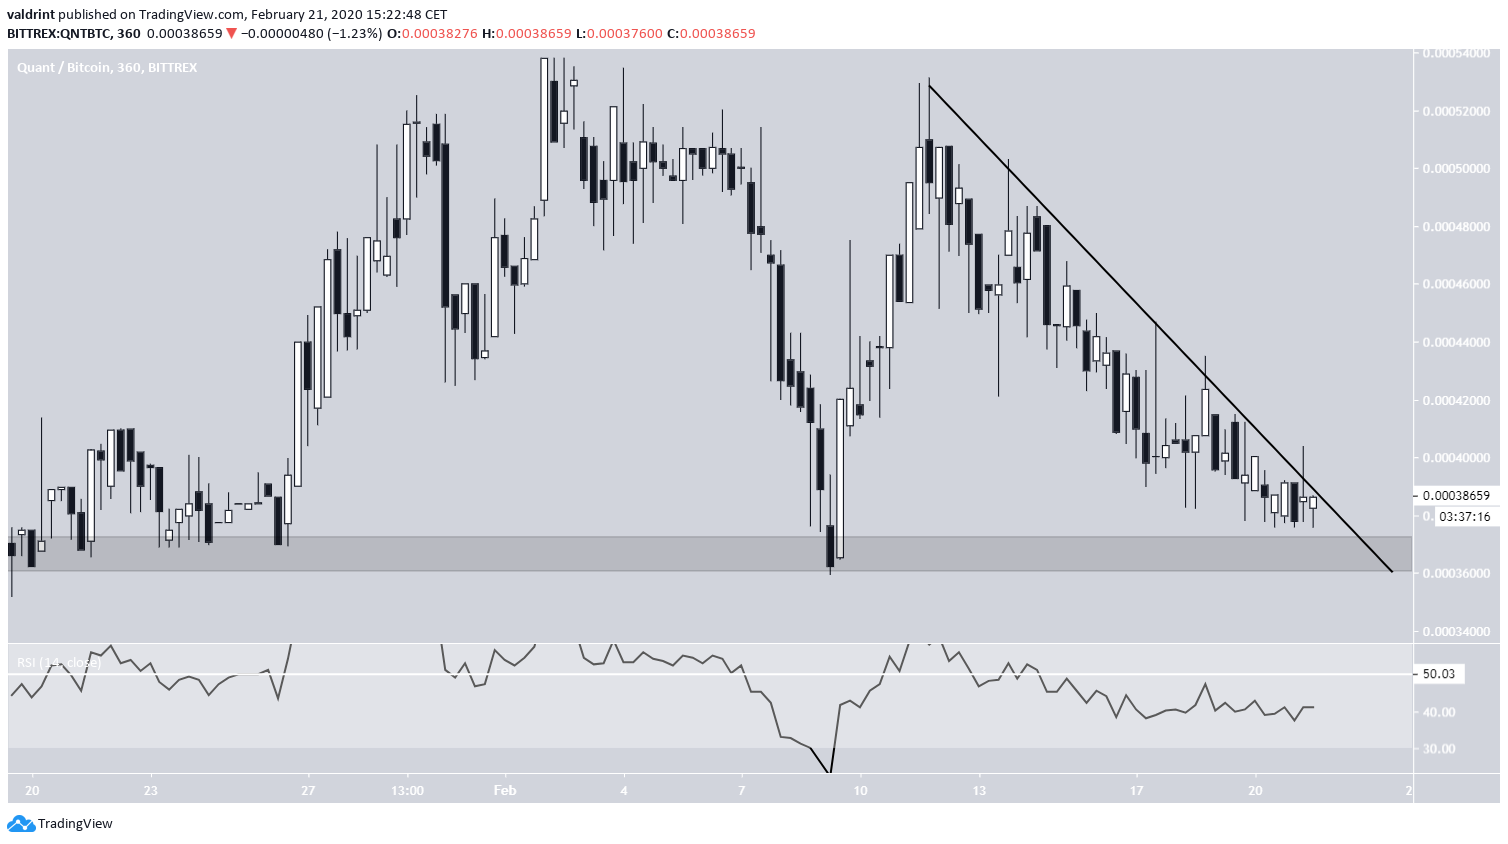
In the short-term, we can see that the price is following a very steep resistance line, out of which it has made numerous unsuccessful attempts at breaking out.
The RSI is below 50 and has not generated any type of bullish divergence to indicate a breakout.
So, unless the price bounces here at 34,000 satoshis, which it has not made any indication of doing so, it is expected to decrease all the way to 22,000 satoshis.
To conclude, the QNT price was rejected by a significant resistance area and has been decreasing since. If the price decreases below the current support area, it is expected to reach 22,000 satoshis. QNT has yet to show any bullish reversal signs.


