
The Cardano (ADA) price has been trading inside a bullish pattern since May 29. Whether it breaks out or down from it will likely determine the direction of the long-term trend.
ADA is the native token of the Cardano blockchain platform, created by Charles Hoskinson. It falls in the category of cryptocurrencies that deal with smart contracts.
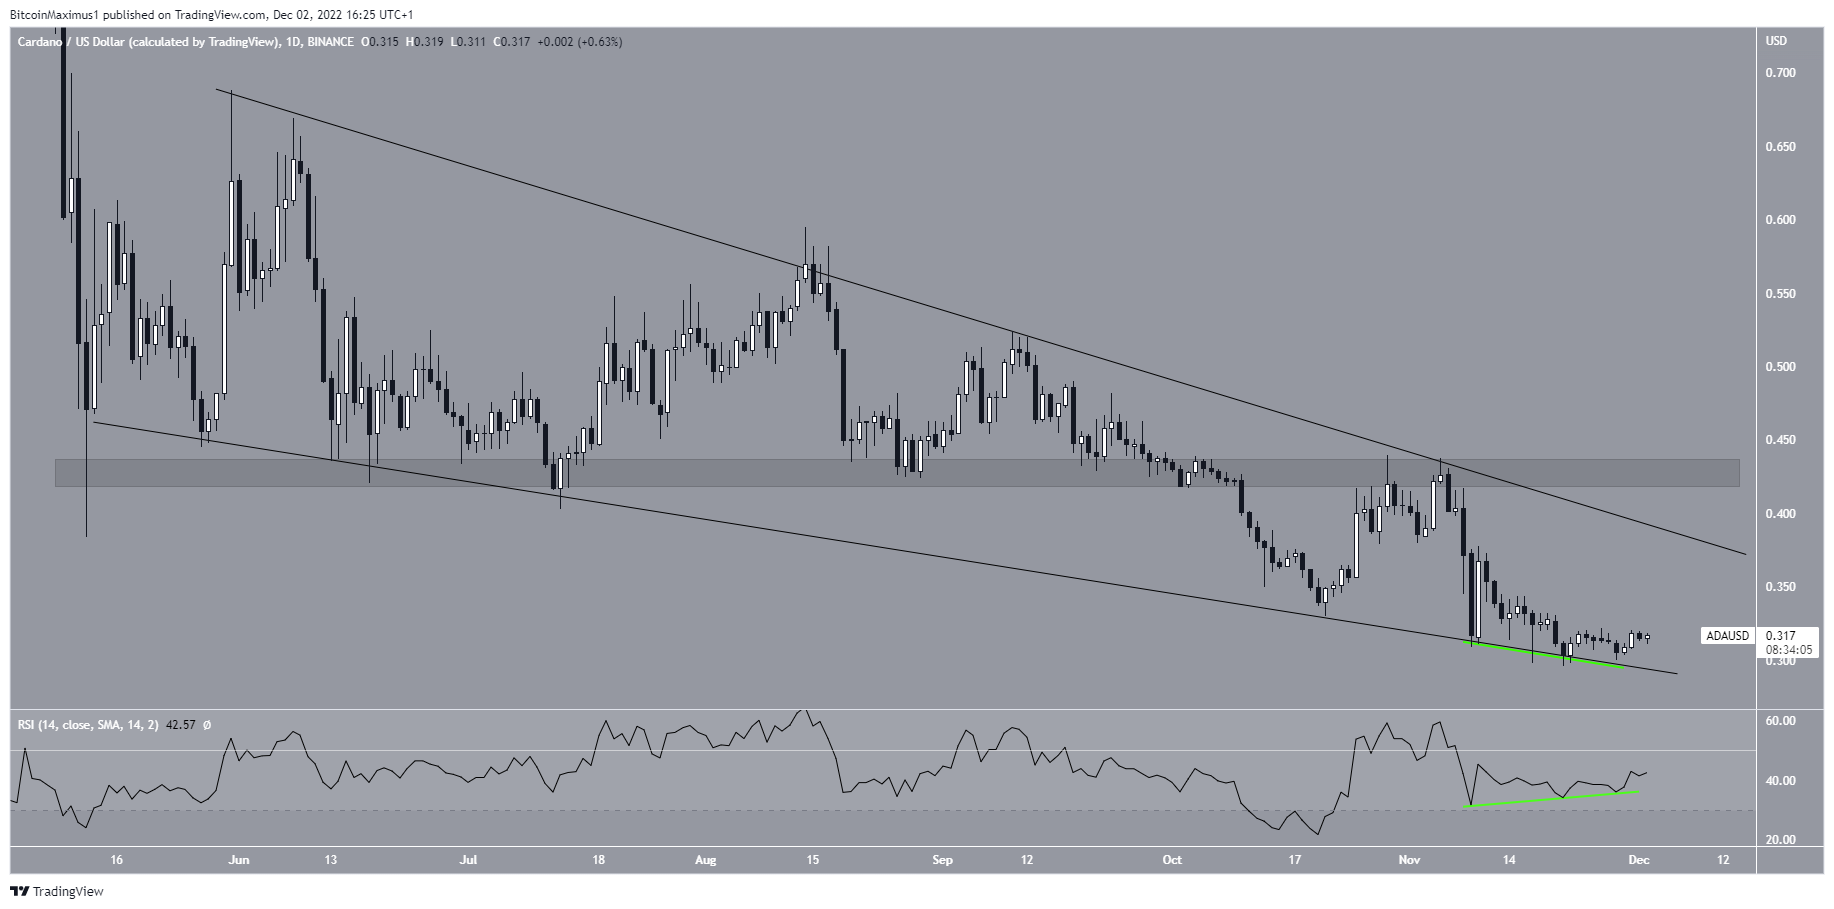
The Cardano (ADA) price has decreased in a long-term descending wedge since May 31. The descending wedge is considered a bullish pattern, meaning that it leads to breakouts the majority of the time.
While decreasing inside the wedge, the ADA price fell to a low of $0.296 on Nov. 21. Between Nov. 8 and 28, the Cardano price validated the support line of the wedge three times while the RSI generated bullish divergence. This is a bullish sign that bodes well for the future price.
A breakout from the wedge would be required for the Cardano price forecast to be bullish. Due to the proximity of the resistance line of the wedge with the $0.420 area would likely lead to a breakout from the latter. In that case, it would suggest that the Cardano price prediction is indeed bullish.
Conversely, a daily close below the support line of the descending wedge would suggest that the trend is bearish instead.
Cardano Price Readies For Short-Term Bounce
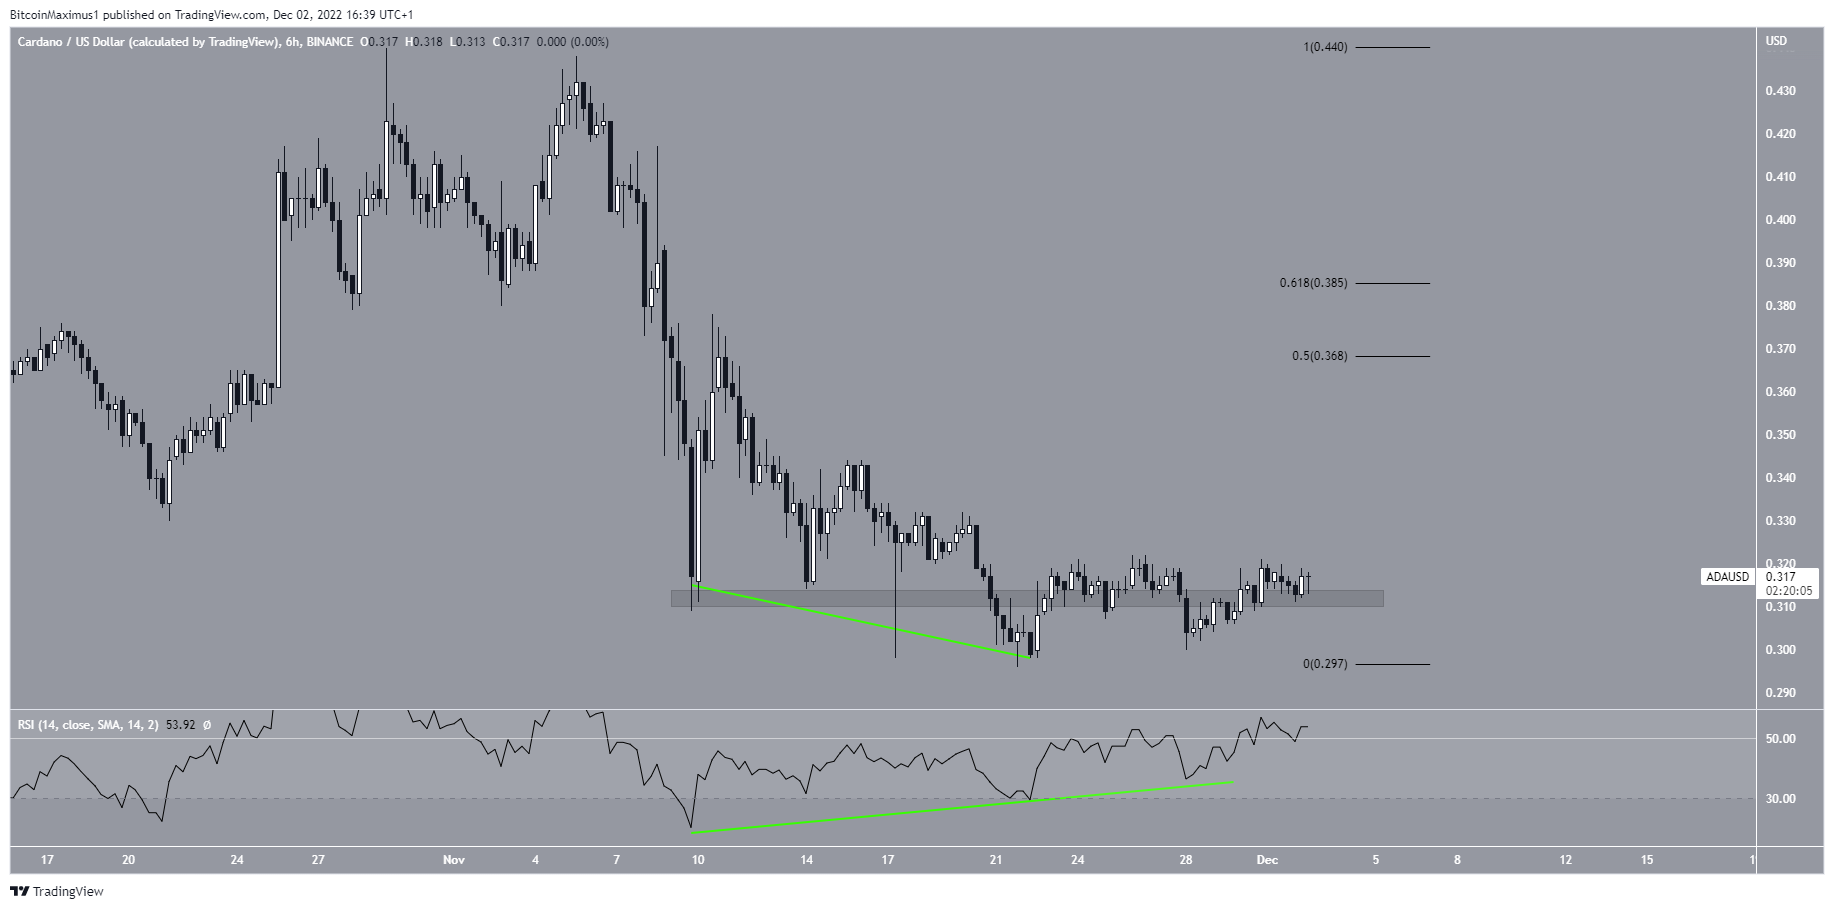
Technical analysis from the six-hour time frame shows that ADA has reclaimed the support area with an average price of $0.31. It bounced off it over the past 24 hours.
Besides the price action, the six-hour RSI is also bullish, since it has generated bullish divergence (green line).
If this leads to an upward movement, the Cardano price could increase towards the 0.5-0.618 Fib retracement resistance levels at $0.368-$0.385.
The reaction once it gets there will determine the short-term Cardano price prediction.
If, however the ADA price closes below the $0.310 area, it would mean that new lows are expected. This could also cause a breakdown from the long-term wedge outlined previously.
For BeInCrypto’s latest crypto market analysis, click here.
Disclaimer: BeInCrypto strives to provide accurate and up-to-date news and information, but it will not be responsible for any missing facts or inaccurate information. You comply and understand that you should use any of this information at your own risk. Cryptocurrencies are highly volatile financial assets, so research and make your own financial decisions.
