Using the long-term Bitcoin chart, he used simple resistance lines to show that, once the Bitcoin price breaches its all-time high, it should explode upwards.It's a general rule of theory that the simplest theory with the least number of complicating factors is the superior one [Occam's razor]. It could just be, along simple TA lines, that price explodes northwards once the previous all time high is hit… pic.twitter.com/9sgtsNACM5
— dave the wave🌊🌓 (@davthewave) December 5, 2019
Previous Bitcoin Cycles
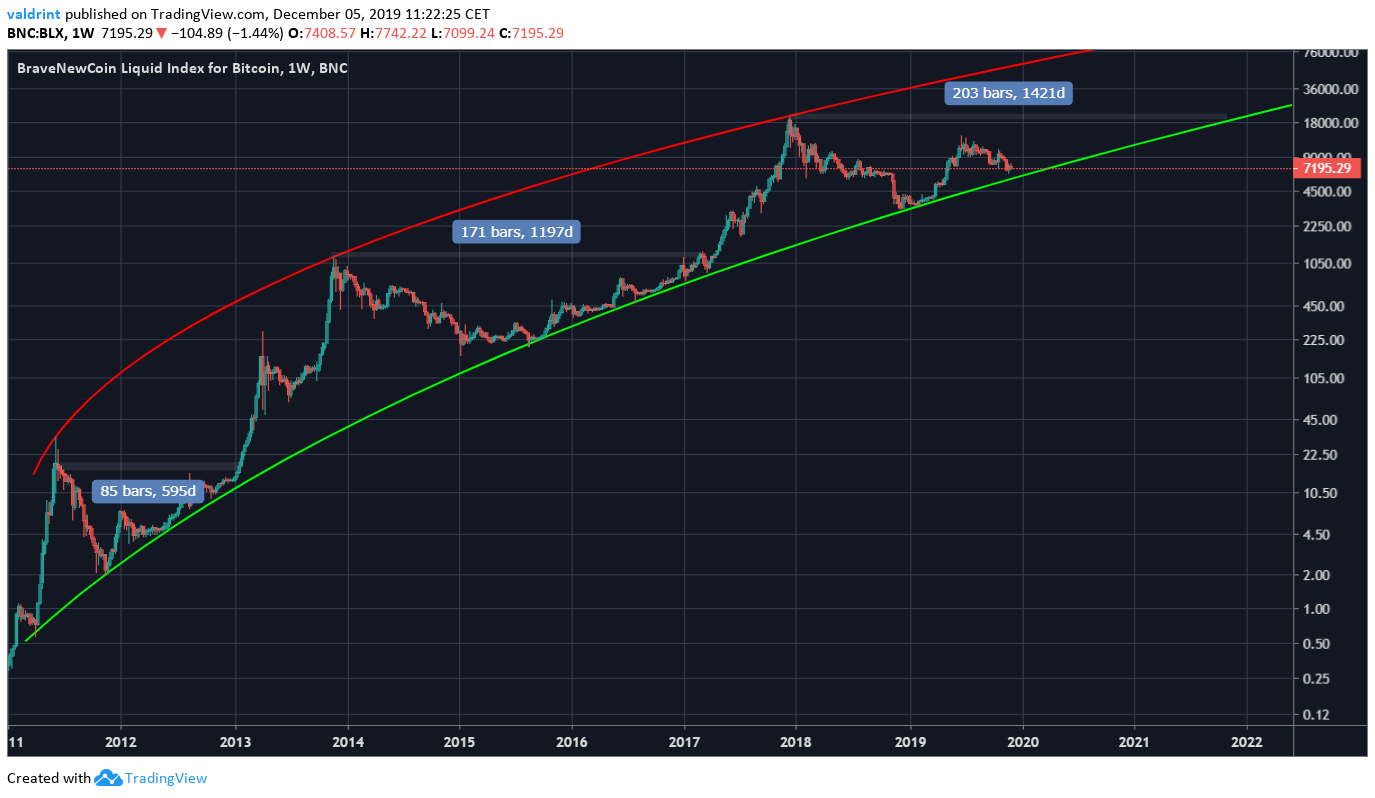
The Bitcoin price initially reached an all-time high (ATH) in November 2011. After a long downtrend, the all-time high was broken after roughly 595 days. The second ATH took much longer to break — more specifically, 1197 days. Since reaching a high of nearly $20,000 in December 2017, the Bitcoin price has not approached those values since. If the price follows the ascending support line that has been in place since 2012, it will do so the latest after 1421 days, in November 2021. To clarify, this does not mean that the all-time high will not be broken earlier. However, due to the fact that the support line is ascending, it will be higher than the all-time high in November 2021 — making it the latest possible date in which we should reach a new ATH.
Movement Ratios
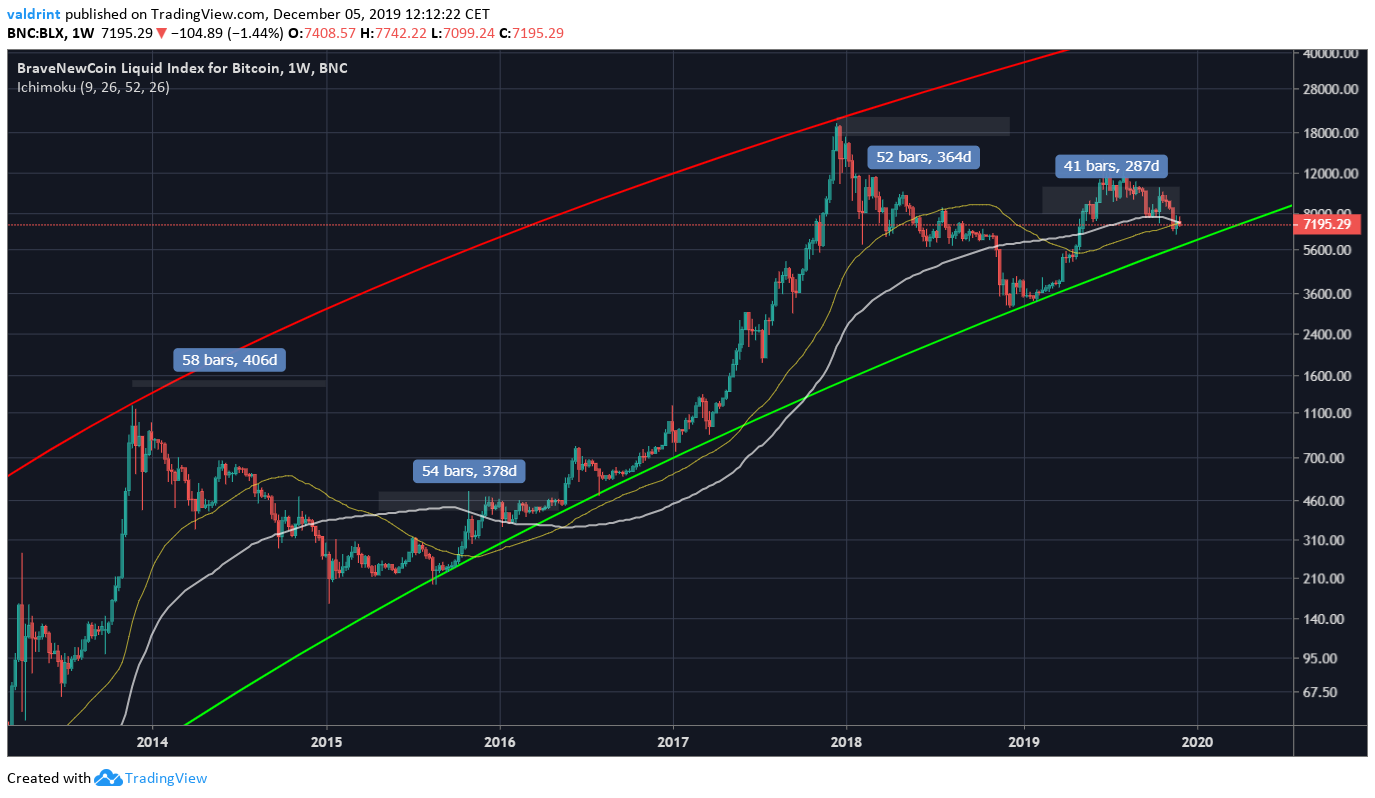
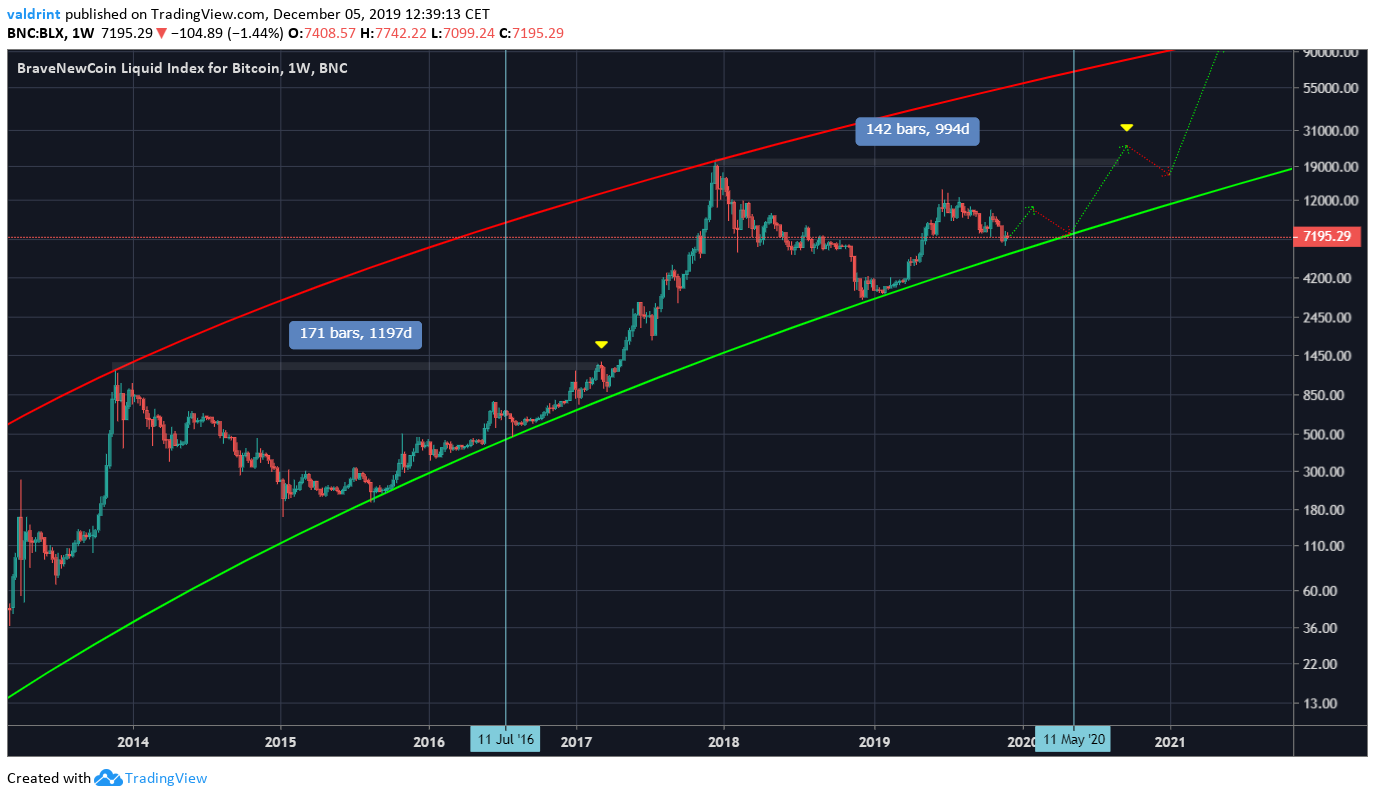
There are several things to consider when looking at the two movements. We will use the 50- and 100-week moving averages (MAs) to make a better comparison. In the correction beginning in 2013, it took the Bitcoin price 406 days to reach a low. A bearish cross followed shortly afterward. After 378 days, the same MAs did a bullish cross — indicating that the upward movement has begun. In the movement beginning in 2017, it took the Bitcoin price 364 days to reach a low. A bearish cross followed shortly afterward. After 287 days, the same MAs created a bullish cross. Dividing the numbers gives us a ratio of 1.2, meaning the movement after the 2013 high is 1.2 times slower than the one after the 2017 high. Therefore, using this ratio allows us to make the prediction that a new ATH will be reached after 994 days in August 2020. This also fits with the halving angle (vertical lines). The Bitcoin price usually increases in anticipation of halving and the rate of increase accelerates afterward.
 To conclude, long-term Bitcoin MAs and their relationship to prior cycles suggest that the price will reach a new all-time high in August 2020.
Disclaimer: This article is not trading advice and should not be construed as such. Always consult a trained financial professional before investing in cryptocurrencies, as the market is particularly volatile.
Disclaimer
In line with the Trust Project guidelines, this price analysis article is for informational purposes only and should not be considered financial or investment advice. BeInCrypto is committed to accurate, unbiased reporting, but market conditions are subject to change without notice. Always conduct your own research and consult with a professional before making any financial decisions. Please note that our Terms and Conditions, Privacy Policy, and Disclaimers have been updated.


![When Will Bitcoin Reach a New All-Time High? [Premium Analysis]](https://beincrypto.com/wp-content/uploads/2019/07/bic_BTC_hashrate-1.jpg.optimal.jpg)
