


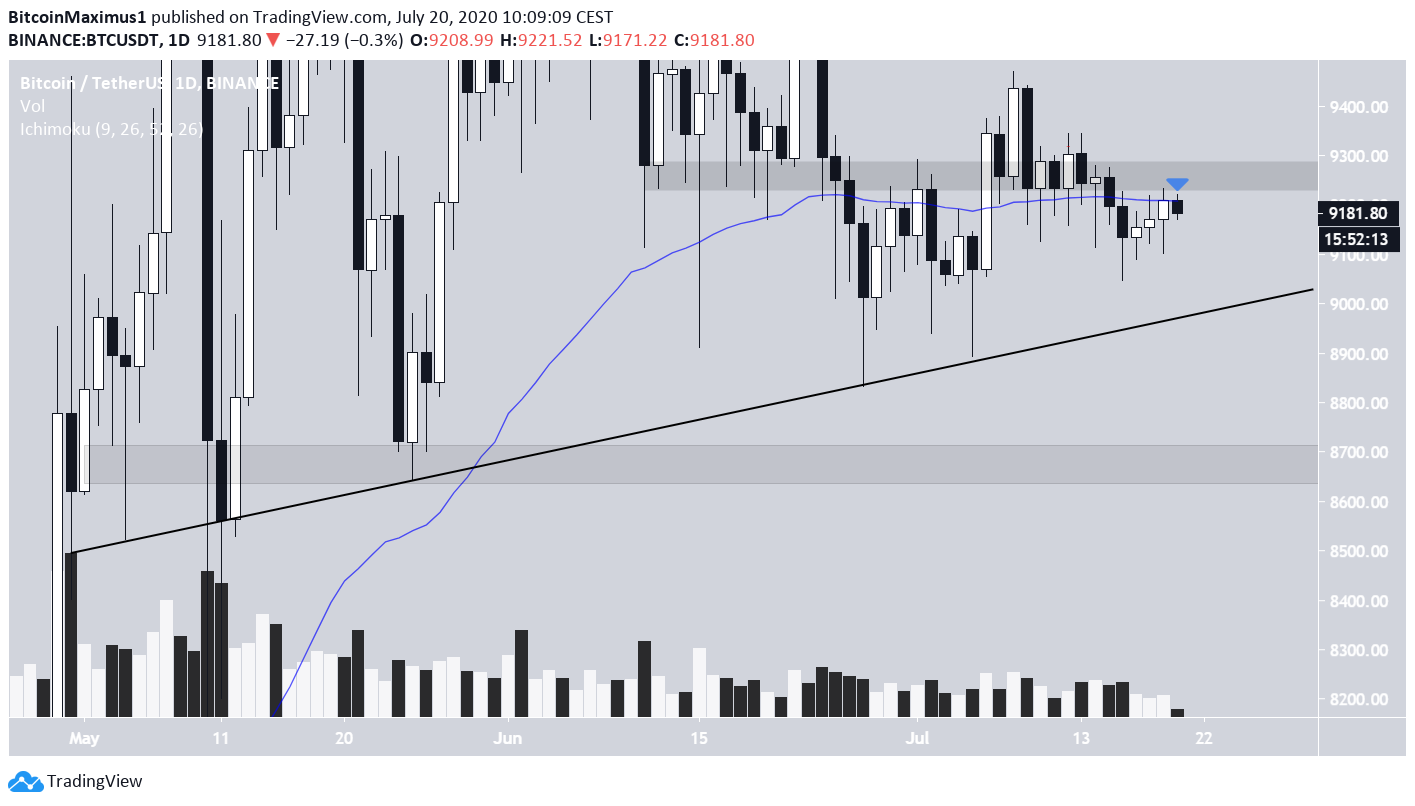
On July 15, the Bitcoin (BTC) price fell below an important moving average (MA) and $9,250 level, which has previously acted as both support and resistance.
The price managed to slow the bleeding and even made another attempt at moving upwards. However, it has yet to reclaim either the MA or the previous support area.
Bitcoin Treads Dangerous Waters
The Bitcoin price is trading below the 50-day MA and the $9,250 level. As long as this is the case, the bias is considered bearish. This is also evident by the fact that the price has been making lower highs since breaking over $10,000 at the beginning of June.
However, BTC is possibly following an ascending support line since the beginning of May. Although its slope is not entirely clear due to numerous long wicks, the line is estimated to offer support around $8,950.
If the price breaks down from this line, the next closest support level is found between $8,600 and $8,700.
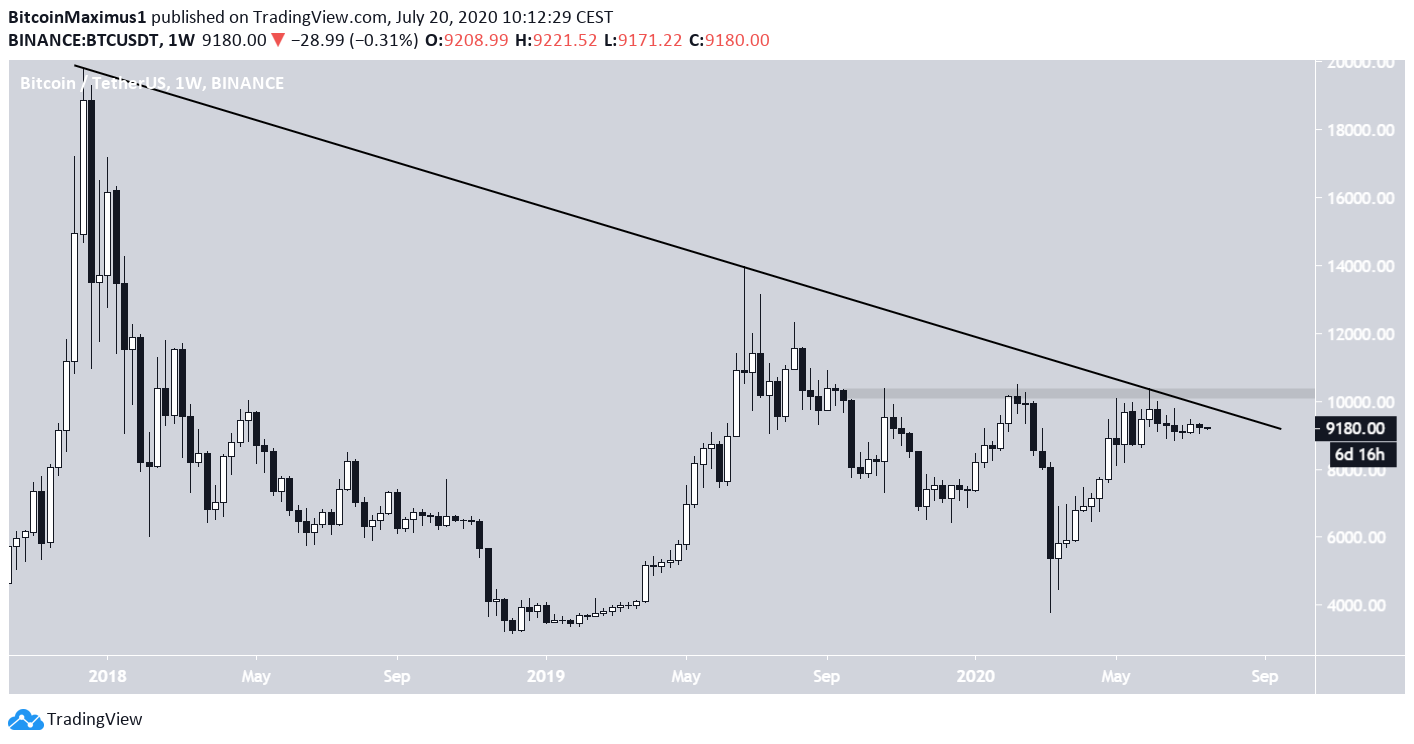
The weekly chart also shows that BTC has also been following a descending resistance line beginning from its all-time high in December 2017, and is currently trading slightly below it. As long as the price is closing below this resistance, the long-term trend is considered bearish.
Short-Term Movement
The two-hour chart shows that BTC is possibly trading inside a descending wedge, and has been doing so since reaching a local high on July 9. At the time of writing, the price was trading right on the resistance line of this wedge.
The current price has fallen under the 200-hour MA and the $9,180 horizontal area, which has intermittently acted as support and resistance over the past week. Furthermore, the descending resistance line and 200-hour MA are almost intersecting.
A breakout from the wedge would likely mean that the price will be able to reclaim the $9,250 area. On the other hand, a decrease from the aforementioned support area could take the price towards the support line of the wedge, which also coincides with the previously mentioned long-term ascending support line.
Therefore, it would be more likely for BTC to be rejected at the current resistance and decrease towards support before making another breakout attempt.
To conclude, the Bitcoin price is trading below an important resistance area and moving average. After a short-term decrease, BTC is expected to make another attempt at reclaiming them.
For our previous analysis, click here.


