
Ethereum (ETH) reached a new all-time high price on April 2, but has been decreasing since.
ETH is expected to validate the current horizontal area as support. Afterwards, a significant upward movement is likely.
New All-Time High For ETH
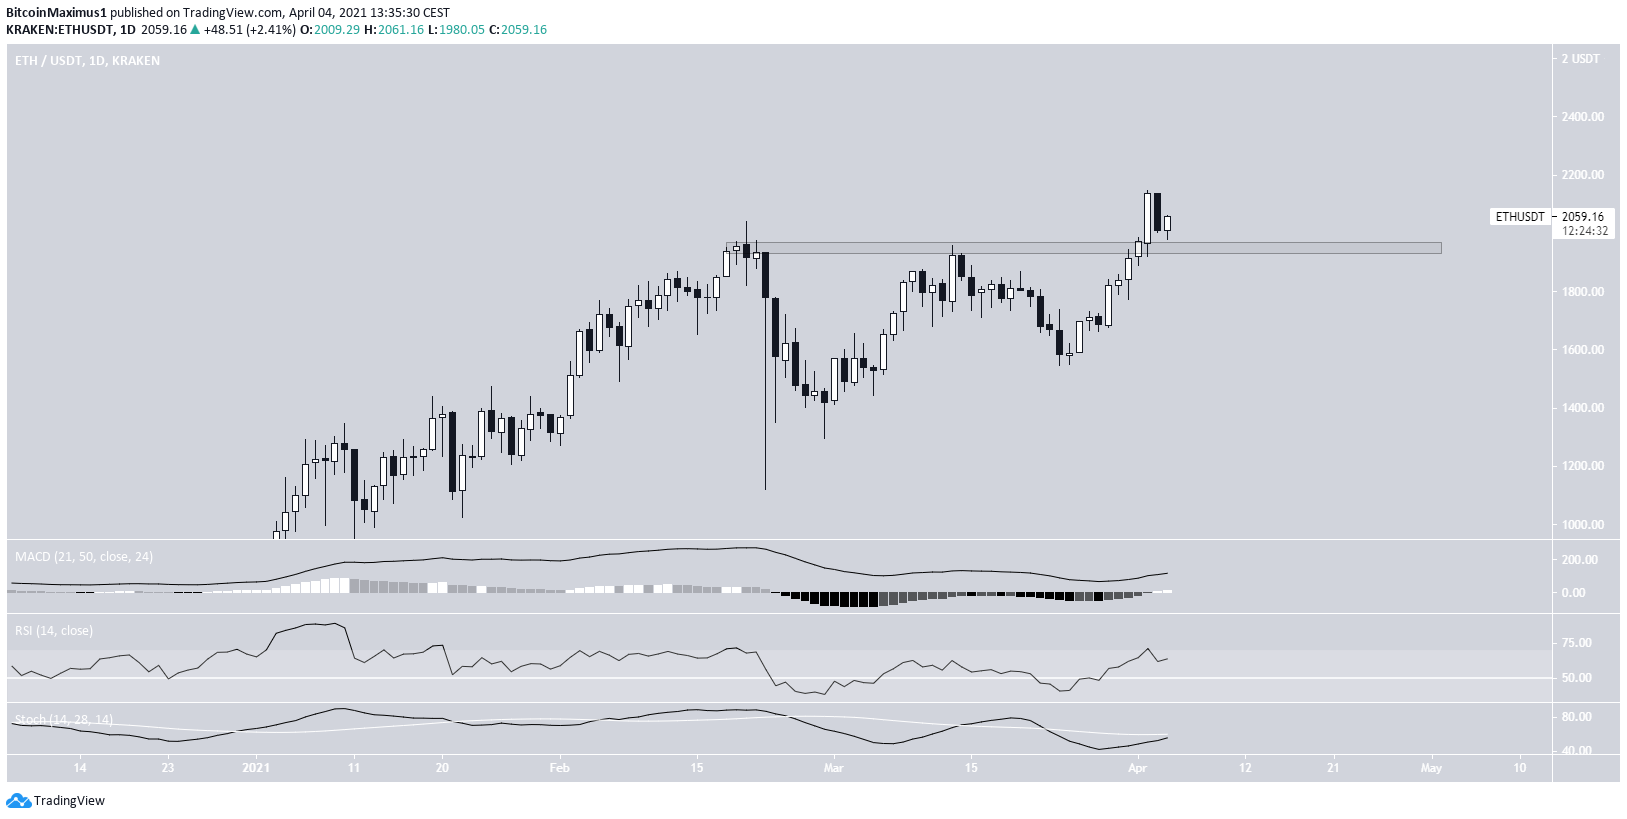
ETH has been moving upwards since Feb. 22. It made an attempt at reaching a new all-time high (ATH), but was rejected on March 13.
However, the next attempt was successful, and ETH reached a new all-time high price of $2,145 on April 2.
Currently, it is in the process of re-testing the previous ATH and validating it as support.
Technical indicators are bullish. Both the RSI & MACD are positive and increasing. While the Stochastic oscillator has yet to make a bullish cross, it is very close to doing so. This would further confirm that the trend is bullish.
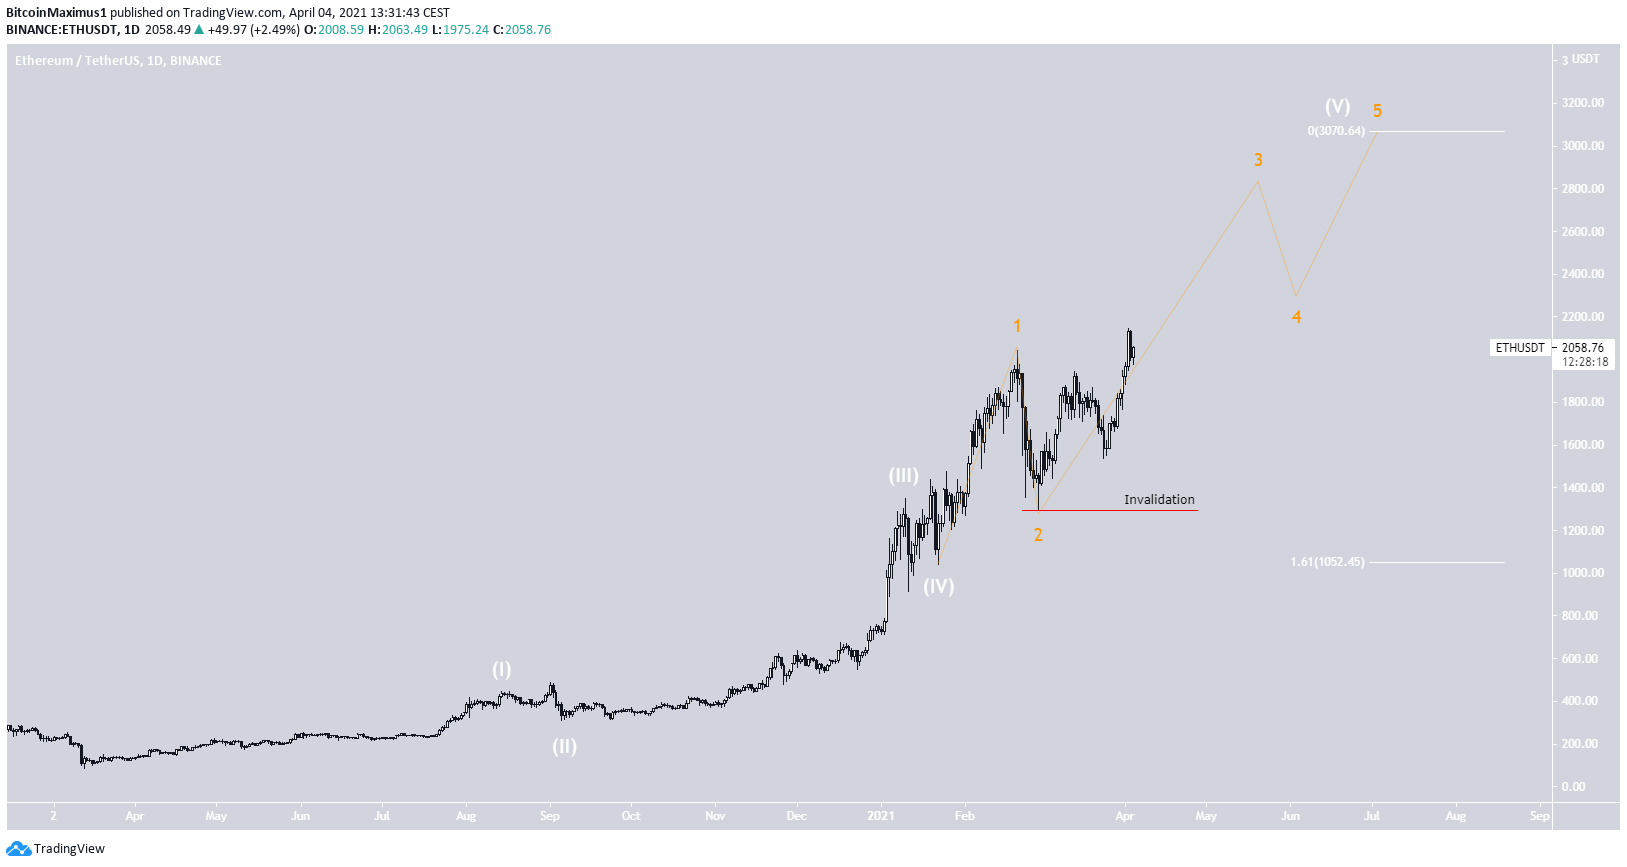
The wave count suggests that ETH is in a long-term wave five (white) of a bullish impulse that began in March 2020.
It has potentially completed sub-waves 1 and 2 (orange). If so, it has now begun sub-wave three. A decrease below the sub-wave two low (red line) at $1,295 would invalidate this particular count.
A potential target for the top of this movement is given at $3,000. This is found by using a fib projection on waves 1-3.
ETH/BTC
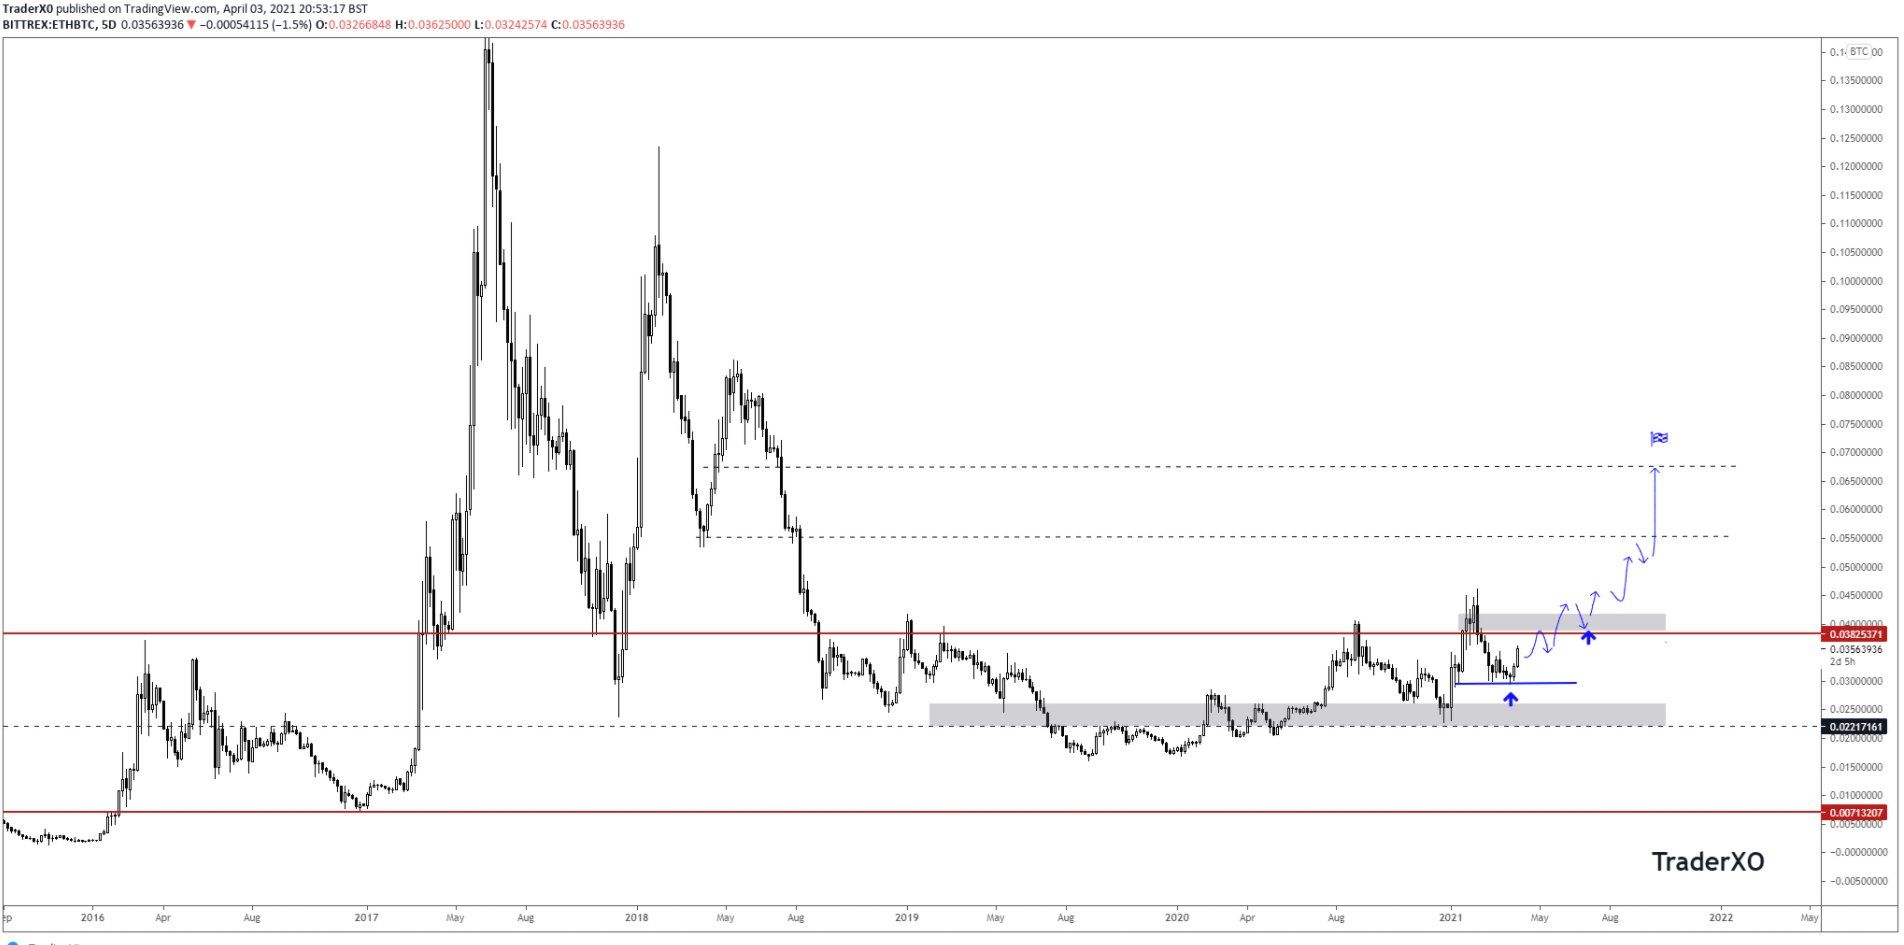
Cryptocurrency trader @Trader_X0 outlined an ETH/BTC chart, stating that higher time-frames look bullish. He expects an upward movement towards ₿0.065-₿0.075.
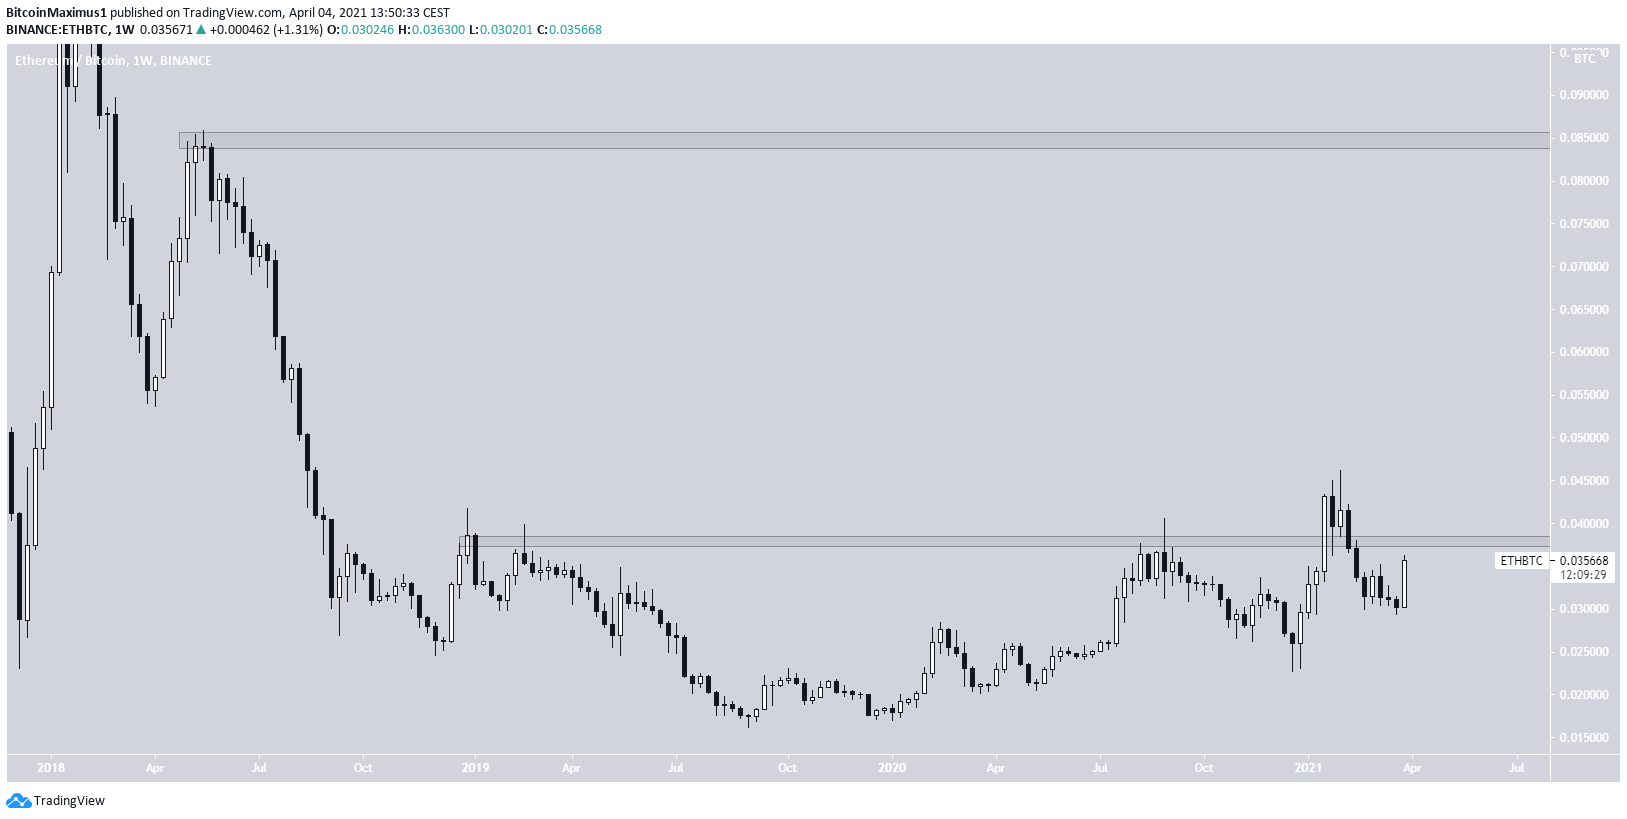
The weekly chart shows that despite the current increase, the token is still trading below the ₿0.038 resistance area. With the exception of a slight deviation in February, the resistance area has been in place since late 2018.
A breakout above this level could trigger a significant upward movement towards ₿0.085, as outlined in the tweet.
Nevertheless, until the area is reclaimed, we cannot consider the trend bullish.
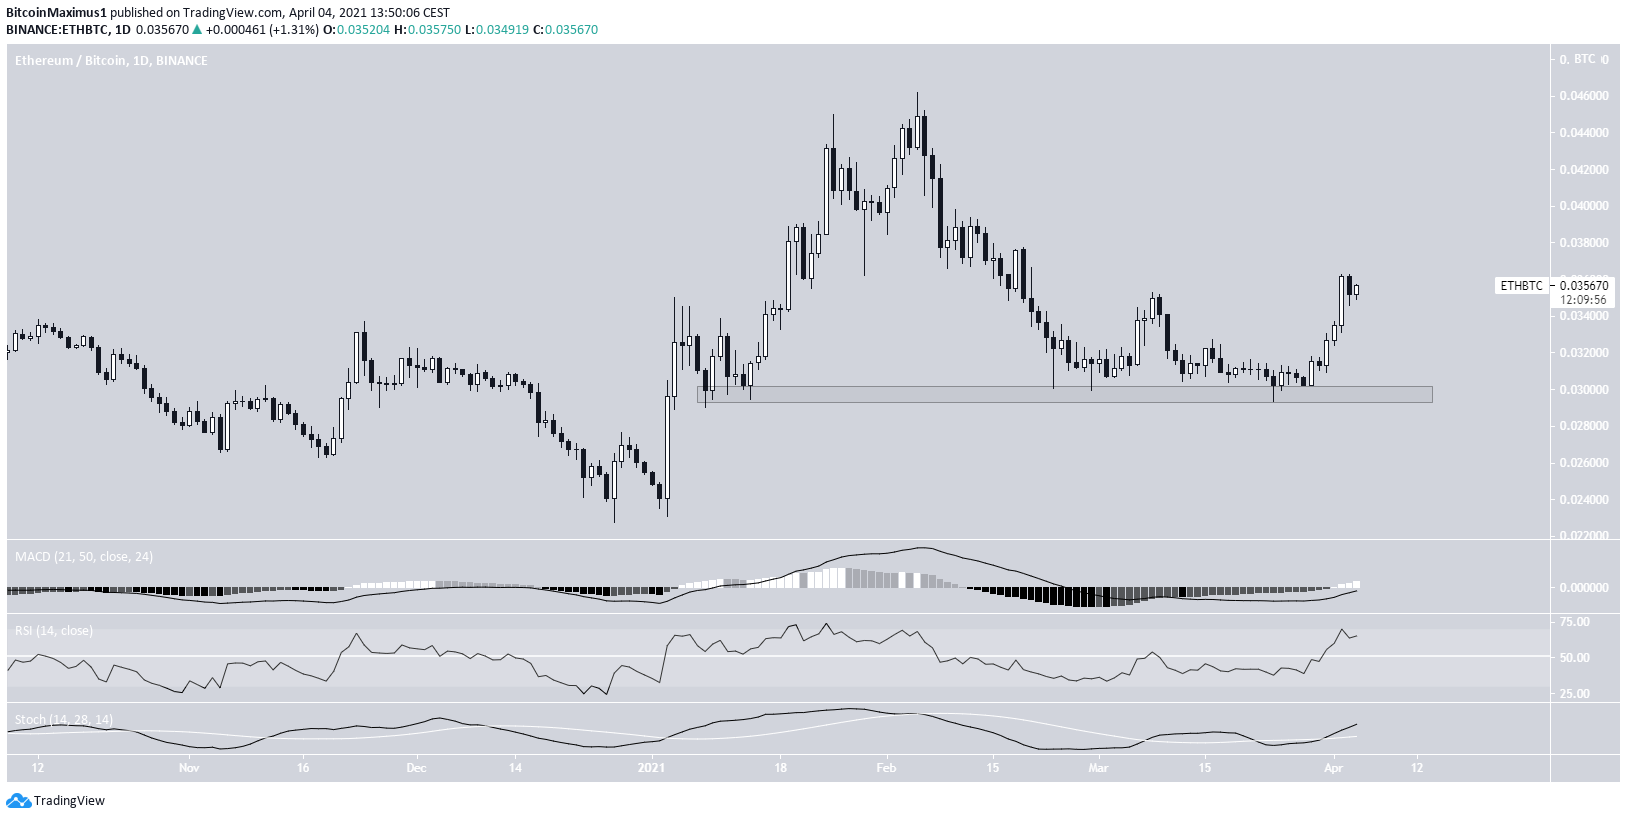
The daily chart provides a more bullish outlook.
The token has bounced at the ₿0.03 area and has been moving upwards.
Similar to the USD counterpart, technical indicators are bullish.
Therefore, ETH/BTC is expected to eventually break out above the long-term ₿0.038 resistance.
Conclusion
To conclude, ETH/USD is expected to increase towards a new all-time high. A potential target for the top of the movement is found at $3,000.
While ETH/BTC is showing bullish reversal signs, the long-term trend cannot be considered bullish until the ₿0.038 area is reclaimed.
For BeInCrypto’s latest bitcoin (BTC) analysis, click here.
