
On March 13, the BTC price reached a low of $3,850. While this initially seemed to cause a breakdown below numerous support levels, the price immediately began an upward move and proceeded to reach a monthly close above $6,000. This leaves the door open for the possibility of bullish continuation.
However, the possible increase is likely to take some time to transpire. Cryptocurrency trader and analyst @davthewave stated that the BTC price is likely to consolidate for the rest of the year before it finally breaks out and moves back into five digits.
May be looking at consolidation within the triangle formed for the rest of the year before a sustainable move higher… pic.twitter.com/U90wuzSpi6
— dave the wave🌊🌓 (@davthewave) April 2, 2020
Long-Term Movement
In order to make the prediction, the assumption is made that the March 2020 low marks the same point in the current market cycle as the January 2015 low did for the previous one. We have made the same claim previously and used it to predict the price on a future date.
We have outlined the two bottoms in the chart below, marked by the black arrows:
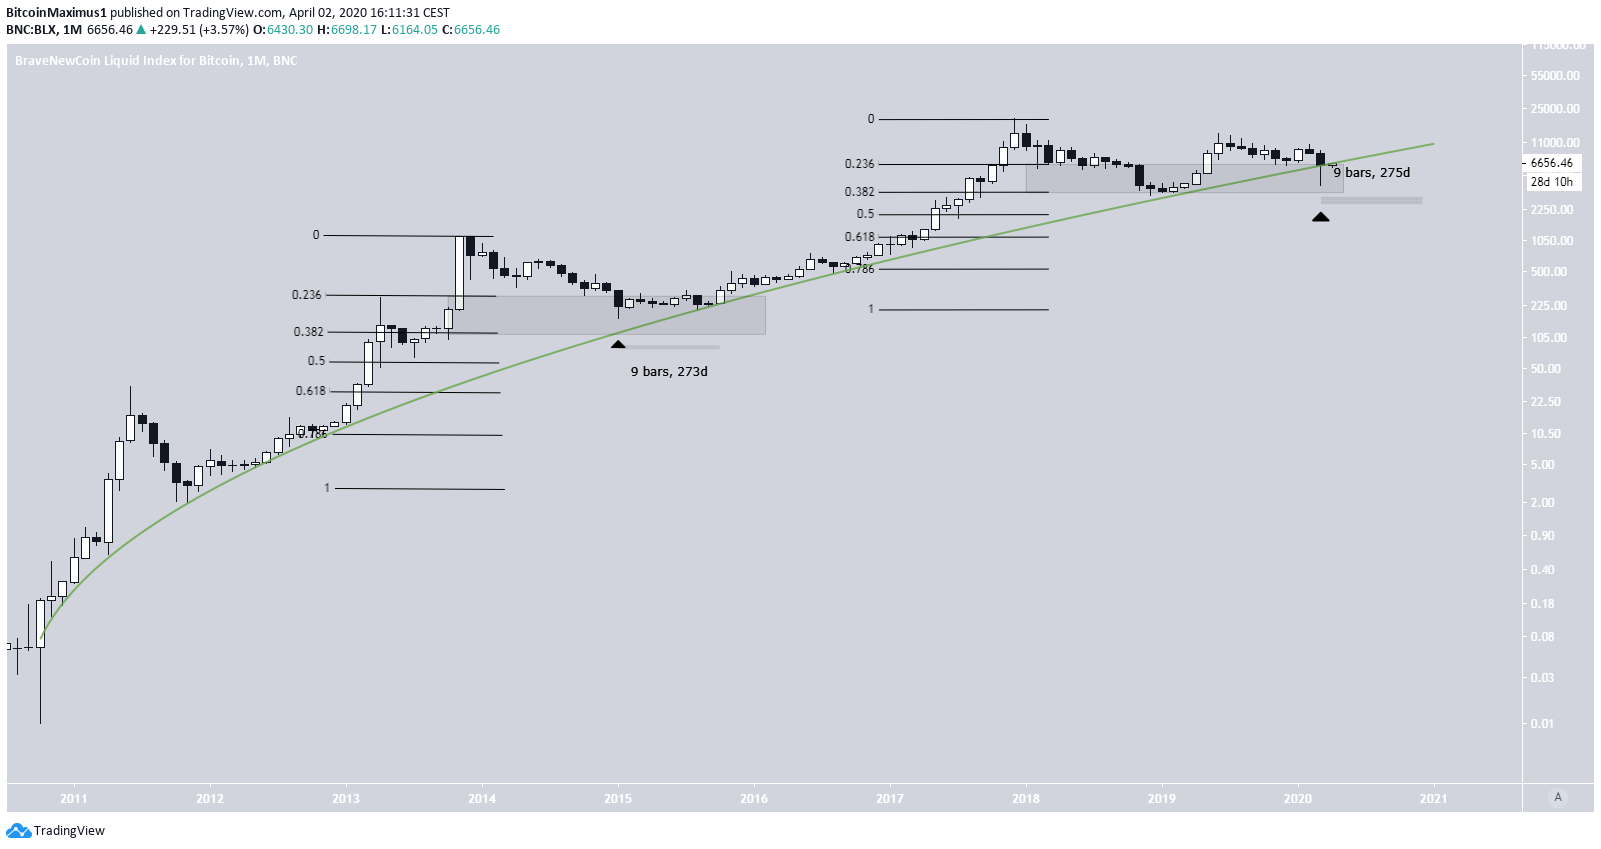
Using this chart, there are two main similarities between these two lows:
- It falls between the 0.236-0.382 fib levels of the entire previous move
- It is very close to the curved ascending support line.
While in the March 2020 bottom the price decreased considerably below this line, it proceeded to close slightly above it. After the January 2015 bottom, the price consolidated for 273 days before accelerating its rate of increase.
If the same thing transpires this time, the price will consolidate until the end of the year. However, due to the fact that the support line is ascending, the price will likely be around $10,000 at the time.
Trading Range
Another well-known trader, @Sawcruhteez, has a similar opinion, and he believes that a continued consolidation would be quite bullish for the future of the BTC price movement. He has also outlined a possible range in which the price will be trading for the rest of the year.
If $BTC ranges over the next few months it would be extremely bullish. 🚀 pic.twitter.com/G95KyFVthD
— The Weatherman (@Sawcruhteez) April 1, 2020
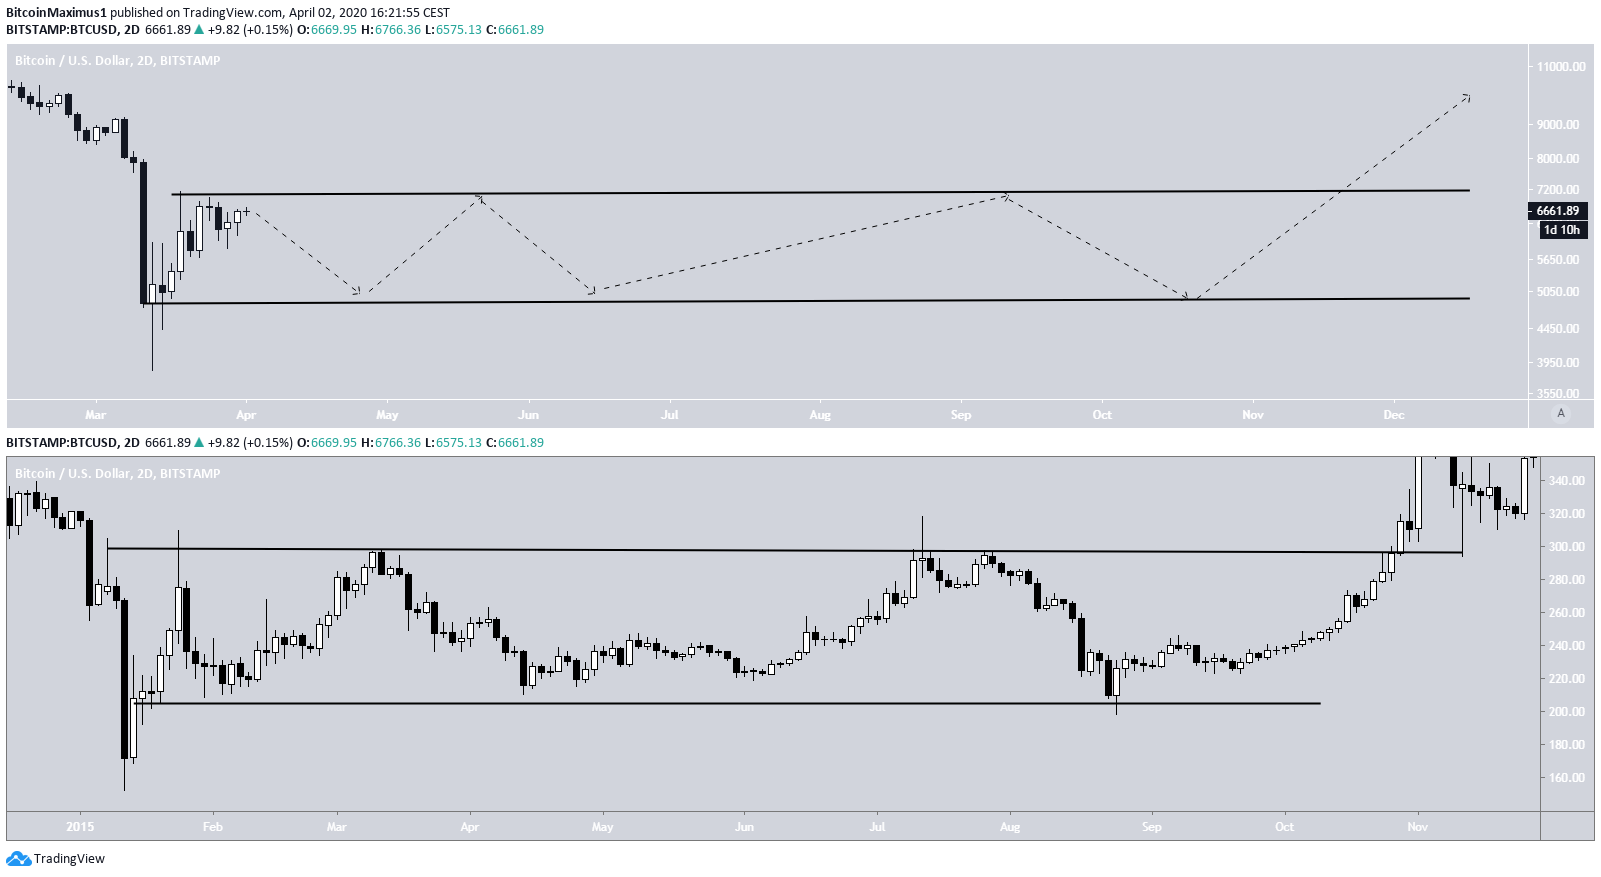
The movement inside the range likely comes from the bottom that we discussed in the section above.
In the image below, we have placed the two bottoms side by side to show the outlined movement if the price acts in the same way as it did in 2015. The price is expected to reach the resistance line in May and September and the support line in June and October, before breaking out in December.
To conclude, the March 2020 bottom shares numerous similarities to that reached in January 2015. If the movement afterward is also similar, the BTC price will consolidate/increase gradually until the end of the year, before breaking out and accelerating its rate of increase.
