
The Dogecoin (DOGE) price trades in a long-term corrective pattern and a short-term bearish one.
DOGE has returned to a horizontal support area that has existed since the start of the year. Will it bounce or break down?
Dogecoin Falls After Rejection
The technical analysis of the daily time frame shows that the DOGE price has fallen since reaching a high of $0.107 on December 11, 2023. The downward movement caused a decrease inside an ascending parallel channel that had existed since June 2023.
While Dogecoin bounced at the pattern’s midline, it was rejected by the resistance trend line twice (red icons) on January 11 and 21, 2024, respectively. DOGE now trades close to the channel’s midline again.
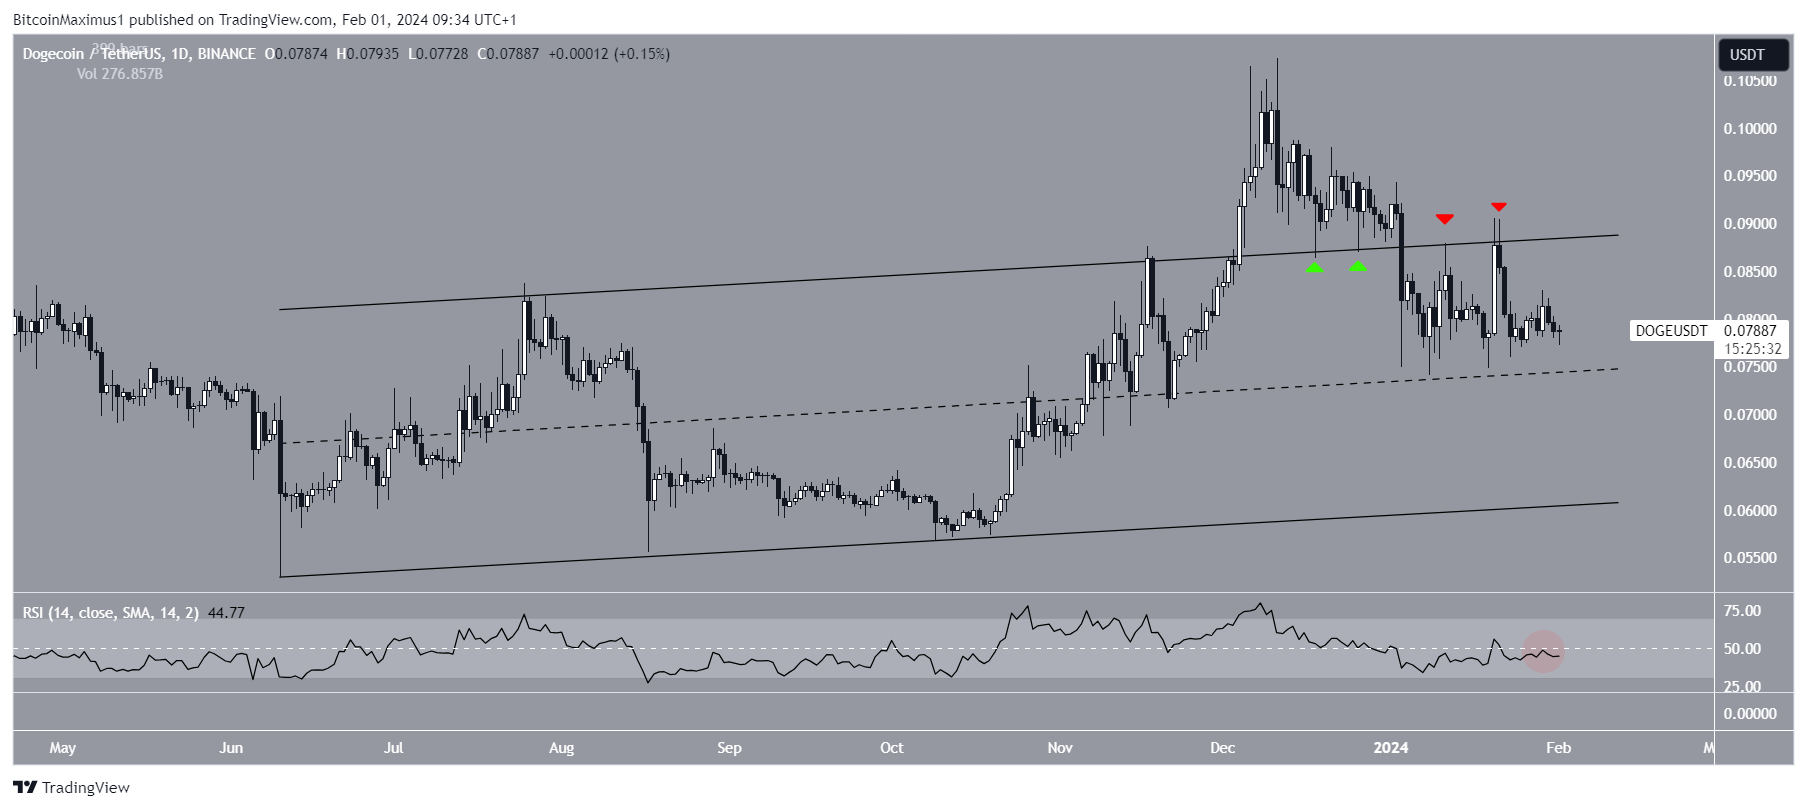
The daily Relative Strength Index (RSI) gives a bearish reading. The RSI is a momentum indicator traders use to evaluate whether a market is overbought or oversold and whether to accumulate or sell an asset.
Readings above 50 and an upward trend suggest that bulls still have an advantage, while readings below 50 indicate the opposite. The indicator is below 50 (red circle), a sign of a bearish trend.
Read More: Dogecoin vs. Bitcoin: An Ultimate Comparison
DOGE Price Prediction: Will Price Break Down From Bearish Pattern?
The six-hour time frame technical analysis shows that DOGE has fallen under a descending resistance trend line since December 2023. When combined with the $0.077 horizontal support area, this created a descending triangle, considered a bearish pattern.
Read More: How to Buy Dogecoin (DOGE) Anonymously
The DOGE price trades just above this support area, while the RSI has fallen below 50 (red circle). If it breaks down, DOGE can drop by 27% to the closest support area at $0.057.
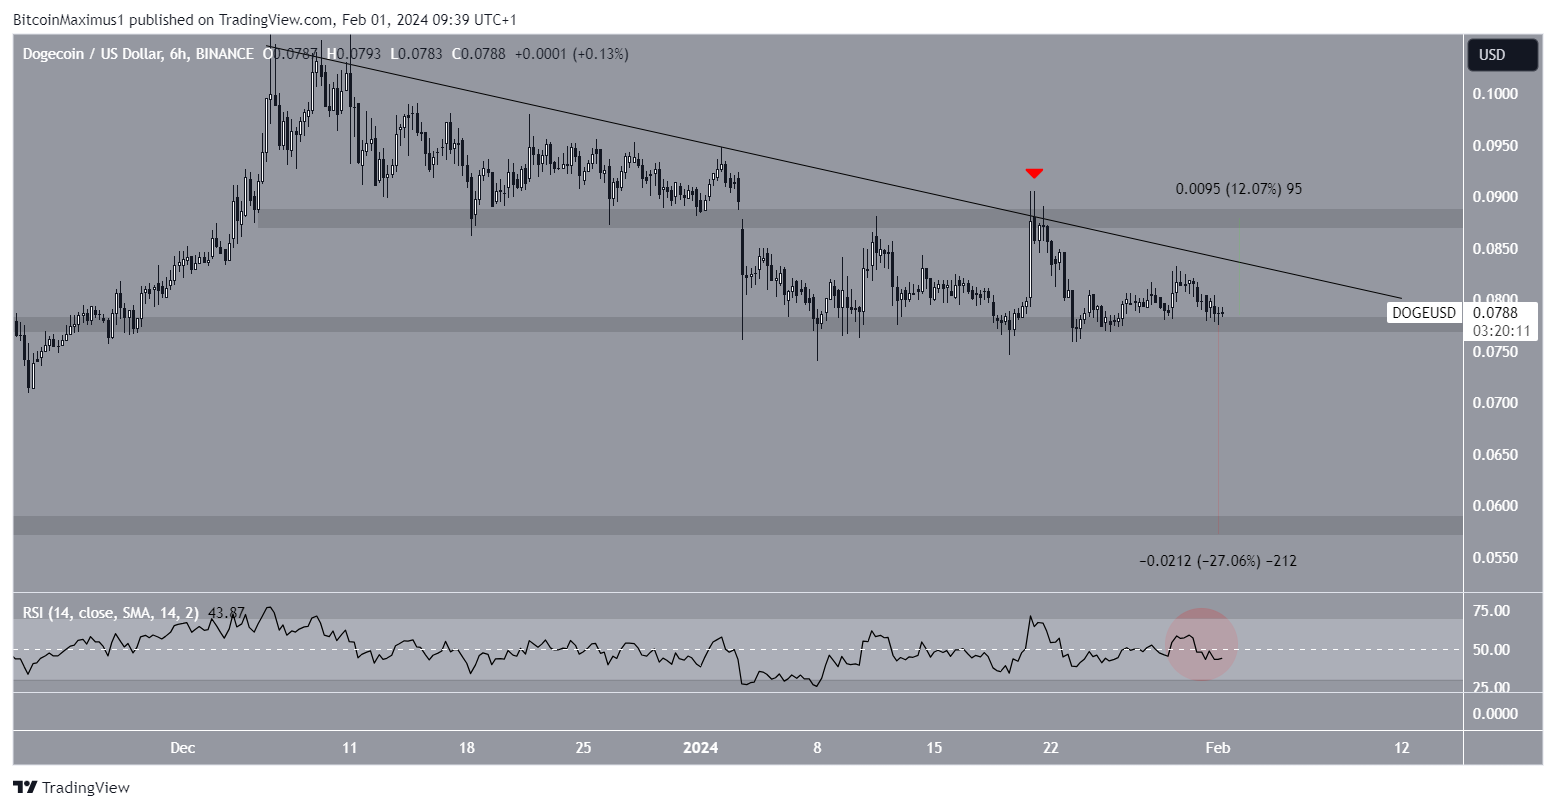
Despite the bearish Dogecoin price prediction, a strong bounce at the $0.077 area can trigger a breakout from the resistance trend line and a 12% increase to the next resistance at $0.087.
For BeInCrypto‘s latest crypto market analysis, click here
