


The ETH/BTC chart has reached an important support area but has yet to show any bullish reversal signs. The price may continue to fall before eventually reversing its bearish trend.
Technical Indicators
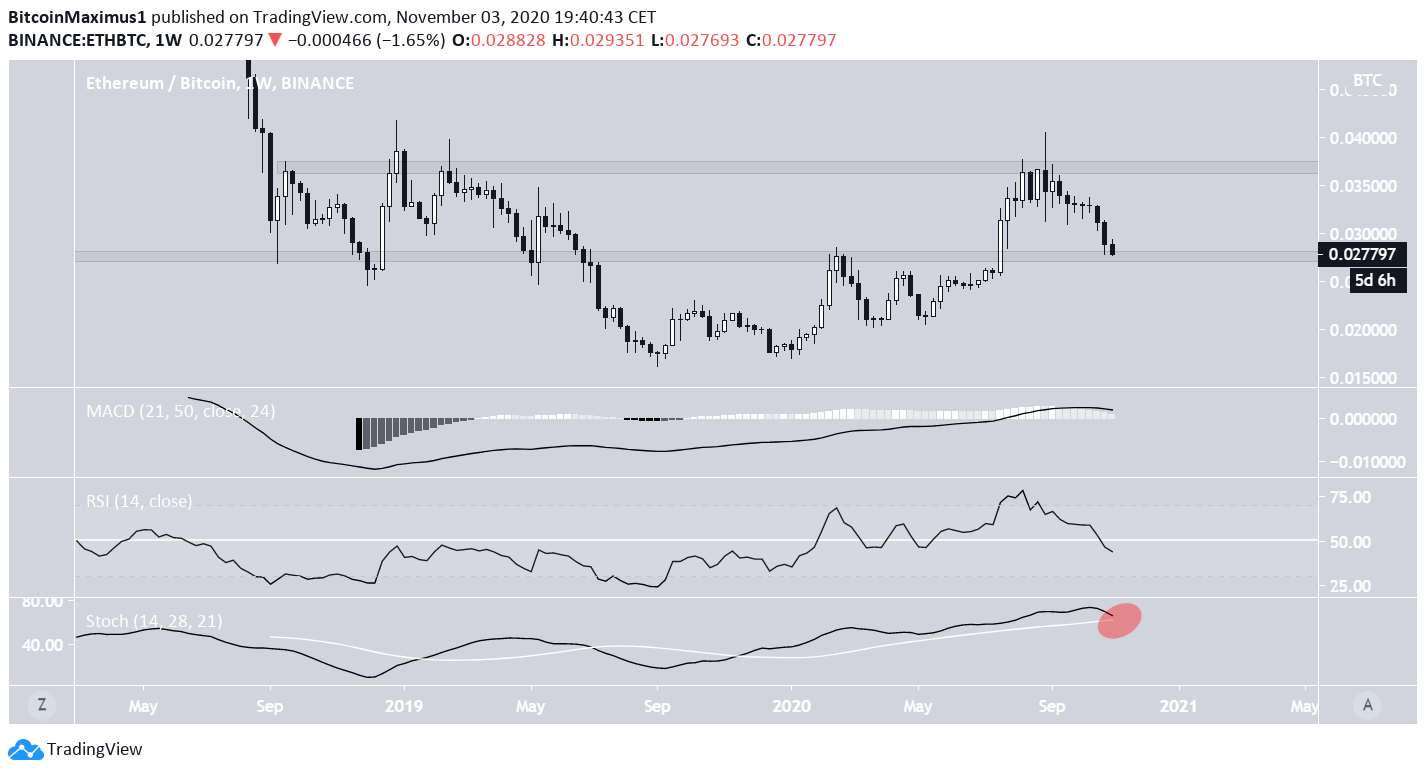
The weekly chart for ETH/BTC shows that the price has been declining since it reached a high of ₿0.04 on Sept 1, and has dropped all the way to the ₿0.028 area.
The area initially acted as support throughout 2018/2019, before the price broke down. It acted as resistance once more in July 2019, and the price broke out afterward. Now, the same area is likely to act as support.
Technical indicators are turning bearish but have not confirmed the bearish trend. While the RSI has fallen below 50, the MACD has not yet crossed into negative territory, and the Stochastic Oscillator has not made a bearish cross.
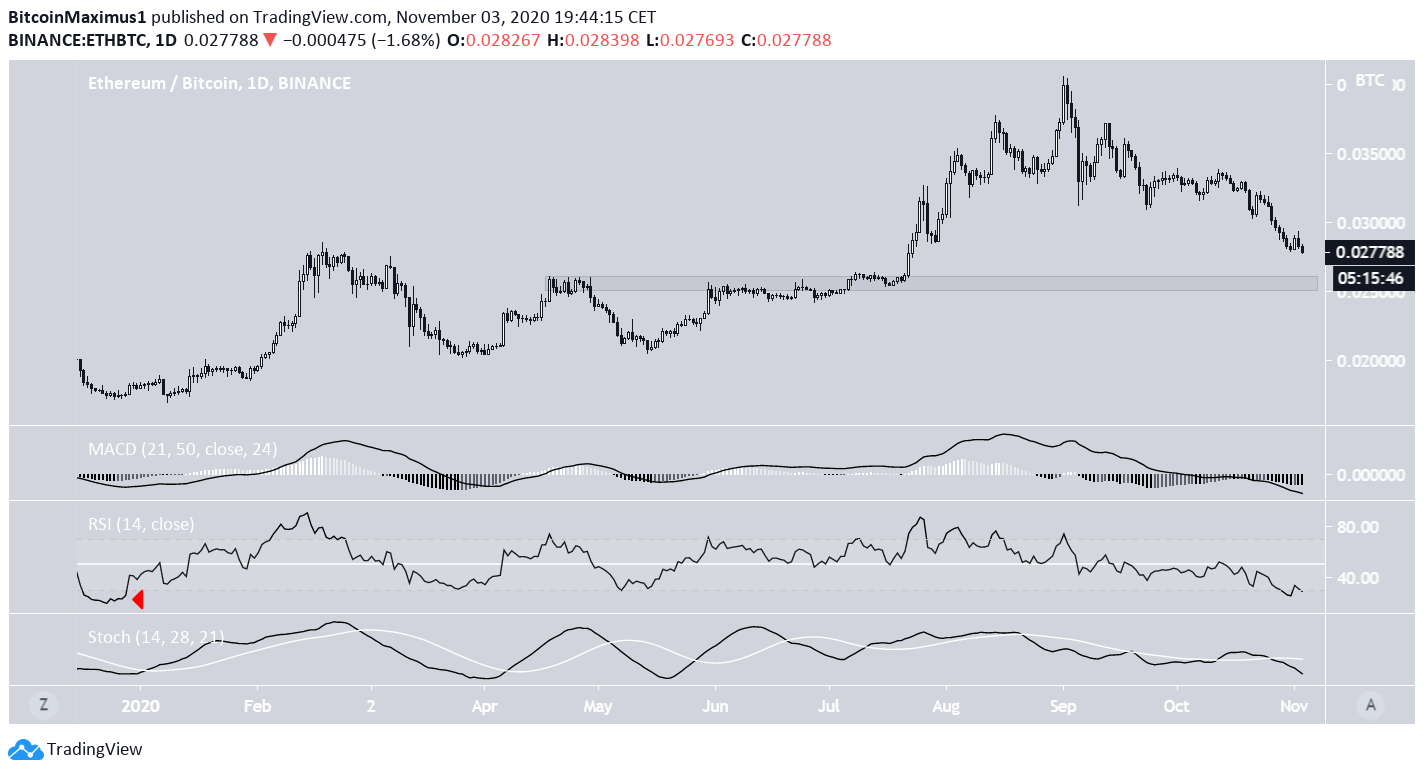
The daily chart has a slightly lower support area, found at ₿0.026.
Also, there are no bullish reversal signs yet. However, technical indicators show that the rally is extremely oversold since the daily RSI has recorded its lowest value since Dec 2019.
However, the lack of a bullish divergence indicates that the price is likely to continue dropping, at least in the short-term.
Current Movement
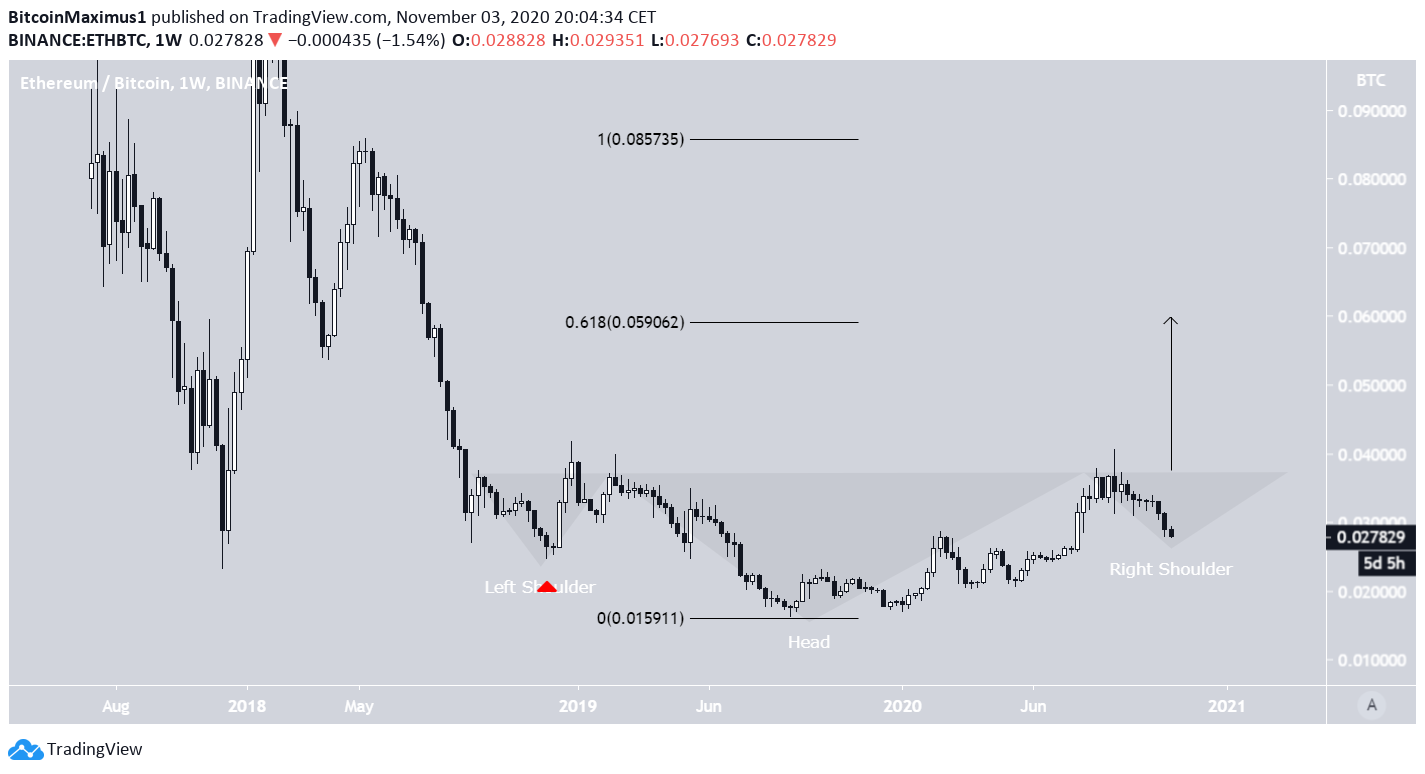
Cryptocurrency trader @Cryptonewton outlined an ETH/BTC chart, which shows a long-term inverse head and shoulders (H&S) pattern forming. Once the right shoulder is complete, he predicts an upward move all the way to ₿0.06.
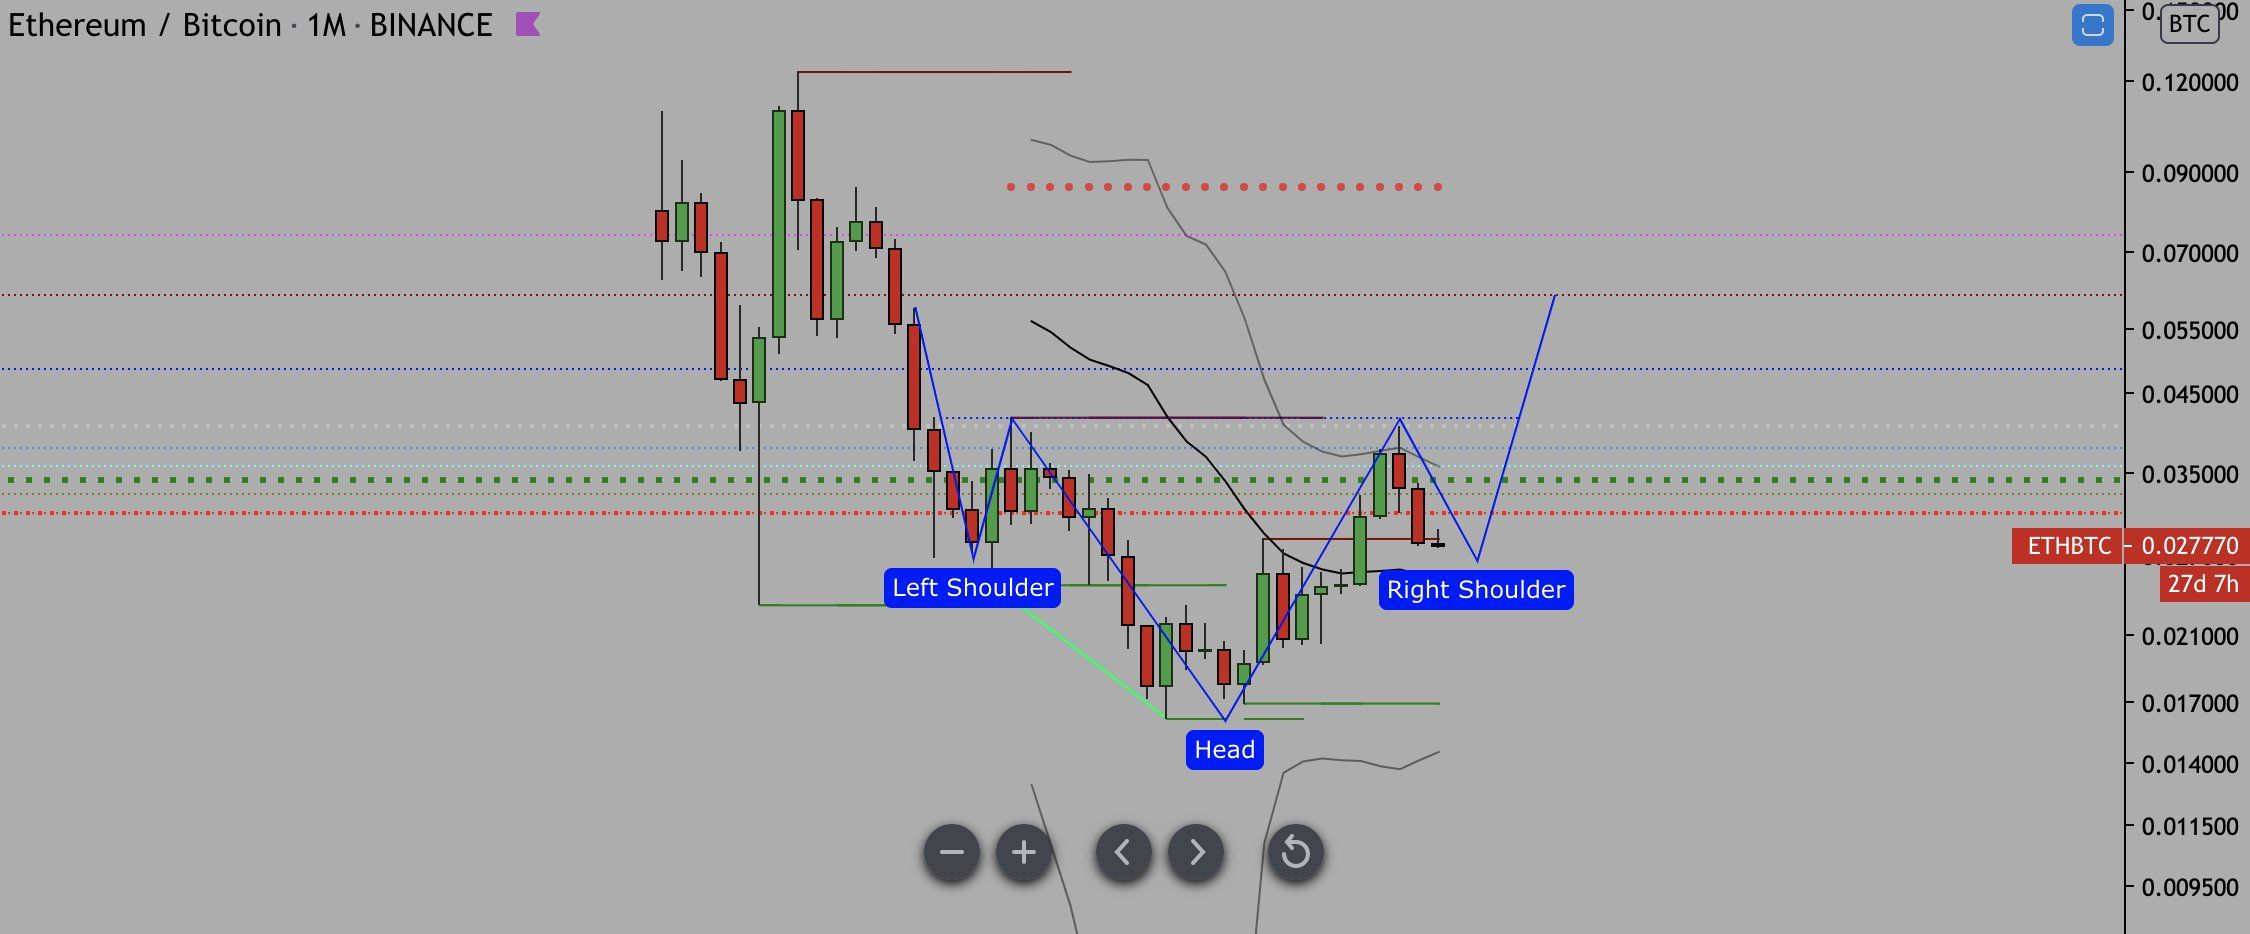
It seems possible that the price is indeed trading inside an Inverse H&S but has not yet completed the right shoulder of the pattern.
The left shoulder had a low of ₿0.0246, so the price may continue falling before it eventually reaches a bottom. This would also fit with the readings from the technical indicators since they have not given any clear reversal signs, despite showing oversold levels.
If a breakout occurs, the price would likely increase all the way to ₿0.06, a target found by projecting the length of the pattern to the breakout point. It is also the 0.618 Fib level of the entire decline.
The Bitcoin Dominance Rate
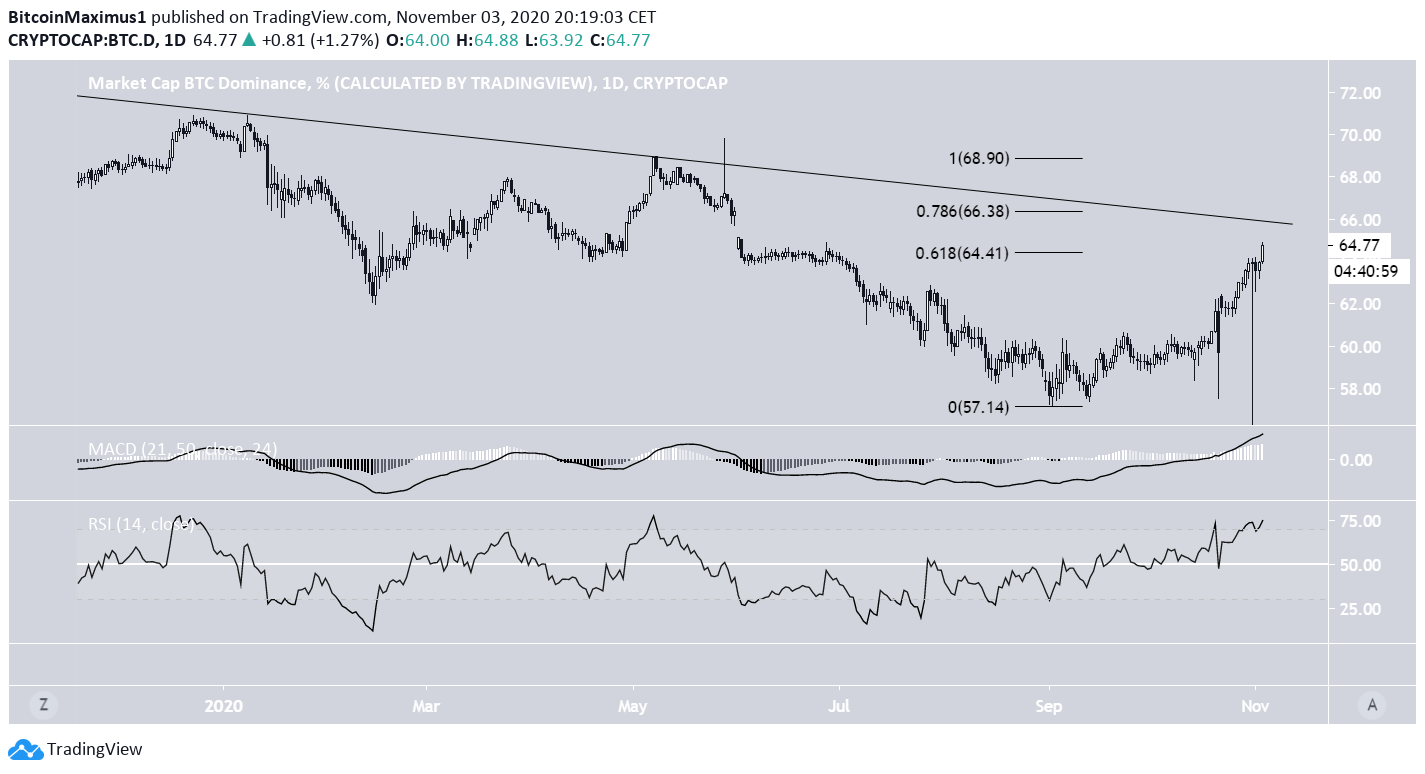
The Bitcoin dominance rate (BTCD) has also been increasing significantly since the beginning of Sept. However, the rate is approaching an important resistance area and a descending resistance line that has been in place since Sept 2019.
Technical indicators show that the rally is overbought but do not give any clear signs of weakness, indicating that the rate is likely to reach the descending resistance line and the 63.3% area, the 0.786 Fib level of the entire fall.
Conclusion
Since ETH is the biggest altcoin, and a rally in the ETH/BTC pair would likely cause a decline in BTCD, both charts are in alignment. The BTCD could rally a little more towards 66.3%, while ETH/BTC could fall slightly before the trends are reversed.
For BeInCrypto’s latest Bitcoin analysis, click here!
Disclaimer: Cryptocurrency trading carries a high level of risk and may not be suitable for all investors. The views expressed in this article do not reflect those of BeInCrypto.


