

Waves (WAVES) has fallen below long- and short-term support levels and is now approaching its 2021 lows.
WAVES has been falling since reaching an all-time high price of $63.88 on March 28. The downward movement has so far led to a low of $6.01.
It is at risk of breaking down from an ascending support line that has been in place since June 2020, more specifically for 679 days. It has currently decreased below it but has not yet reached a weekly close. A breakdown from such a long-term structure usually signifies that the price is mired in a deep correction.

Economist and trader @Krugermacro tweeted a chart of WAVES, which shows an extremely sharp drop since the $62 all-time highs. Measuring from those highs, the price has so far decreased by 90%.

Failure to reclaim
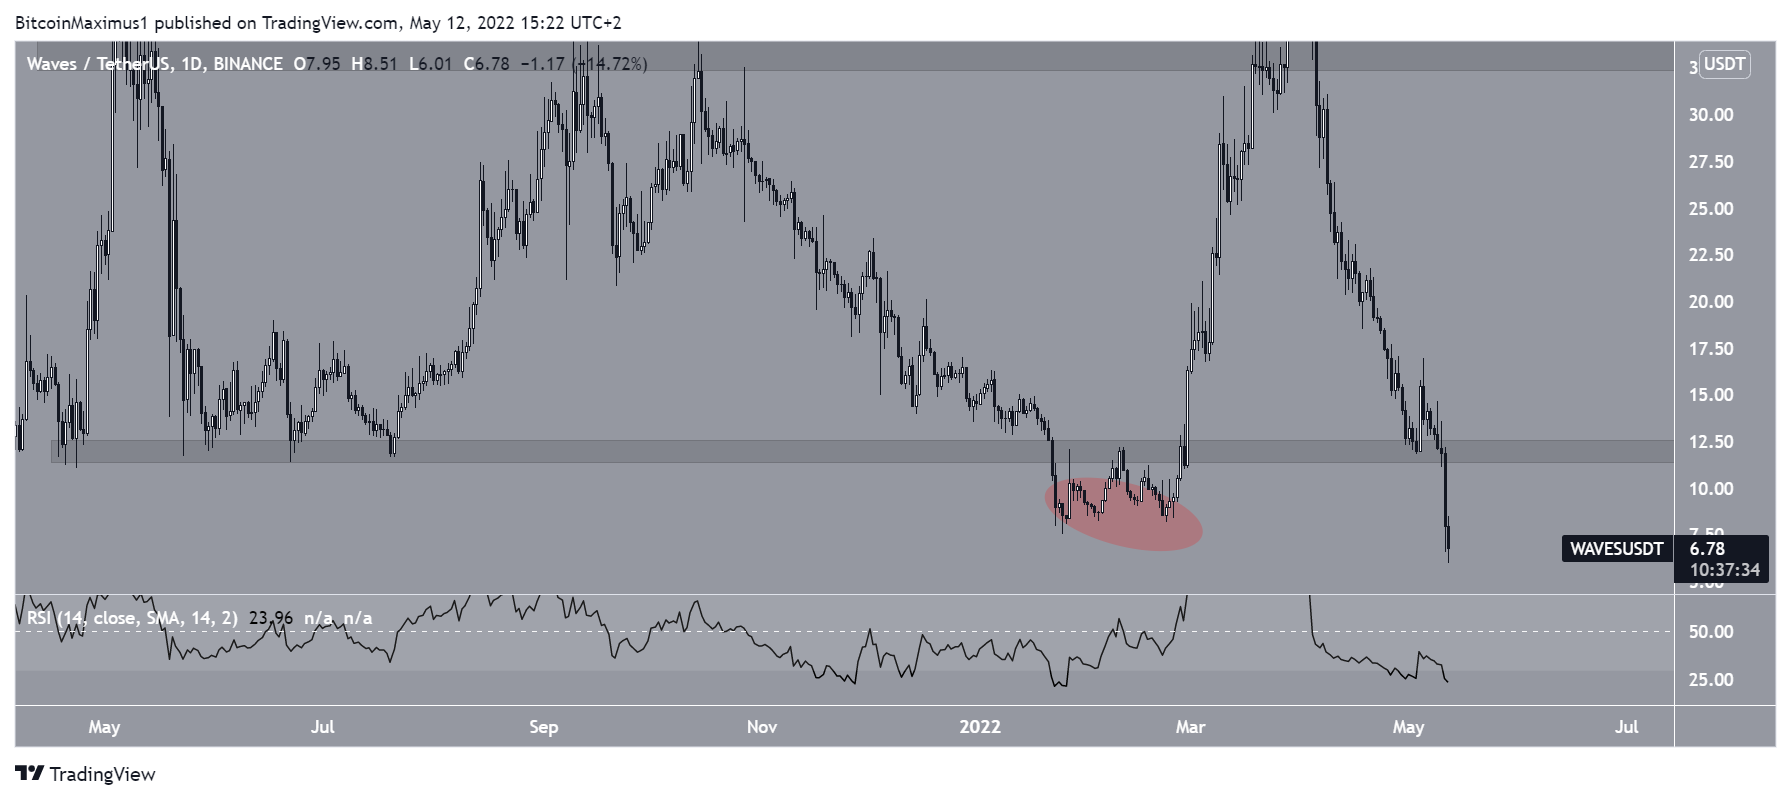
The daily chart does nothing to detract from the bearish sentiment of the weekly chart. The main reason for this is that the price has fallen below the $12 horizontal support area.
Previously, the deviation below this area on Feb 2022 (red circle) was the catalyst for the entire upward movement that led to the all-time high.
Therefore, its failure to provide support can now be seen as a sign that the trend is definitively bearish.
In addition to this, while the RSI is oversold, there is no bullish divergence in place.
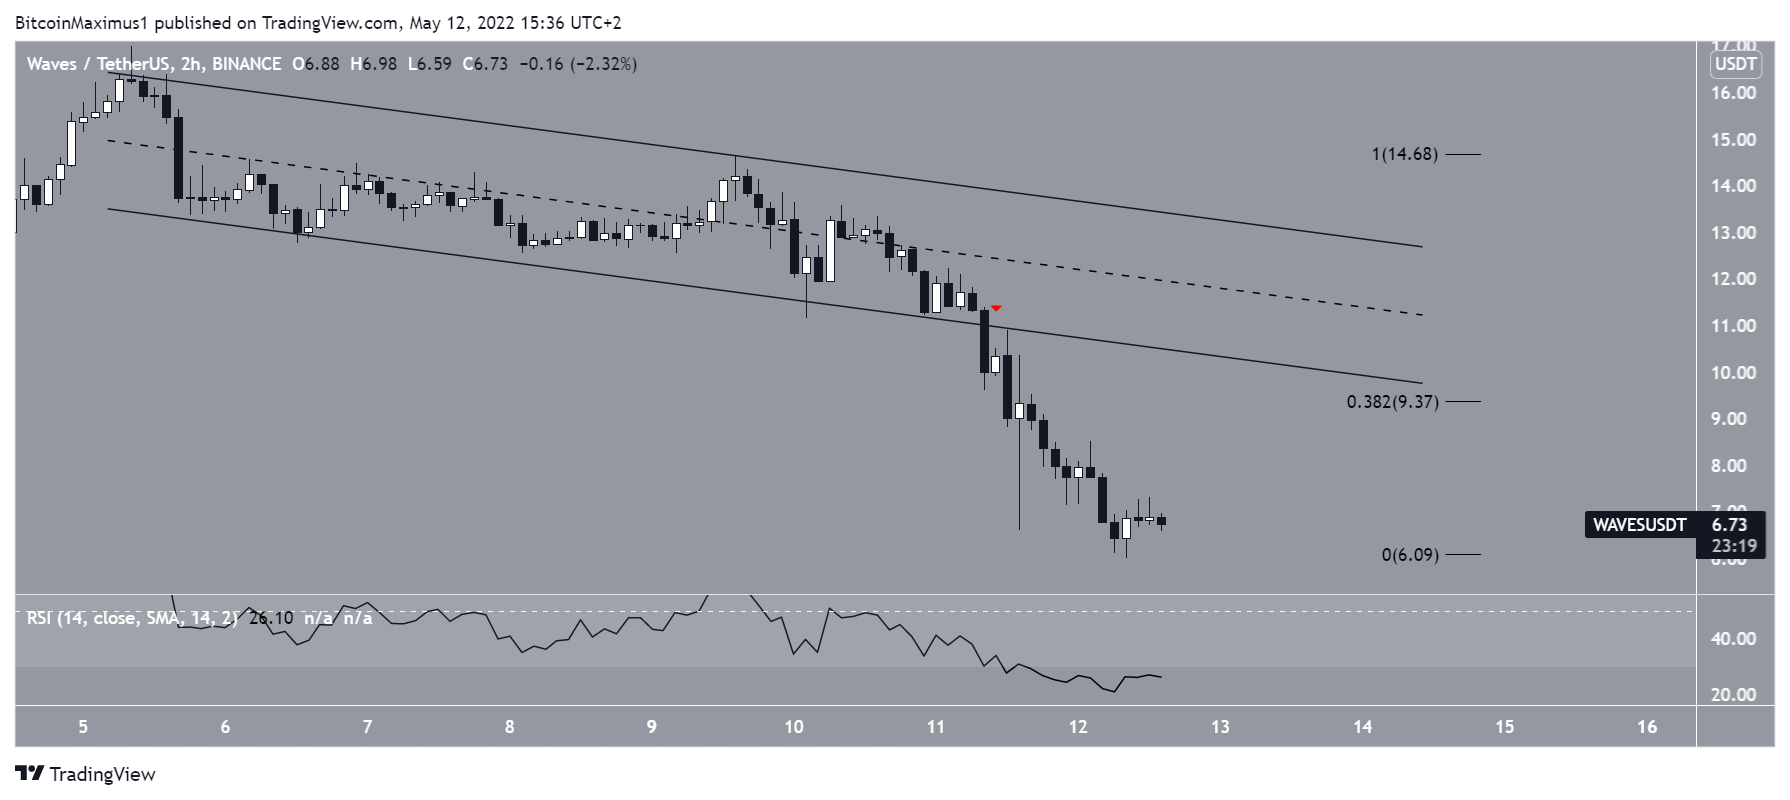
Short-term WAVES movement
Finally, the two-hour chart shows that WAVES has been falling at an accelerated rate since breaking down from a parallel channel on May 11 (red icon).
The decrease has begun to slow down and the RSI is now deep into oversold territory.
If a bounce were to occur, the $9.40 area would be expected to provide strong resistance. It is both the 0.382 Fib retracement resistance level and coincides with the support line of the previous descending parallel channel.
Due to the confluence of these factors, it is expected to provide strong resistance.
For Be[in]Crypto’s latest Bitcoin (BTC) analysis, click here
Trusted
Disclaimer
In line with the Trust Project guidelines, this price analysis article is for informational purposes only and should not be considered financial or investment advice. BeInCrypto is committed to accurate, unbiased reporting, but market conditions are subject to change without notice. Always conduct your own research and consult with a professional before making any financial decisions. Please note that our Terms and Conditions, Privacy Policy, and Disclaimers have been updated.
