On June 11, the S&P 500 price declined by 5.8%. This was the largest percentage decline since March 16 and could have been the beginning of a longer-term downward trend.
S&P 500 Tumbles
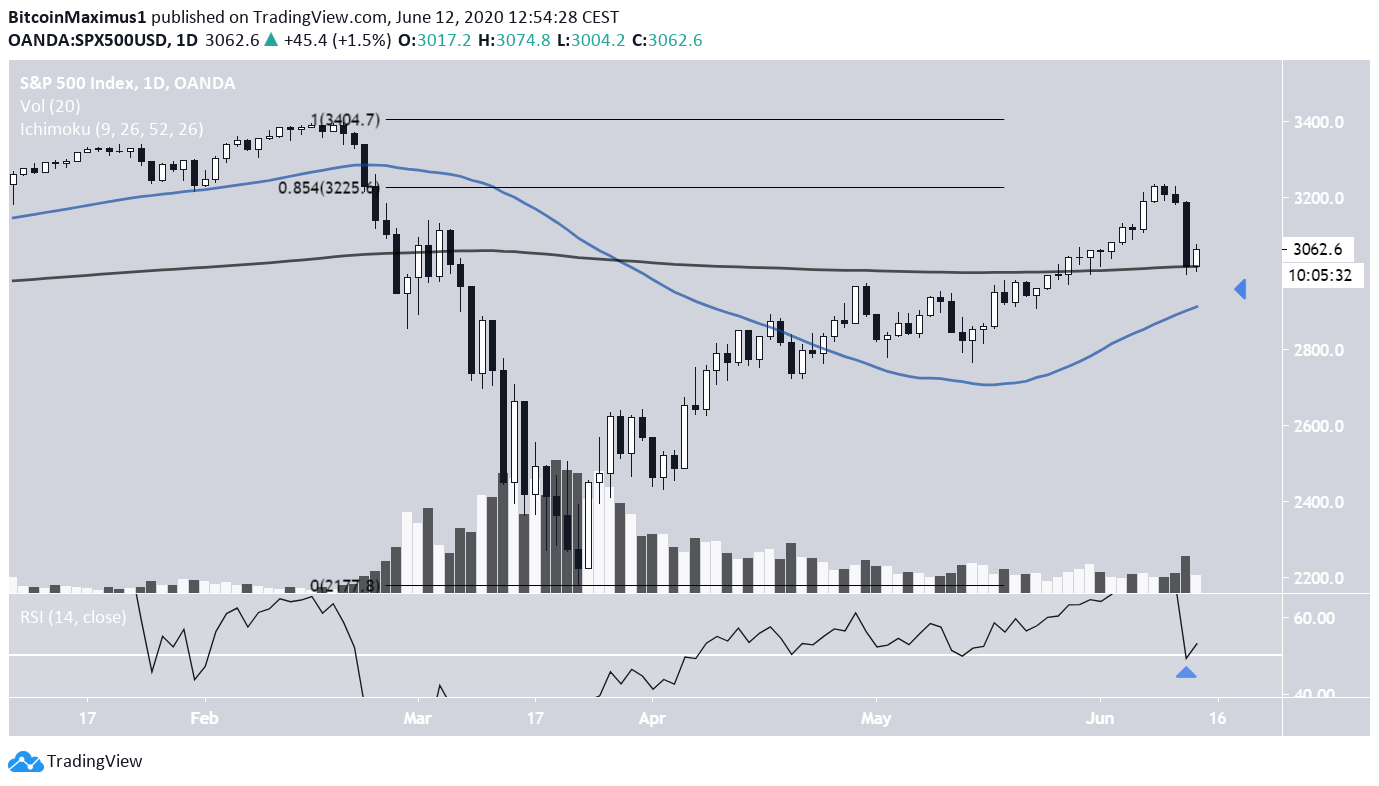
On June 11, the price of the S&P 500 index fell considerably from a high of 3190 to a low of 2998. While the decline had begun on June 9, the drop accelerated two days after. However, the price has found some support above its 200-day moving average (MA), and the daily RSI has bounced at 50, both bullish signs.
In addition, the 50-day MA is moving upwards, possibly indicating that it will create a bullish cross with the 200-day one. Whether this cross takes place or gets rejected will be a deciding factor in determining the direction of the future trend.
However, due to the failure to break the February highs, it’s possible that the entire previous decline was an upward correction in response to the prior rapid decline. Price touched the June 9 high at precisely the 0.854 Fib level of that fall.
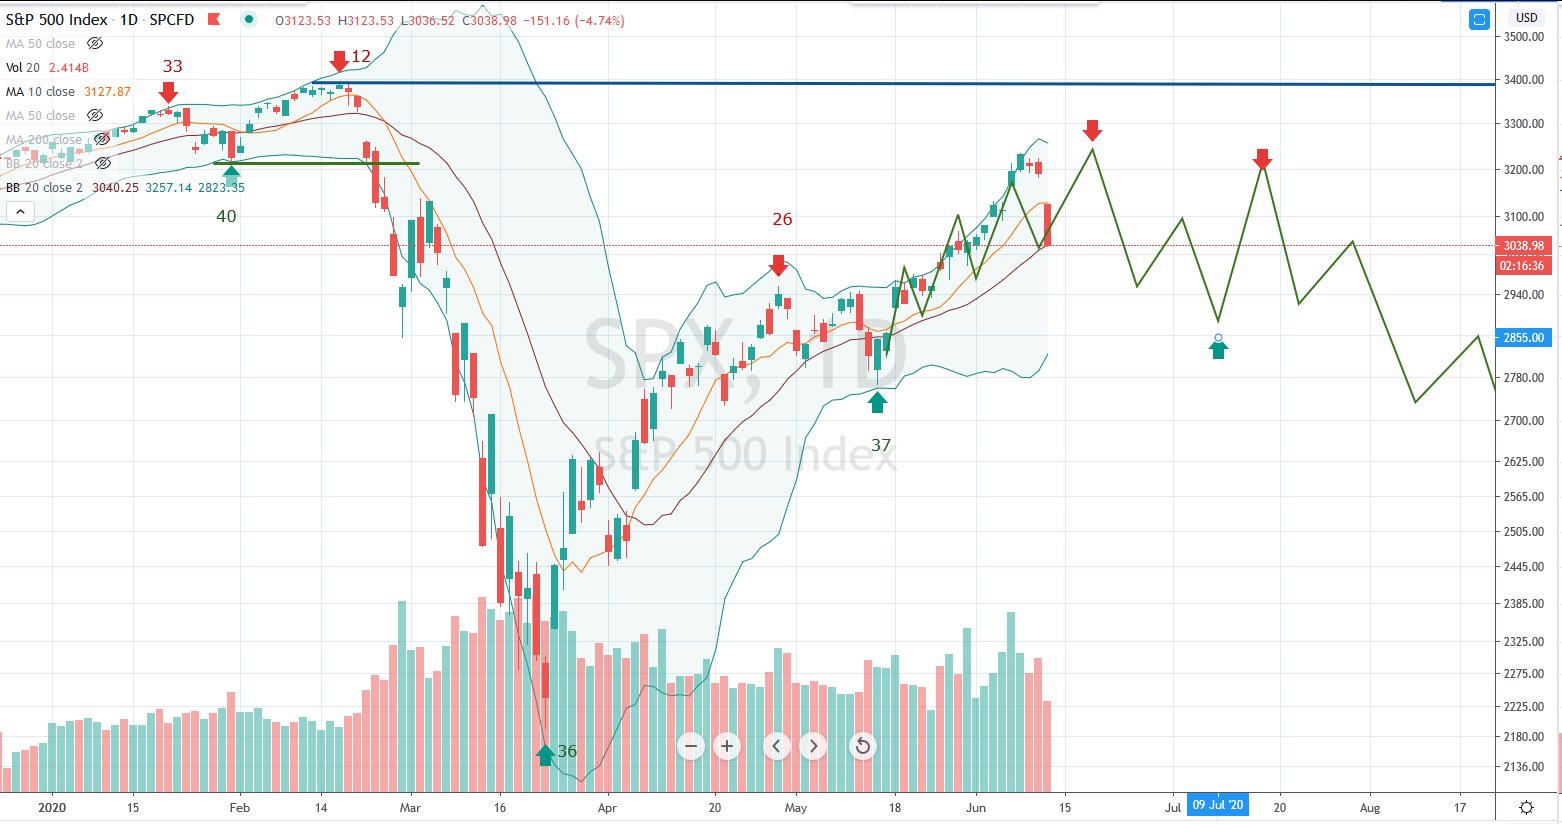
Well-known trader @Bobloukas shares this belief, more specifically stating that this entire move was a retracement, and the price has already reached its immediate highs. He outlined a long-term correction for the index. However, after yesterday’s decline, he believes a bounce is due, stating that:
Historically not a good time to be getting too bearish. Wait for the bounce out of the half low before looking.
Correlation With Bitcoin
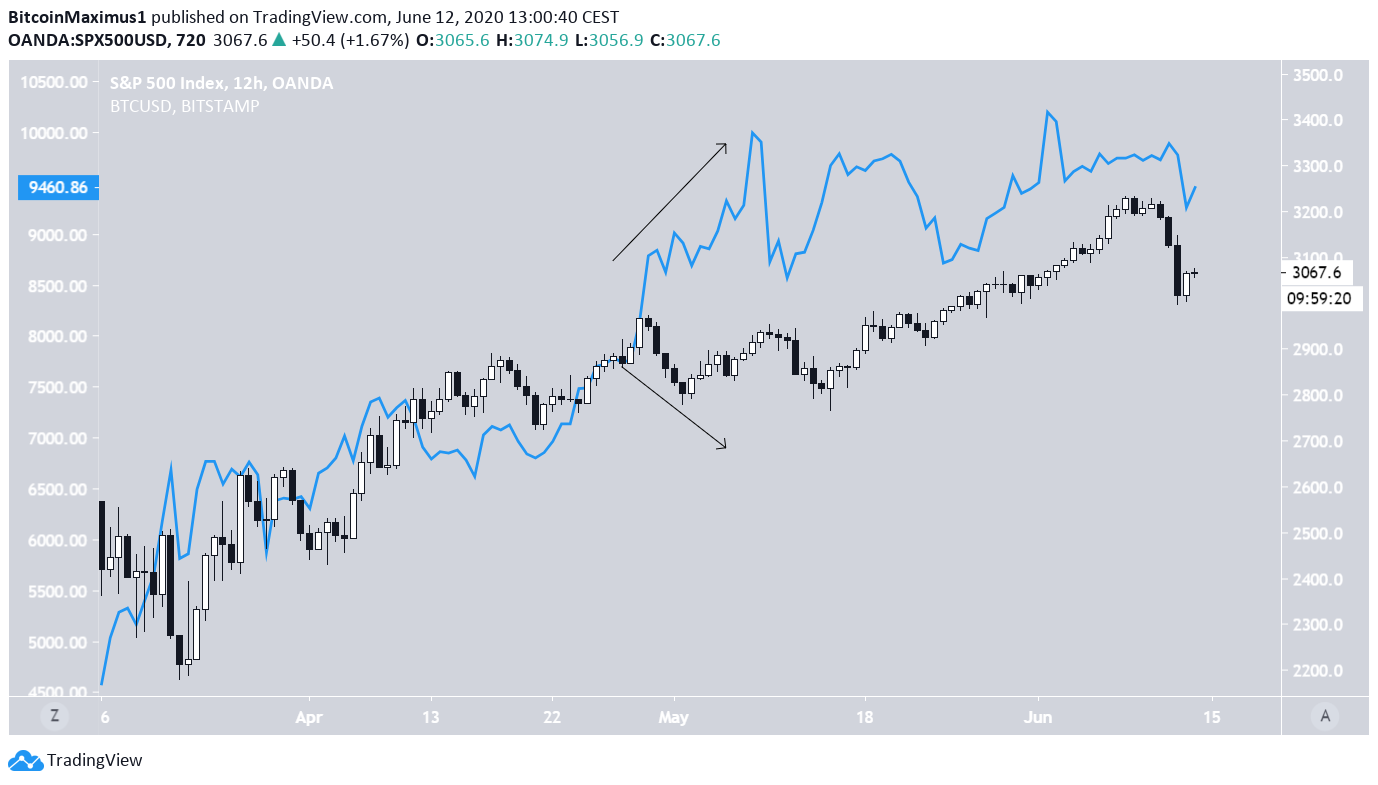
At least since the March retracement, both the S&P 500 and Bitcoin have been positively correlated with each other. Basically, an increase/decrease in the price of the one was also visible in the price of the other.
While there was a divergence at the beginning of May, in which the BTC price increased while that of the S&P 500 declined, they have now converged. This suggests that while there might be short-term movements that break the pattern, the prices of both assets are positively correlated with each other.
Since our Bitcoin analysis also forecasts a bearish trend, it is in alignment with the analysis of the S&P 500.