


VeChain (VET) has been increasing since it reached a low on Sept. 7. A breakout above the current resistance area would indicate that the price has begun a new upward trend.
Retracement or Breakout?
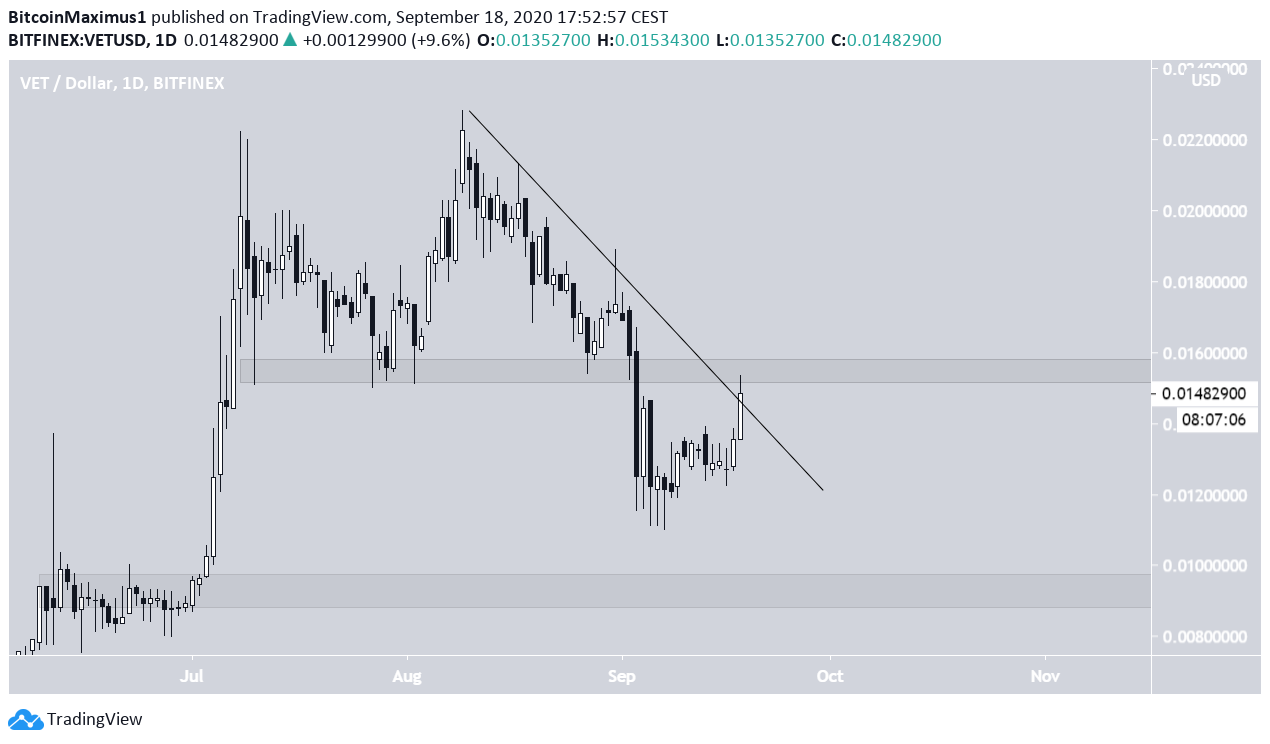
The VET price has been decreasing since Aug. 9, when it reached a high of $0.022. During the decrease, the price has made several lower highs, creating a descending resistance line in the process. However, the price bounced after it reached a low of $0.011 on Sept. 7 and has been increasing since. At the time of writing, it was about to break out from this resistance line.
The line also coincides with the $0.0155 resistance area, so a breakout above it and its validation as resistance would confirm that the trend is bullish. Conversely, the closest support area is found at $0.0095.
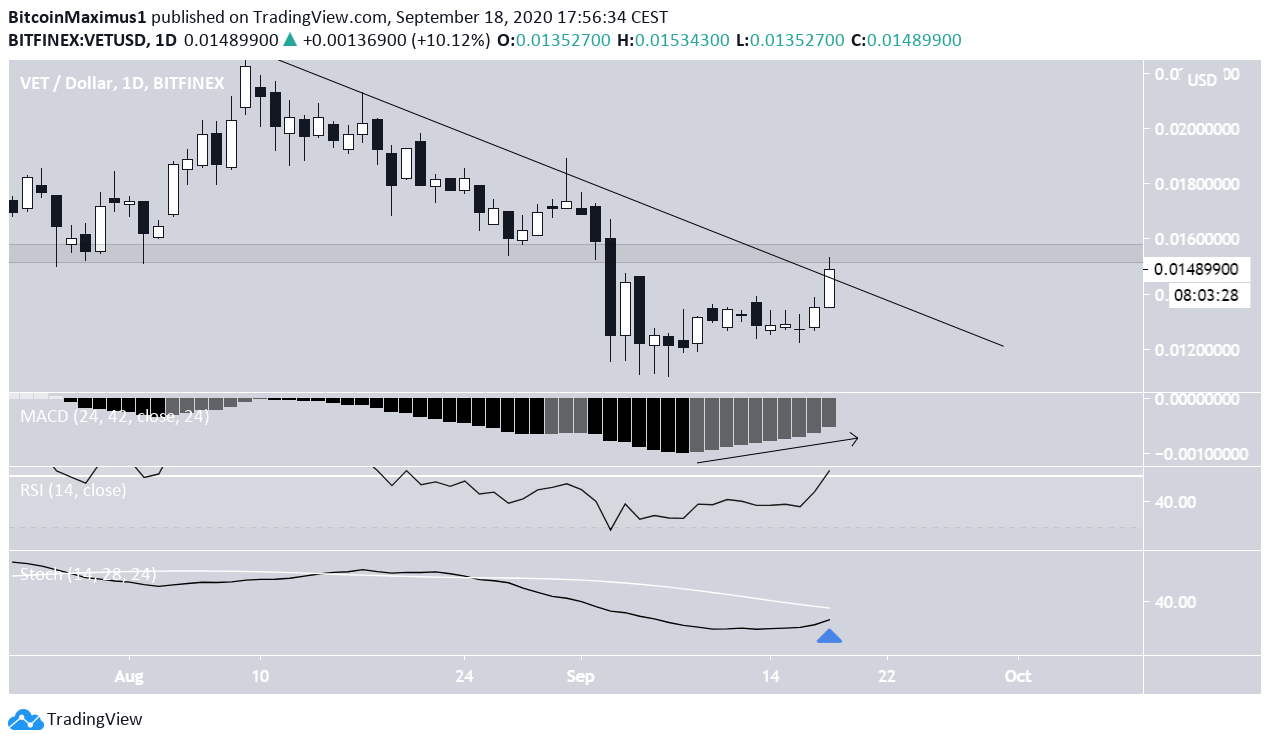
Technical indicators are turning bullish, even though they have yet to confirm the upward trend:
- The MACD is increasing but has not crossed into positive territory yet.
- The RSI has crossed above 50 but has not generated any bullish divergence.
- The Stochastic oscillator is very close to making a bullish cross.
A bullish cross and a positive MACD would confirm that the trend is bullish.
Wave Counts
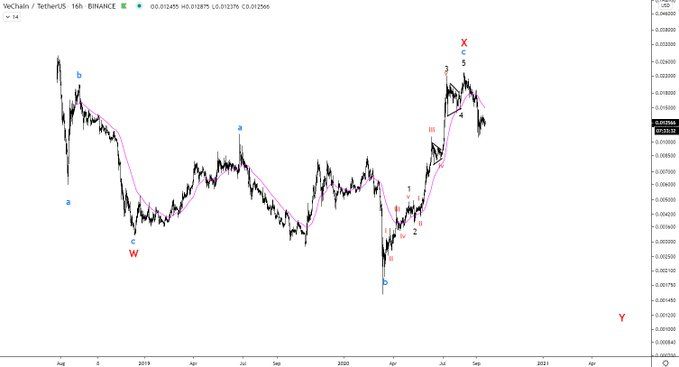
Cryptocurrency trader @Crypto618 has a bearish outlook for VET, in which the price has completed a long-term bullish formation and will now move downwards for the foreseeable future.
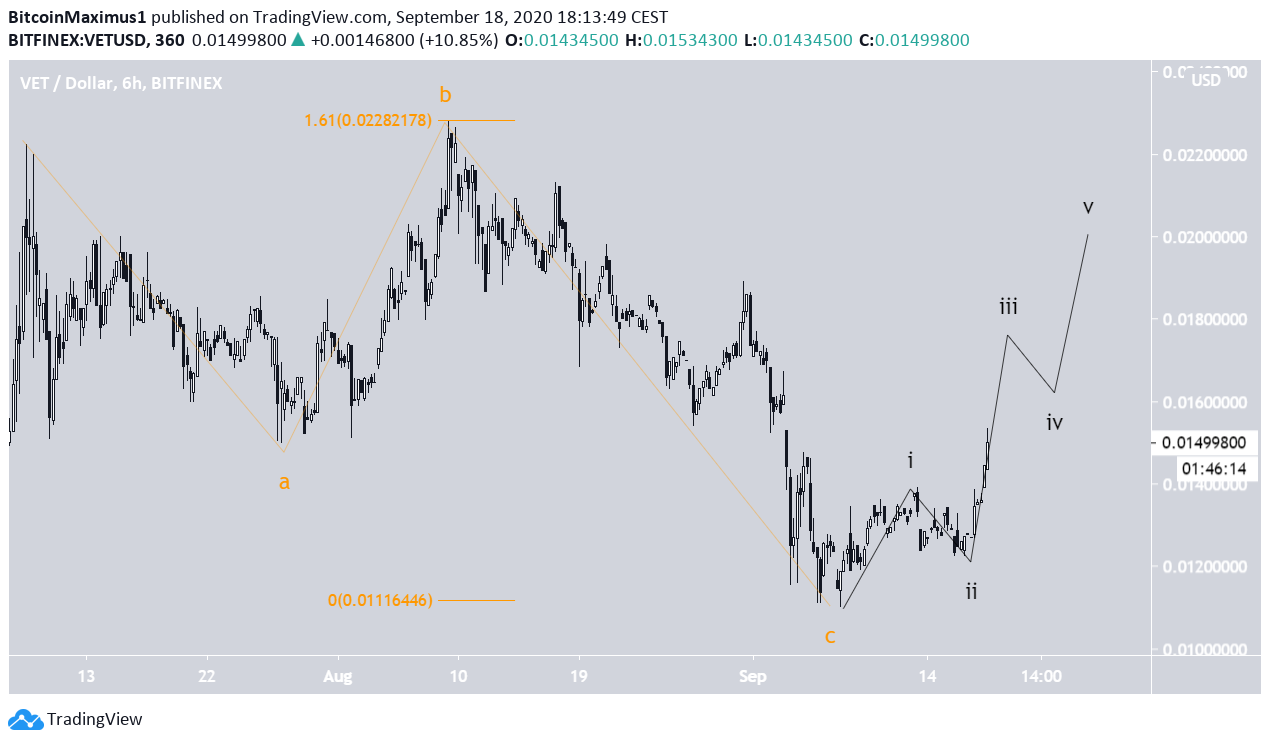
However, the movement since July 8 is very akin to an A-B-C correction (in orange below), which would suggest that the price reached a bottom on Sept. 4. The fact that the A:C waves have a 1:1.61 ratio makes it very likely that the correction has come to an end.
In addition, the ensuing movement looks impulsive, possibly signaling the beginning of an upward trend. Therefore, unless the $0.11 low is taken out, it seems that VET has begun a new bullish impulse.
To conclude, it is likely that VET has begun a new upward trend. A breakout above the $0.015 resistance area would confirm that the price has done so.


