


The VET price has created a bullish pattern and has possibly reached the end of the correction that has been ongoing since December 2, 2019.
On December 2, the VET price reached a high of 110 satoshis. Since then, it has been decreasing. While it initially found support above 70 satoshis, the price broke down on January 8.
Full-time trader @cryptoMichNL outlined the VET price chart and stated that it is getting to his outlined support area between 58-62 satoshis.
This one is getting there.
Interesting. pic.twitter.com/aMy5Irkie1
— Michaël van de Poppe (@CryptoMichNL) January 14, 2020
Will the VET price reach this area? If so, will it reverse afterward? Keep reading below if you are interested in finding out.
End Of The Correction
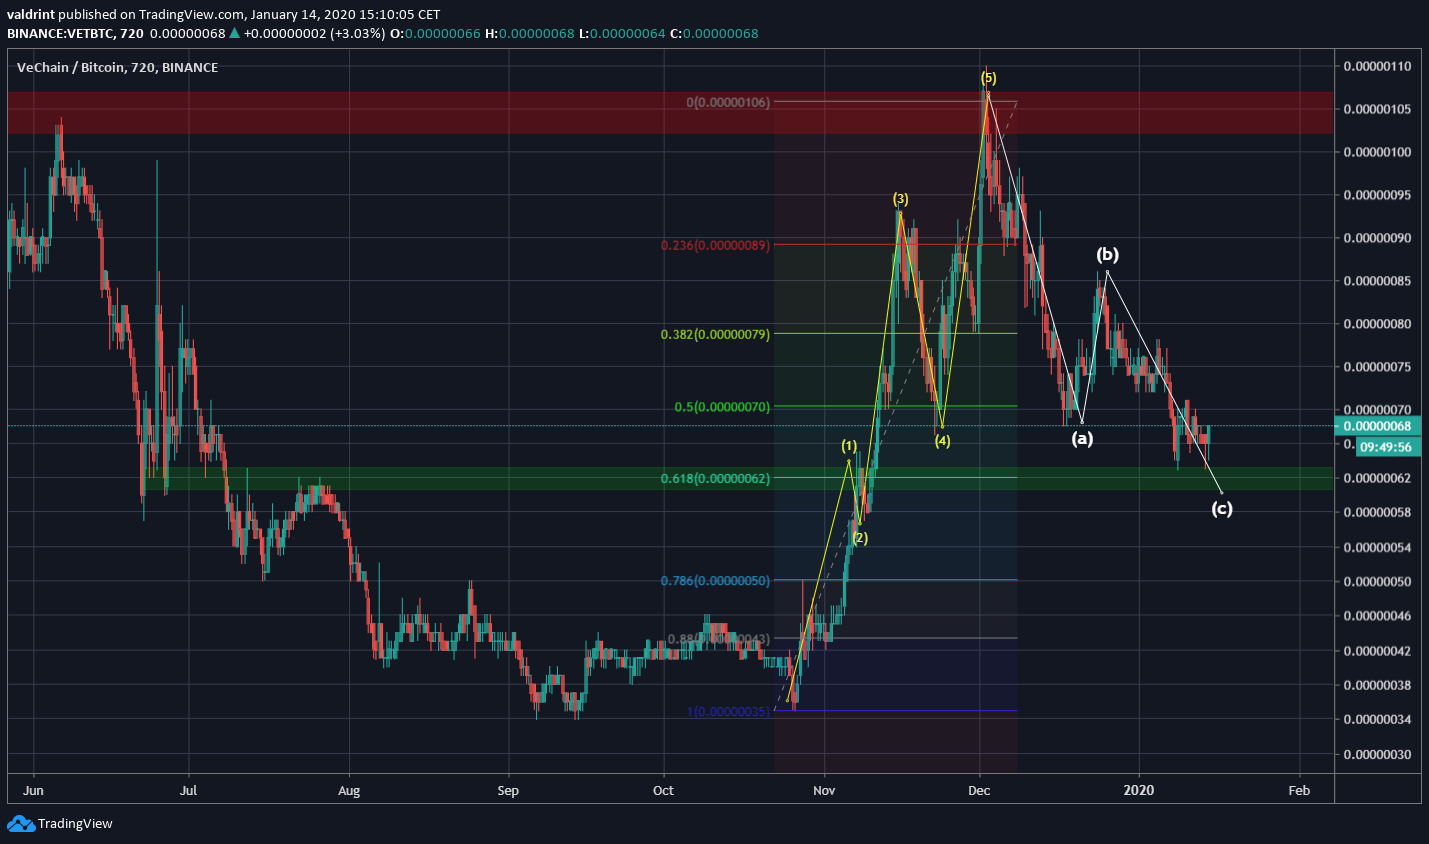
Beginning on October 26, 2019, the VET price seems to have completed a five-wave Elliott Formation that ended with a high of 110 satoshis. What followed was an A-B-C correction, a movement very similar to that outlined in our previous analysis.
The main support area is found near 62 satoshis, its support strengthened by the fact that it is the 0.618 fib level of the entire upward move. The price reached this level twice in the form of long lower wicks and has moved slightly upward afterward.
Descending Wedge
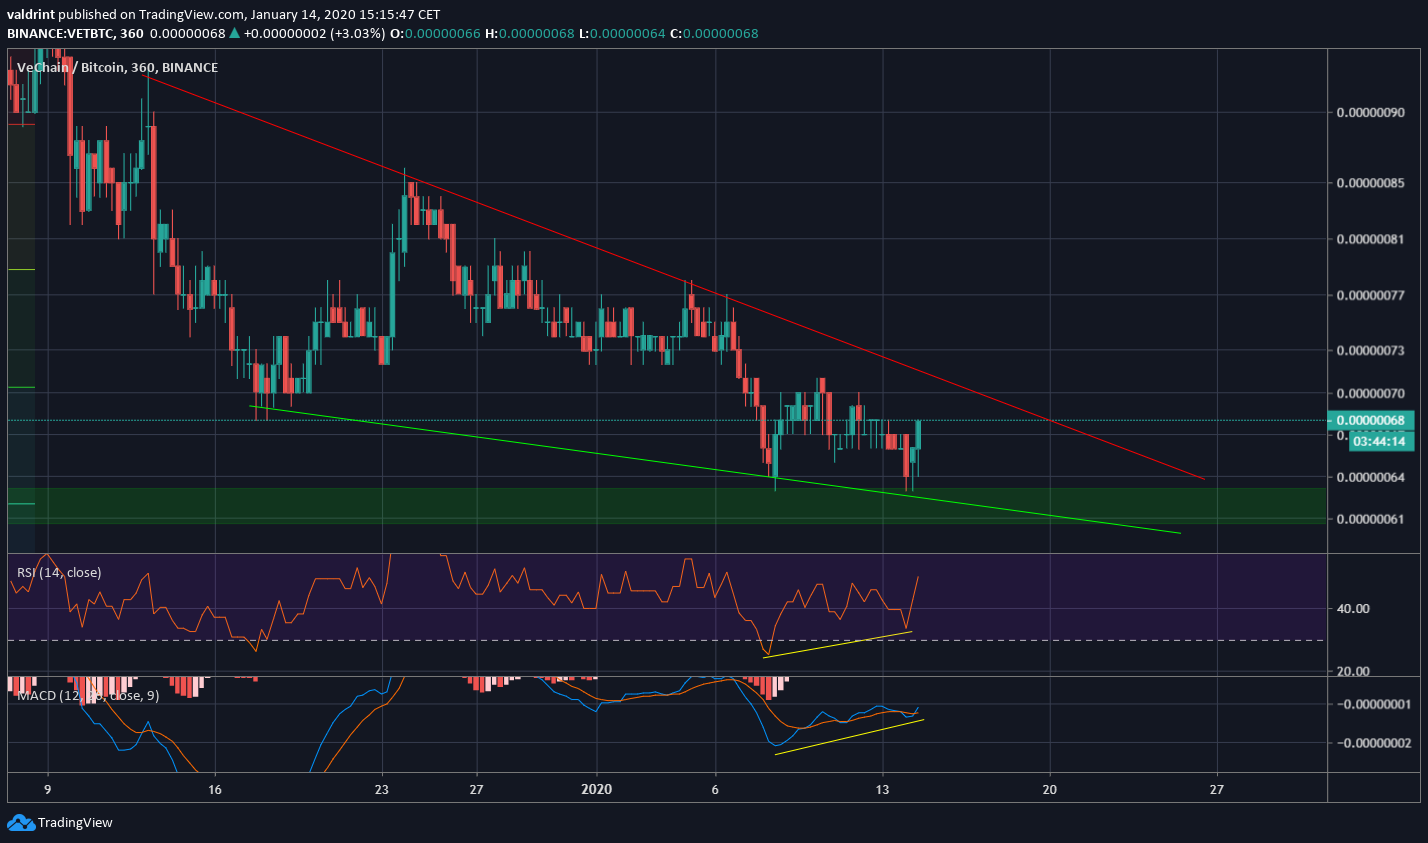
The C wave of the correction has taken the form of a descending wedge. The price has twice bounced on the support line, creating a strong bullish divergence in the process, in both the RSI & the MACD.
So, a bullish pattern has been created near a significant support area, a likely target for the end of the correction. Thus, we believe that the price will eventually break out above this descending wedge, confirming the end of the correction.
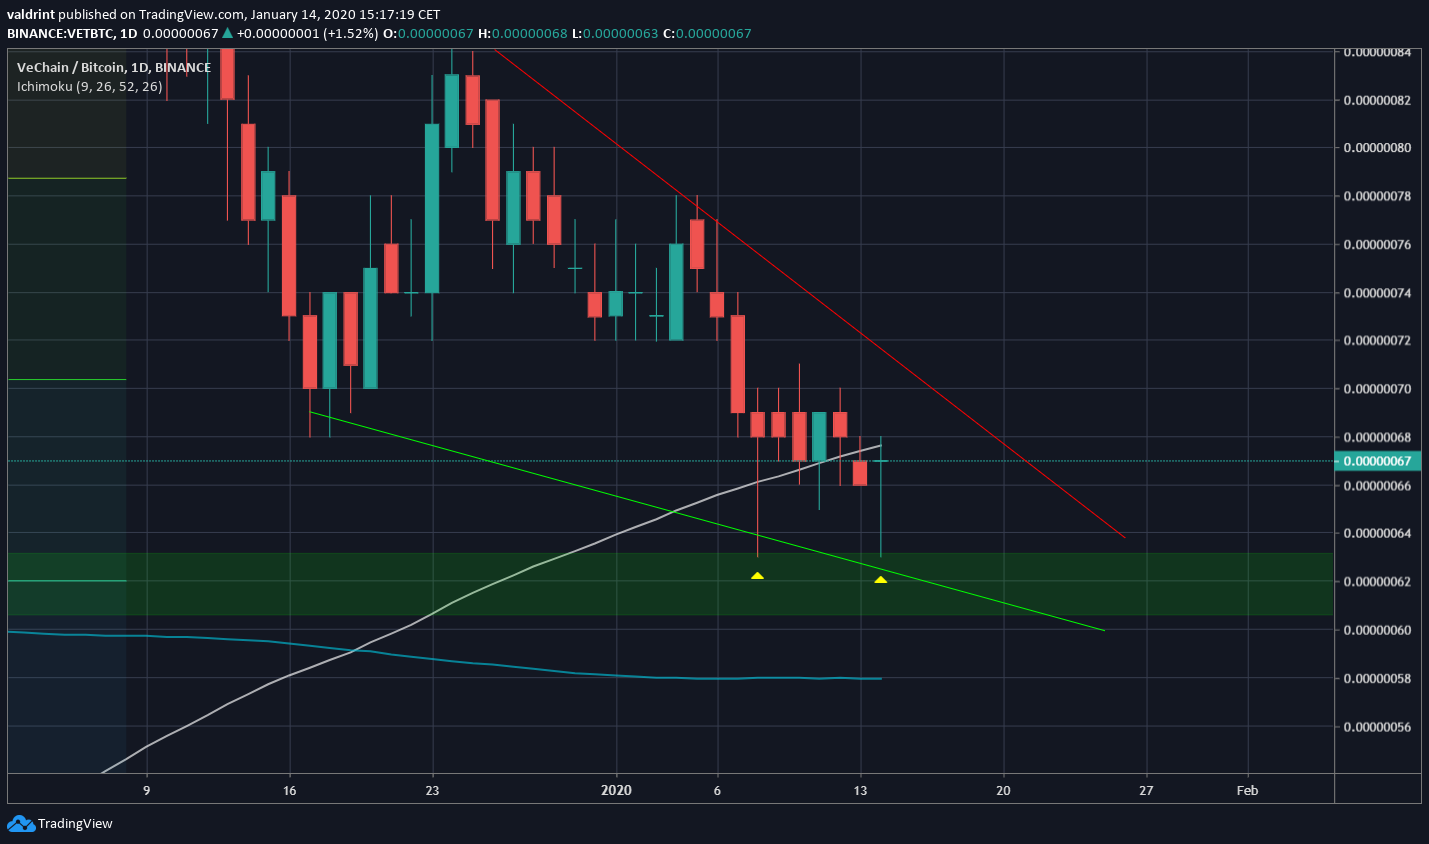
The daily chart likely holds the key to determining if the price will break out immediately or will drop once more towards the support area.
On January 7, the price created an inverted hammer but failed to reach a bullish close. Today, it has created a bullish doji pattern. A bullish close above the 100-day moving average (MA), would create a bullish inverted hammer, and vault the price above the MA, likely using it as support in the future. This would hint that the price is in the process of breaking out.
On the other hand, a failure to close above the 100-day MA would likely take the price to touch the ascending support line once more, near 62 satoshis.
VET Future Movement
If the VET price breaks out, which seems likely, it will probably reach the resistance area at 78 satoshis and possibly the 86 satoshi resistance area.
At the current time, there is not enough information to determine whether the price will make another attempt at breaking out above the 105 satoshi area or not.
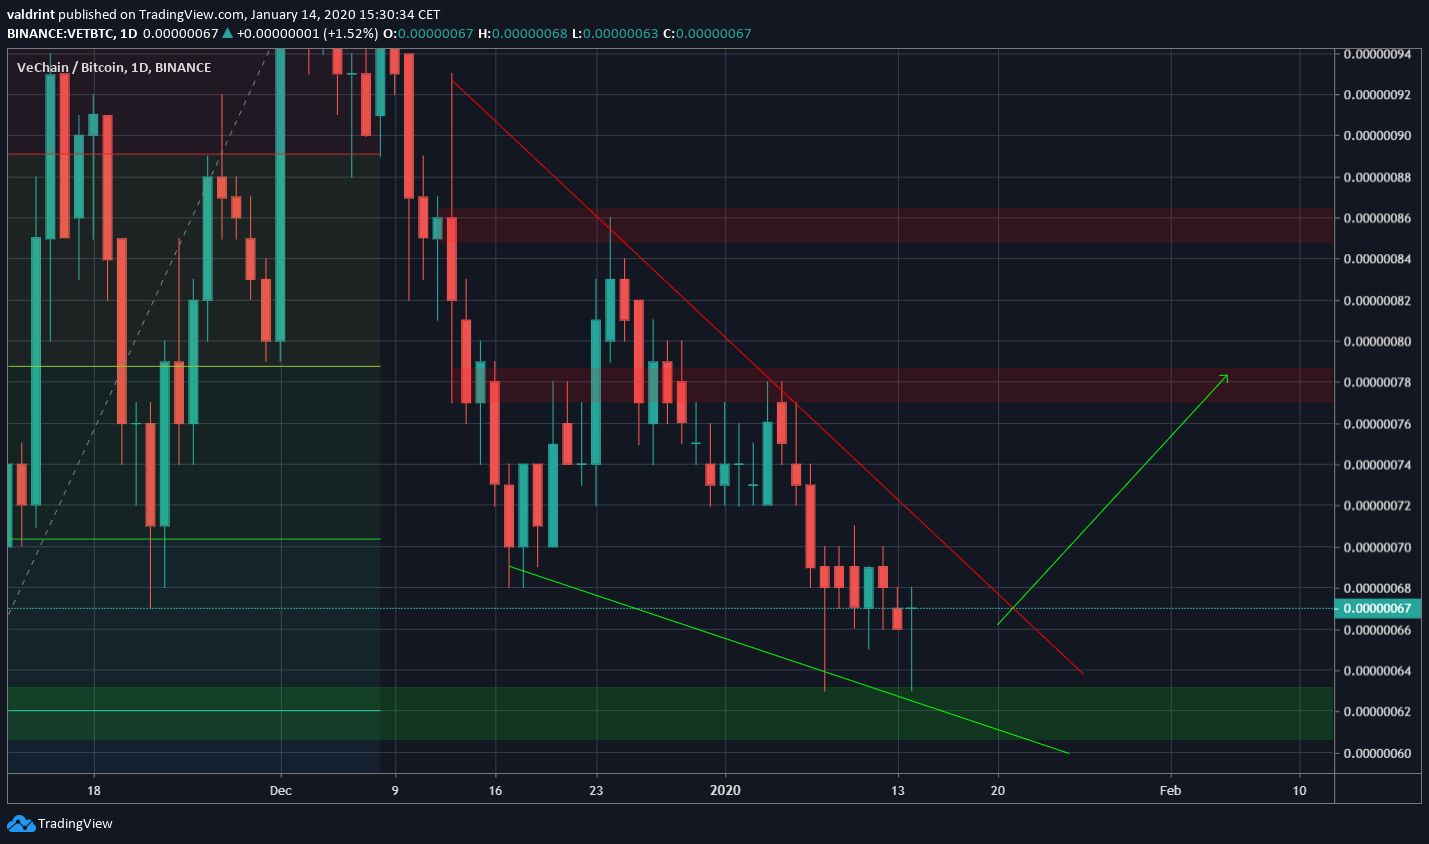
To conclude, after an upward move that was finished on December 2, 2019, the VET price has likely completed an A-B-C correction. The ensuing breakout could take the price between 78-86 satoshis.


