


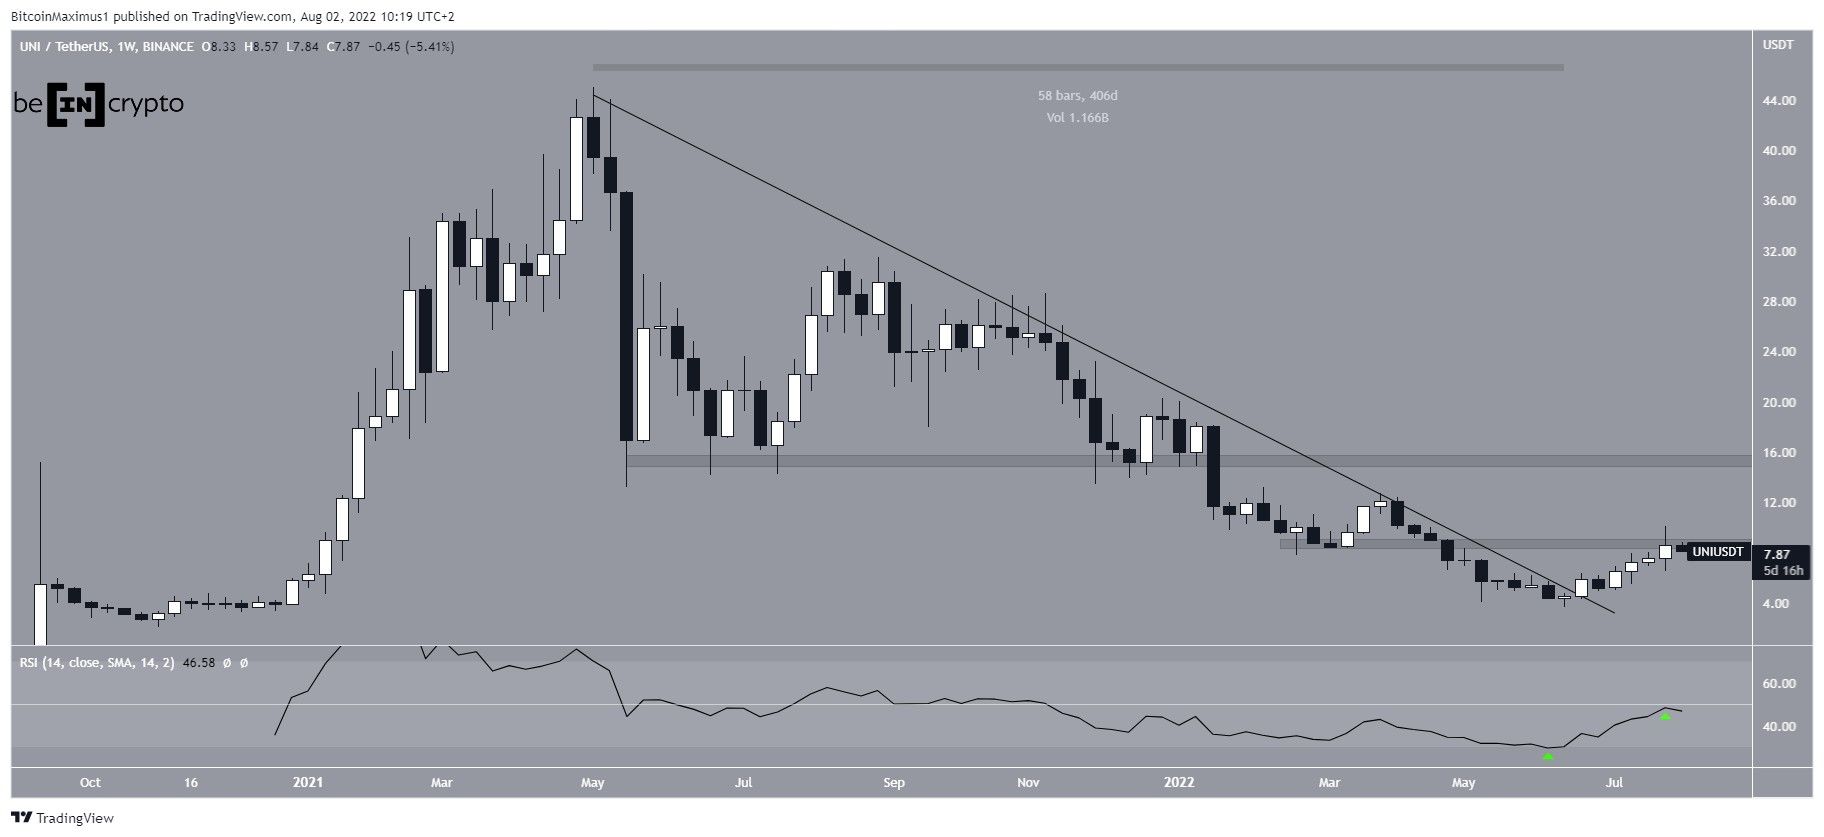
Uniswap (UNI) is attempting to create a higher low after breaking out from a long-term descending resistance line.
UNI has been falling underneath a descending resistance line since reaching an all-time high price of $45 in May 2021. The downward movement led to a low of $3.33 in June. This was also combined with an all-time low value in the weekly RSI (green icon).
However, the price has been increasing since and broke out from the line. At the time of the breakout, the line had been in place for 406 days. Breakouts from such long-term structures usually mean that the preceding trend has come to an end.
So far, the price has reached a high of $9.83. But it has failed to reach a close above the $8.40 horizontal resistance area. Additionally, the weekly RSI has failed to move above 50.
Both of these would be required in order to confirm the bullish trend reversal. In that case, the next resistance area would be at $15.
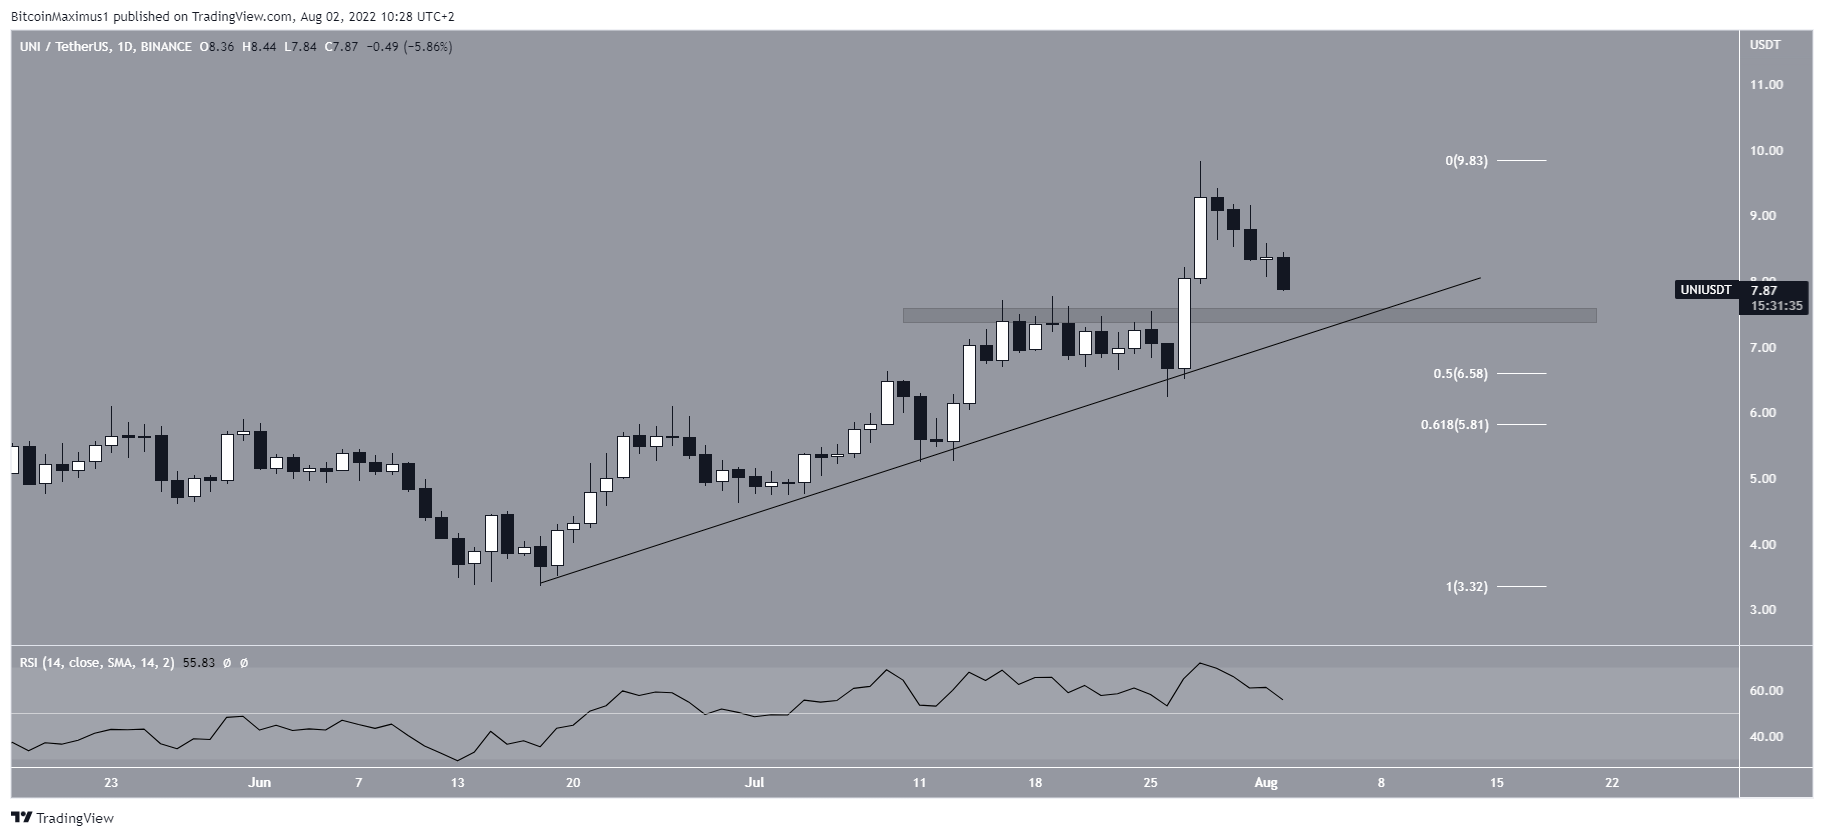
Short-term support
The daily chart shows that UNI has been following an ascending support line since June 18. Currently, the line is at $7.45, coinciding with a horizontal support level. Therefore, it is possible that the line causes a bounce. This possibility is also supported by the daily RSI, which seems to be approaching the 50 line from above.
If a breakdown were to occur, the 0.5-0.618 Fib retracement support levels at $5.80 to $6.60 would be likely to create a higher low, in turn resuming the upward movement.
UNI wave count analysis
Cryptocurrency trader @Thetradinghubb tweeted a chart of UNI, stating that the price might have begun a new long-term bullish reversal.
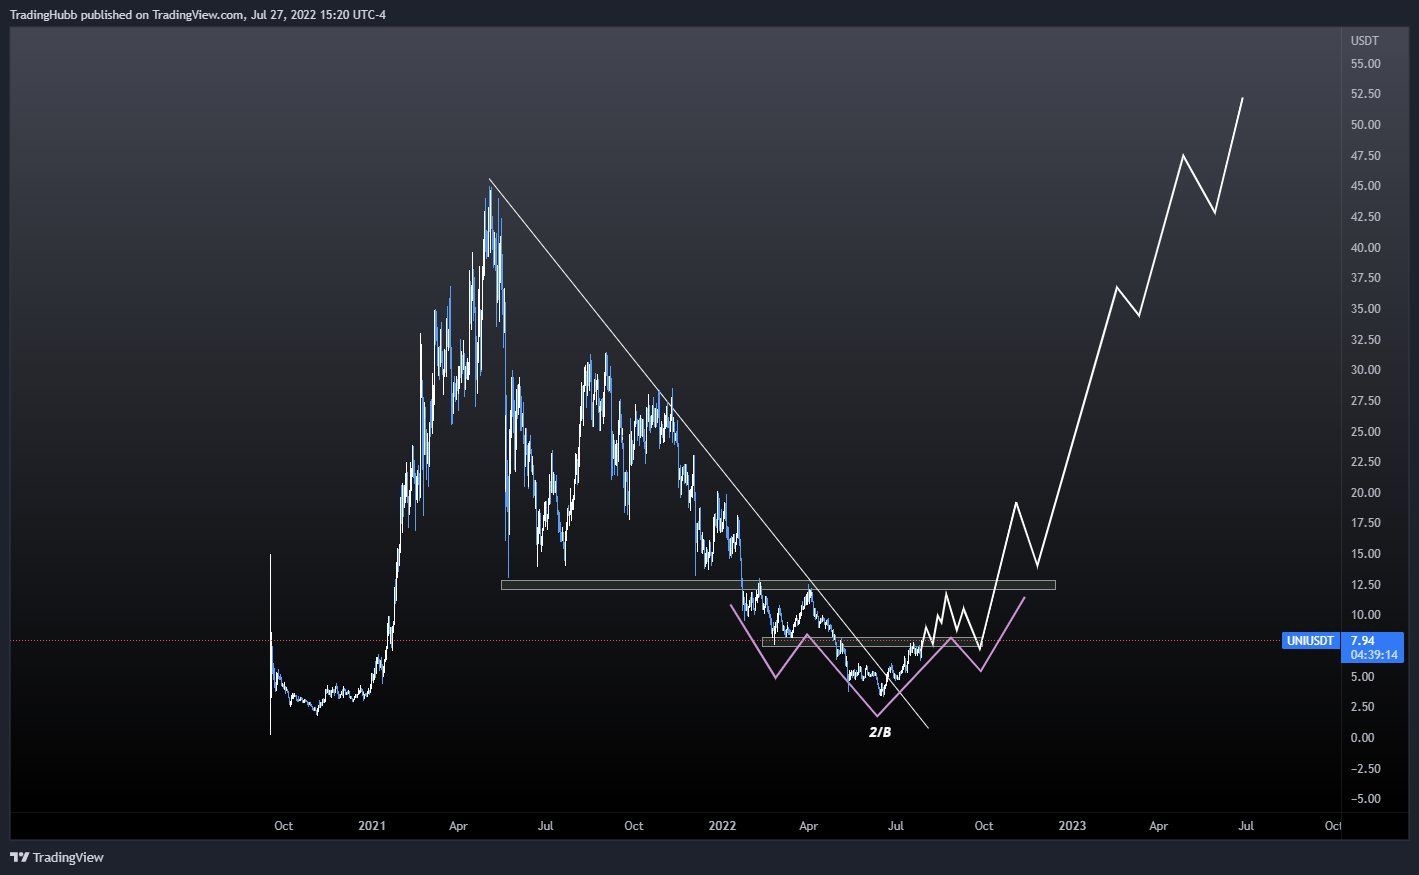
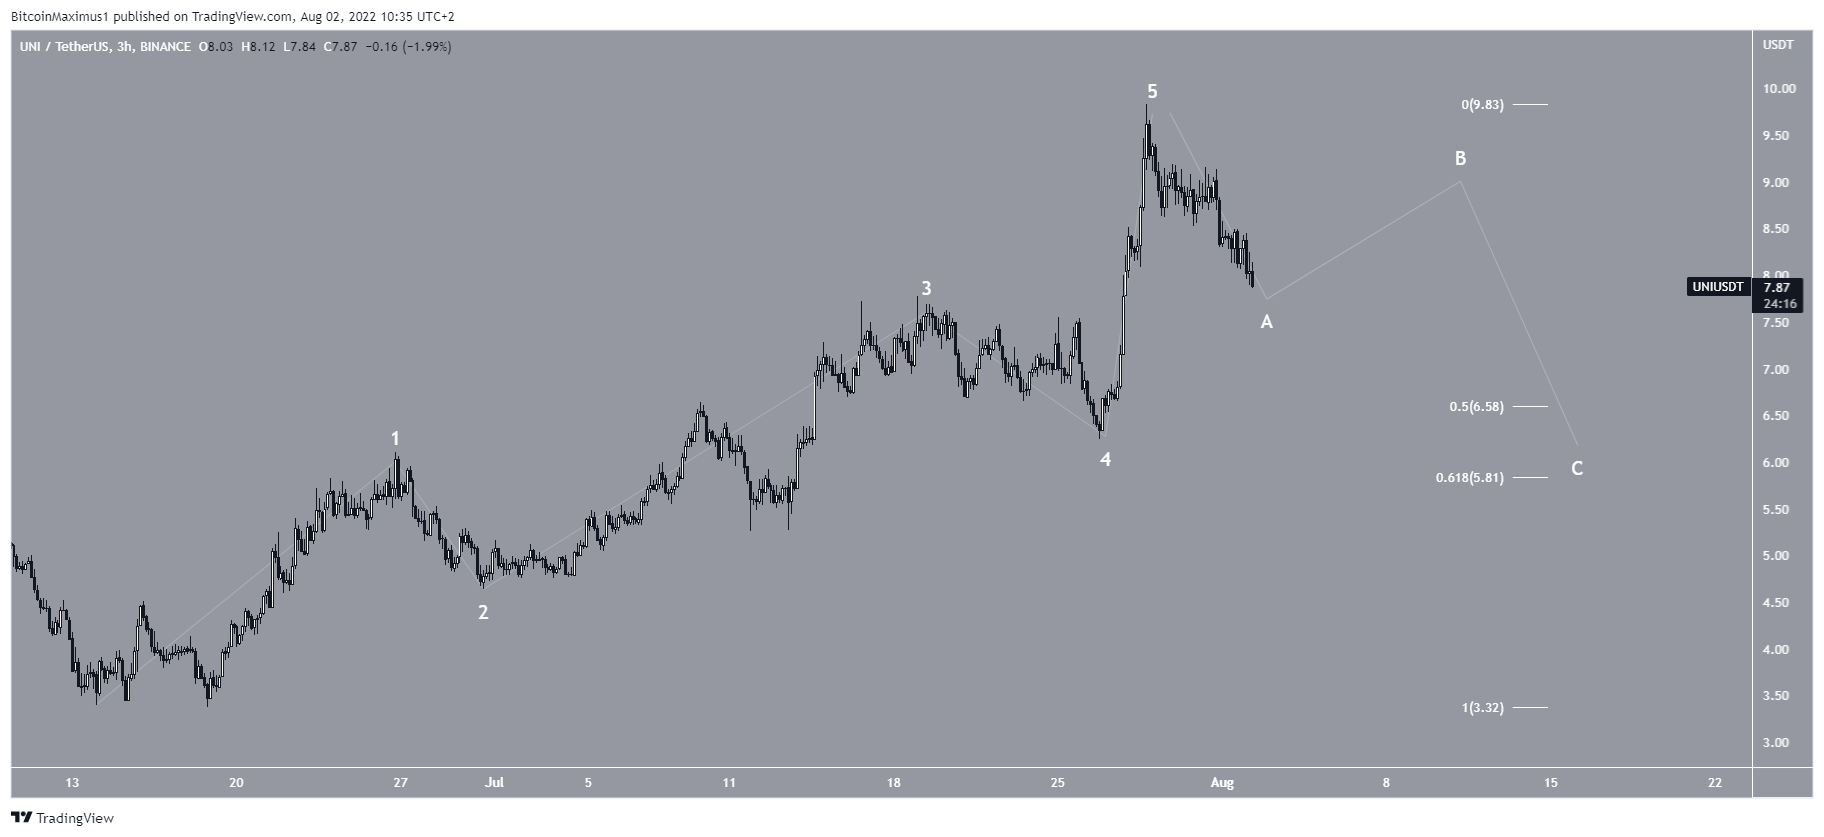
The most likely wave count suggests that UNI has completed a five-wave upward movement, and is now in the process of completing an A-B-C corrective structure. If so, it is currently nearing the bottom of wave A.
The most likely area for the correction to come to an end if between the 0.5-0.618 Fib retracement support levels at $5.80 – $6.60. A decrease to the 0.618 level at $5.80 would also sweep the lows of wave four, making it an ideal place for a bottom.
Afterward, the upward movement towards the $15 horizontal resistance area would be expected to continue.
For Be[in]Crypto’s latest Bitcoin (BTC) analysis, click here
