The Uniswap (UNI) price has broken out from an important resistance area and validated it as support afterward. As long as UNI is trading above this support, it is expected to continue increasing towards the resistance areas outlined below.
Similarly, the DeFi index is expected to continue increasing towards its closest resistance area.
UNI Reclaims Support Level
On Nov. 5, the UNI price reached a low of $1.75 and began to move upwards. Up to this point, UNI has reached a local high of $4.48 before decreasing slightly.
The price has reclaimed the previous resistance area of $3.50 and validated it as support afterward.
Since the aforementioned low, the price has also been following an ascending support line and is currently just above it.
As long as the price is trading above this support line and the $3.50 level, it is expected to continue moving upwards towards the next resistance area at $5.40.
Technical indicators support this bullishness. The RSI and MACD are increasing, the former being above 50 while the latter above 0.

Possible Breakout
Cryptocurrency trader @TheEuroSniper outlined a UNI chart which shows that the price has flipped an important resistance area.
The resistance area coincides with that which we have outlined, and the price is expected to continue increasing as long as it is trading above it.

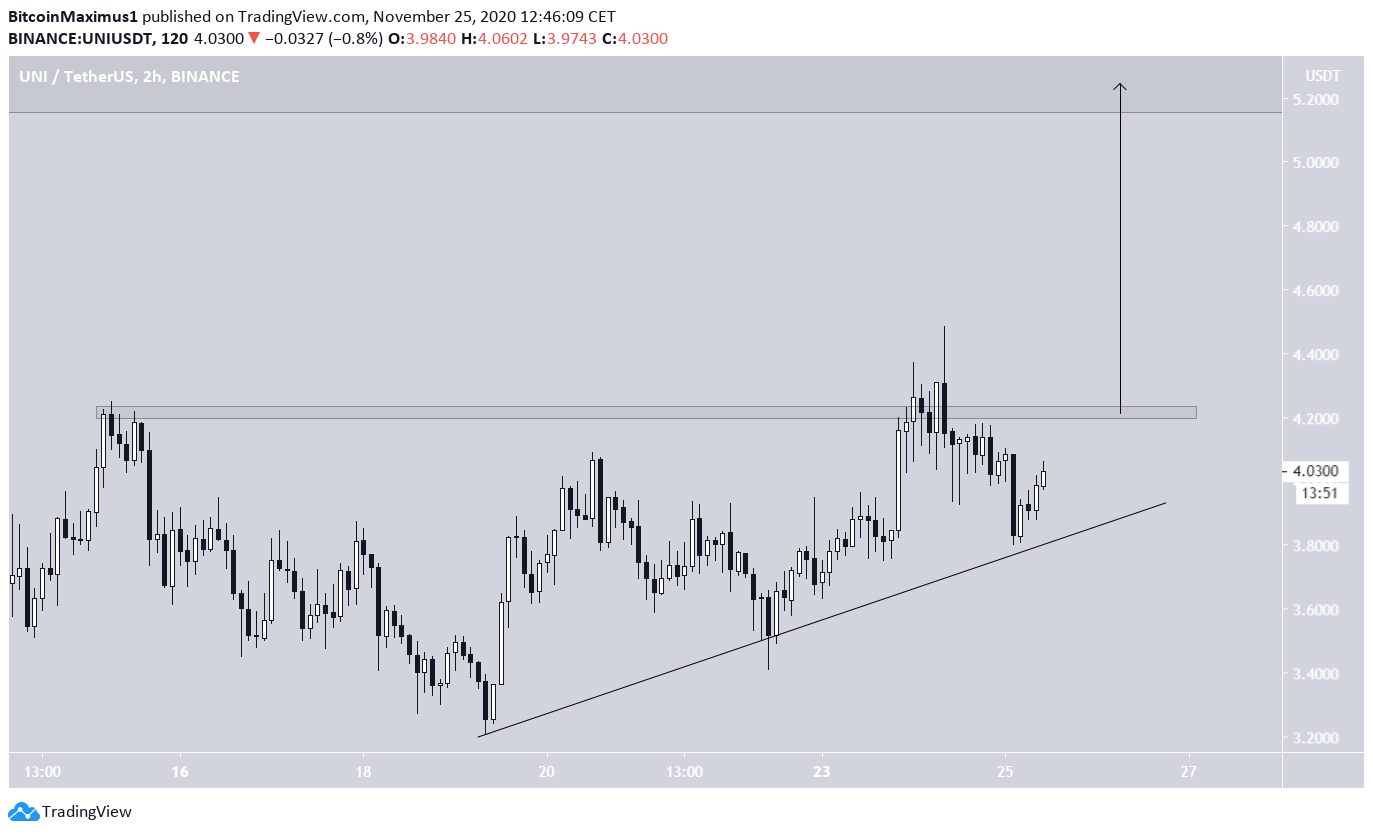
The 2-hour chart shows UNI possibly trading in an ascending triangle.
Since the ascending triangle is normally considered a bullish pattern, a breakout would be expected.
A breakout that travels the entire height of the pattern would take UNI to the previously mentioned $5.40 resistance area.
The DeFi Index
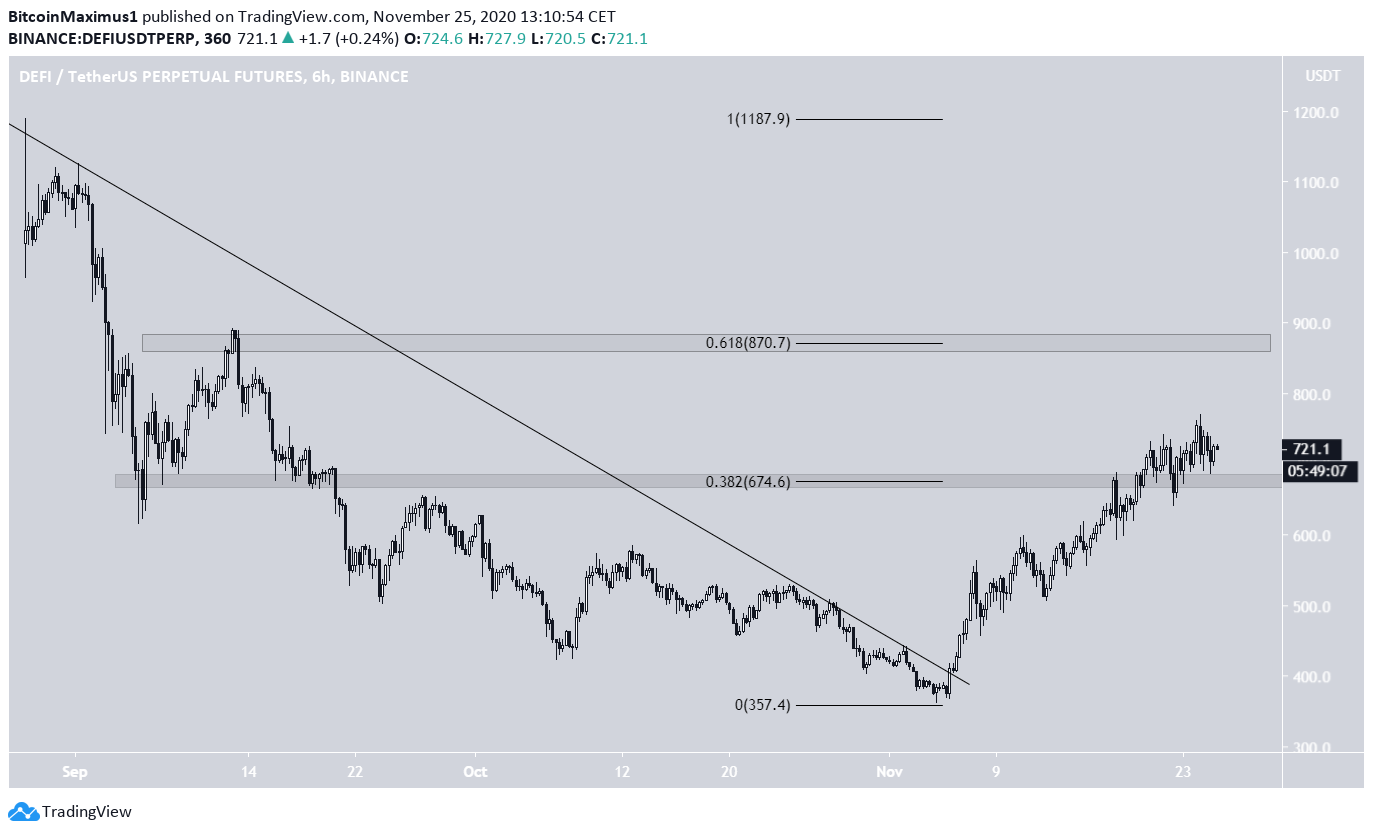
The DeFi index has also been increasing since breaking out from a descending resistance line on Nov. 6. It has reclaimed the first resistance area at $675 and validated it as support after.
The DeFi index is expected to continue increasing towards the next significant resistance area at $870, which is both a horizontal resistance level and the 0.618 Fib retracement level of the entire downward move.
Conclusion
Both the UNI price and the DeFi index are expected to continue increasing, the former toward $5.40 and the latter toward $870.
For BeInCrypto’s latest Bitcoin analysis, click here!
Disclaimer: Cryptocurrency trading carries a high level of risk and may not be suitable for all investors. The views expressed in this article do not reflect those of BeInCrypto
Disclaimer
In line with the Trust Project guidelines, this price analysis article is for informational purposes only and should not be considered financial or investment advice. BeInCrypto is committed to accurate, unbiased reporting, but market conditions are subject to change without notice. Always conduct your own research and consult with a professional before making any financial decisions. Please note that our Terms and Conditions, Privacy Policy, and Disclaimers have been updated.
