


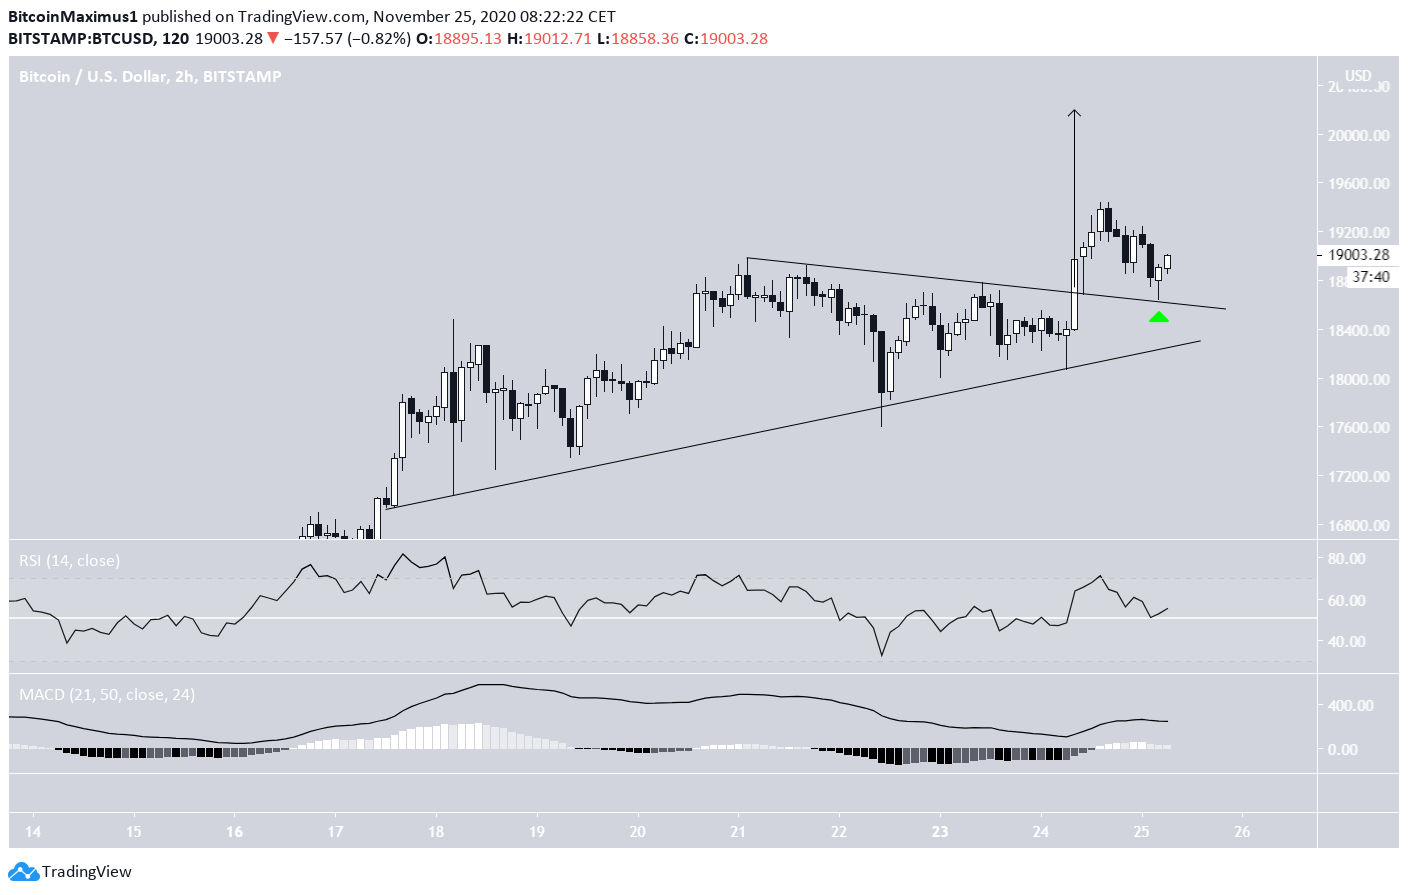
On Nov. 24, BTC broke out from a symmetrical triangle and proceeded to reach a high of $19,418.
The price has returned to validate the breakout level since and is expected to continue moving upwards.
Bitcoin Turns On the Heat
The BTC price had been trading inside a symmetrical triangle since Nov 18.
Yesterday, the price broke out from this triangle, returned to validate it as support (shown with the green arrow below), and has begun to move upwards.
Both the RSI and MACD support a continued price increase.
A breakout that travels the entire height of the pattern would take BTC slightly above $20,000.
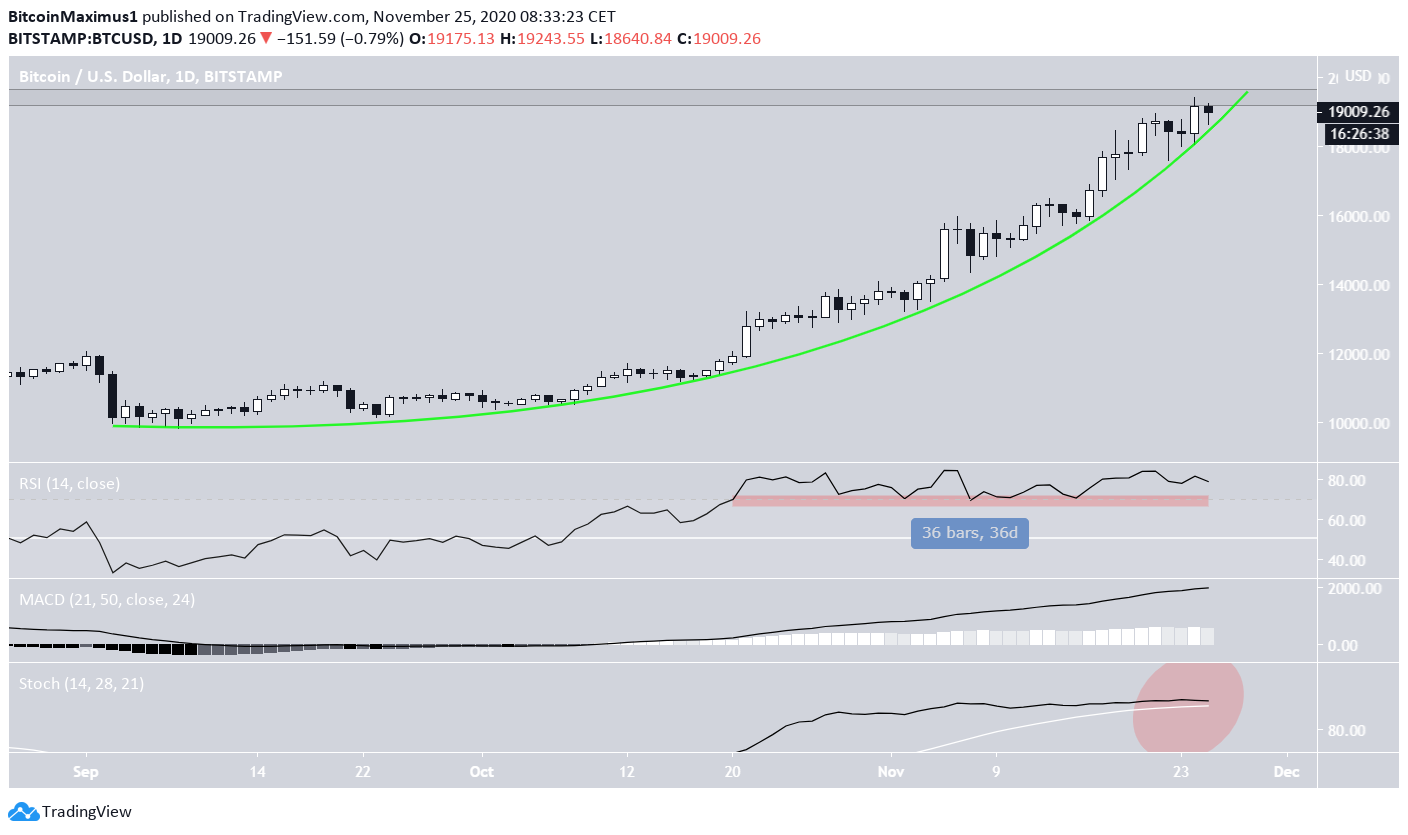
Future Movement
The daily chart shows just how overextended this rally has become. The price has been following a parabolic ascending support line since the beginning of September and is currently nearing the all-time high resistance area of $19,500.
Besides generating numerous bearish divergences, the RSI has been overbought for 36 days without dropping and the Stochastic oscillator is very close to making a bearish cross.
However, as long as the parabolic support line stays intact, BTC is expected to continue increasing.
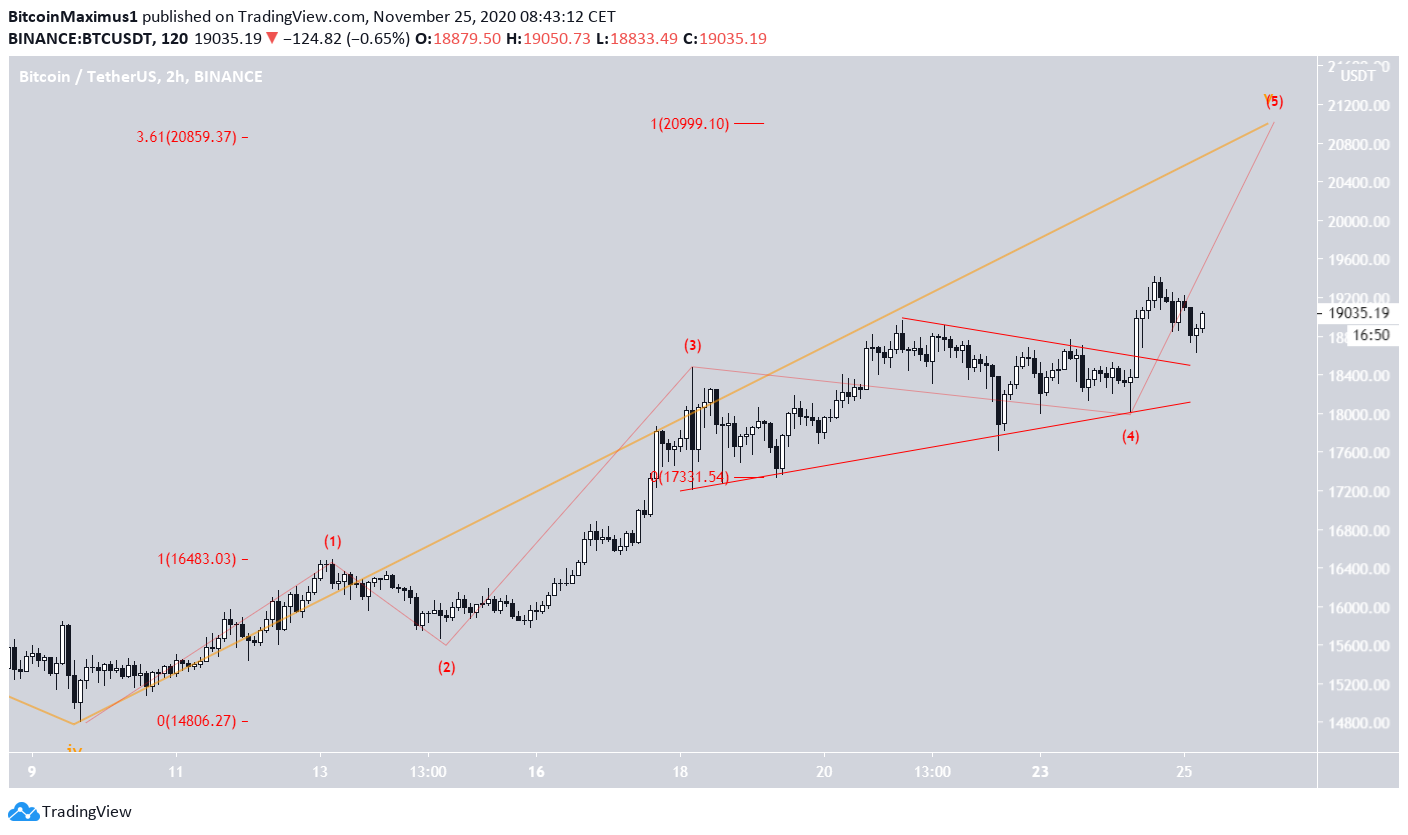
BTC Wave Count
The BTC price is likely in the fifth-and-final wave of a bullish impulse (shown in orange below). In addition, it is likely in the fifth-and-final sub-wave (red) of this same impulse.
The most likely area to act as the top is found between $20,855-$21,000. This is an area that coincides with the 3.61 Fib extension of sub-wave 1 and the projection of sub-waves 1-3 to the bottom of sub-wave 4.
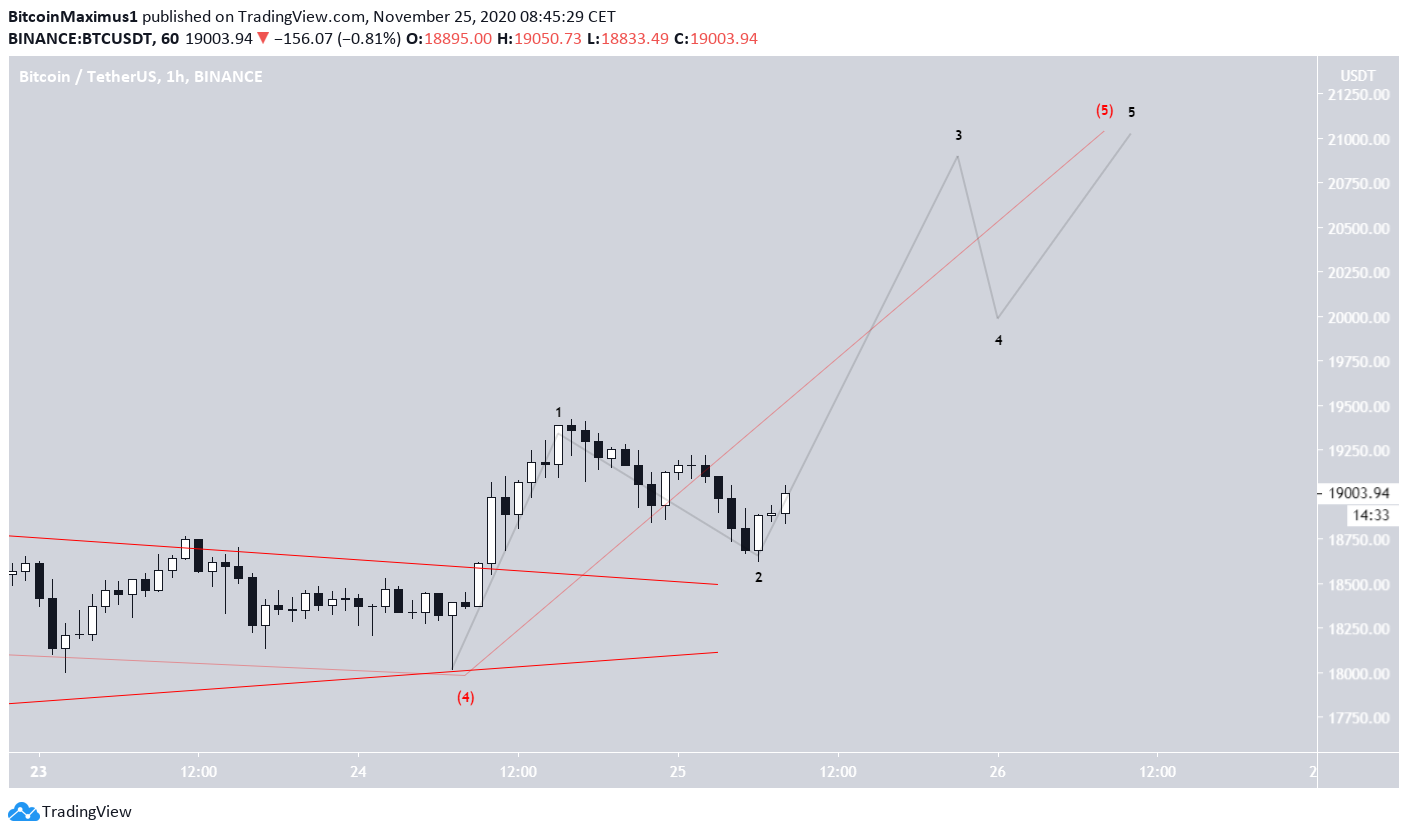
If the count is accurate, the minor sub-wave count (shown in black) would be similar to that shown in the chart below. This could indicate that BTC has two more legs to the upside before it reaches a top.
Conclusion
The BTC price is expected to continue increasing and possibly reach a high near $21,000 before beginning a corrective movement.
For BeInCrypto’s previous Bitcoin analysis, click here!
Disclaimer: Cryptocurrency trading carries a high level of risk and may not be suitable for all investors. The views expressed in this article do not reflect those of BeInCrypto


