


The price of UNI, the governance token of the Ethereum-based decentralized exchange Uniswap, has maintained a steady decline since June 18, forming a descending triangle.
Currently trading at $8.84, the altcoin is poised to fall below its critical support level of $8.73, which has been formed since May 23.
Uniswap’s Bulls Must Defend Support
A descending triangle pattern is formed when an asset’s price creates lower highs while maintaining a relatively stable support level. Once the price breaks below the support level, the price decline often continues, confirming the bearish trend.
An assessment of some of UNI’s technical indicators confirmed the possibility of this happening. Firstly, readings from its Parabolic Stop and Reverse (SAR) indicator show a significant bearish bias toward the altcoin.
As of this writing, the dots of this indicator are lined above UNI’s price, and they have been so positioned since June 24.
Read More: How To Buy Uniswap (UNI) and Everything You Need To Know
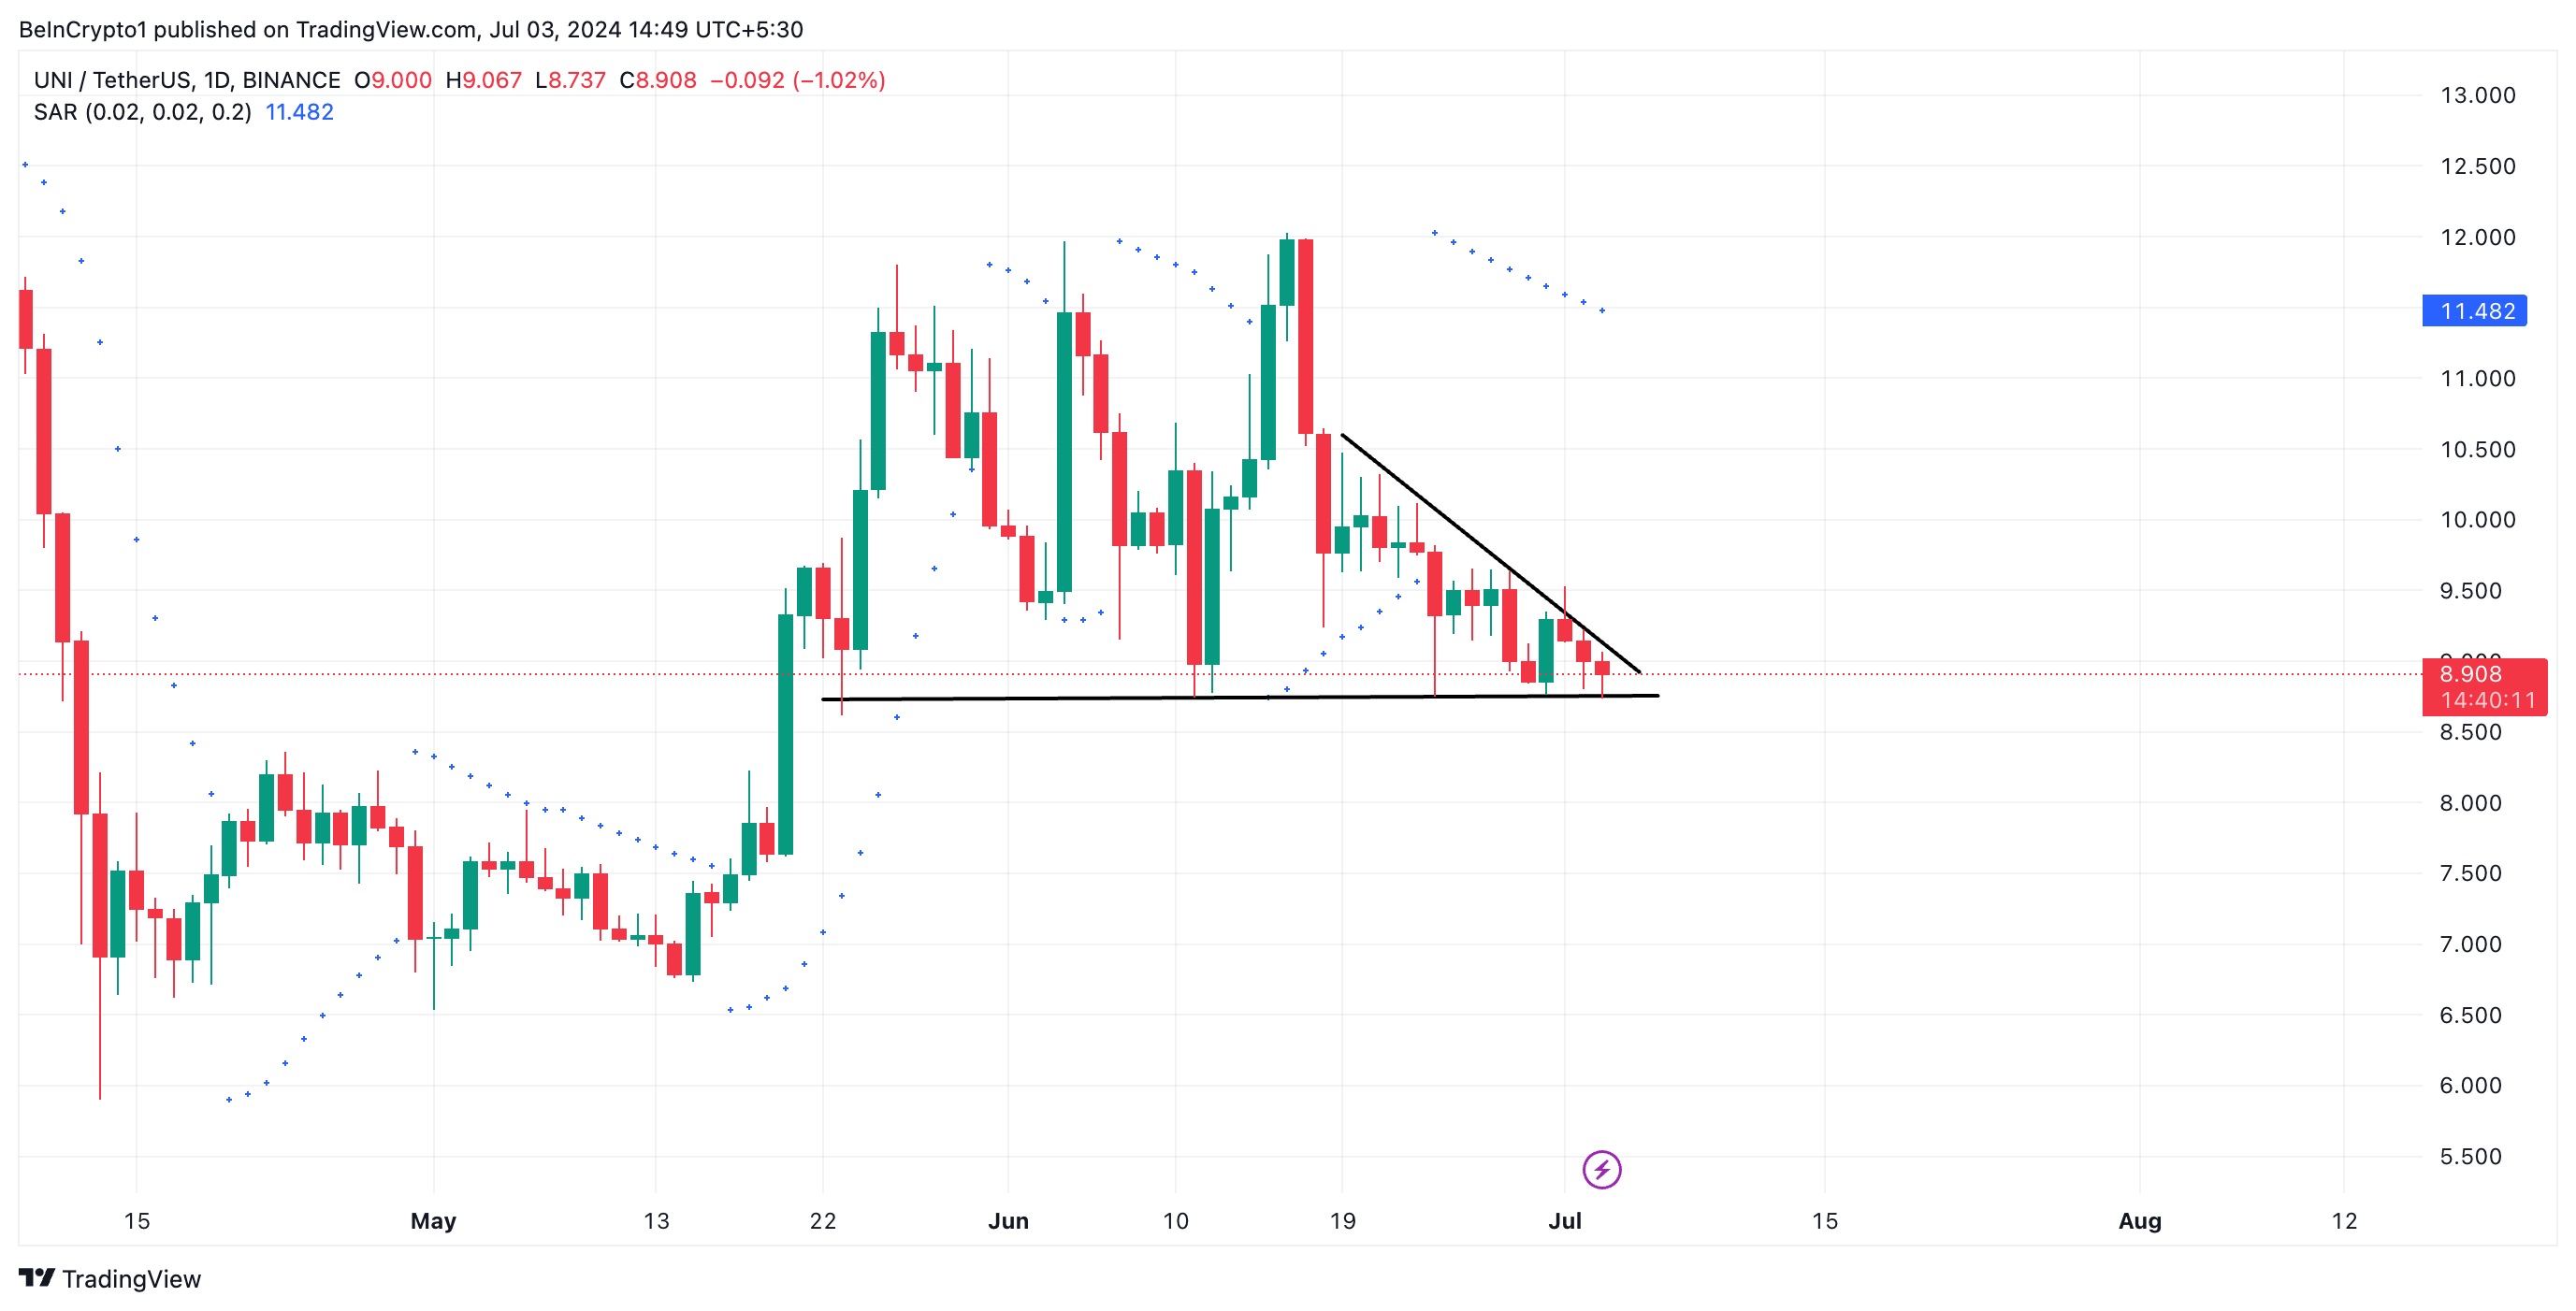
This indicator tracks an asset’s price movements and determines its potential reversal points. When its dots are above the asset’s price, it confirms that the market is downtrend, and the price decline will continue.
Further, UNI’s negative Chaikin Money Flow (CMF) lends credence to the above position. As of this writing, the indicator’s value is -0.12.
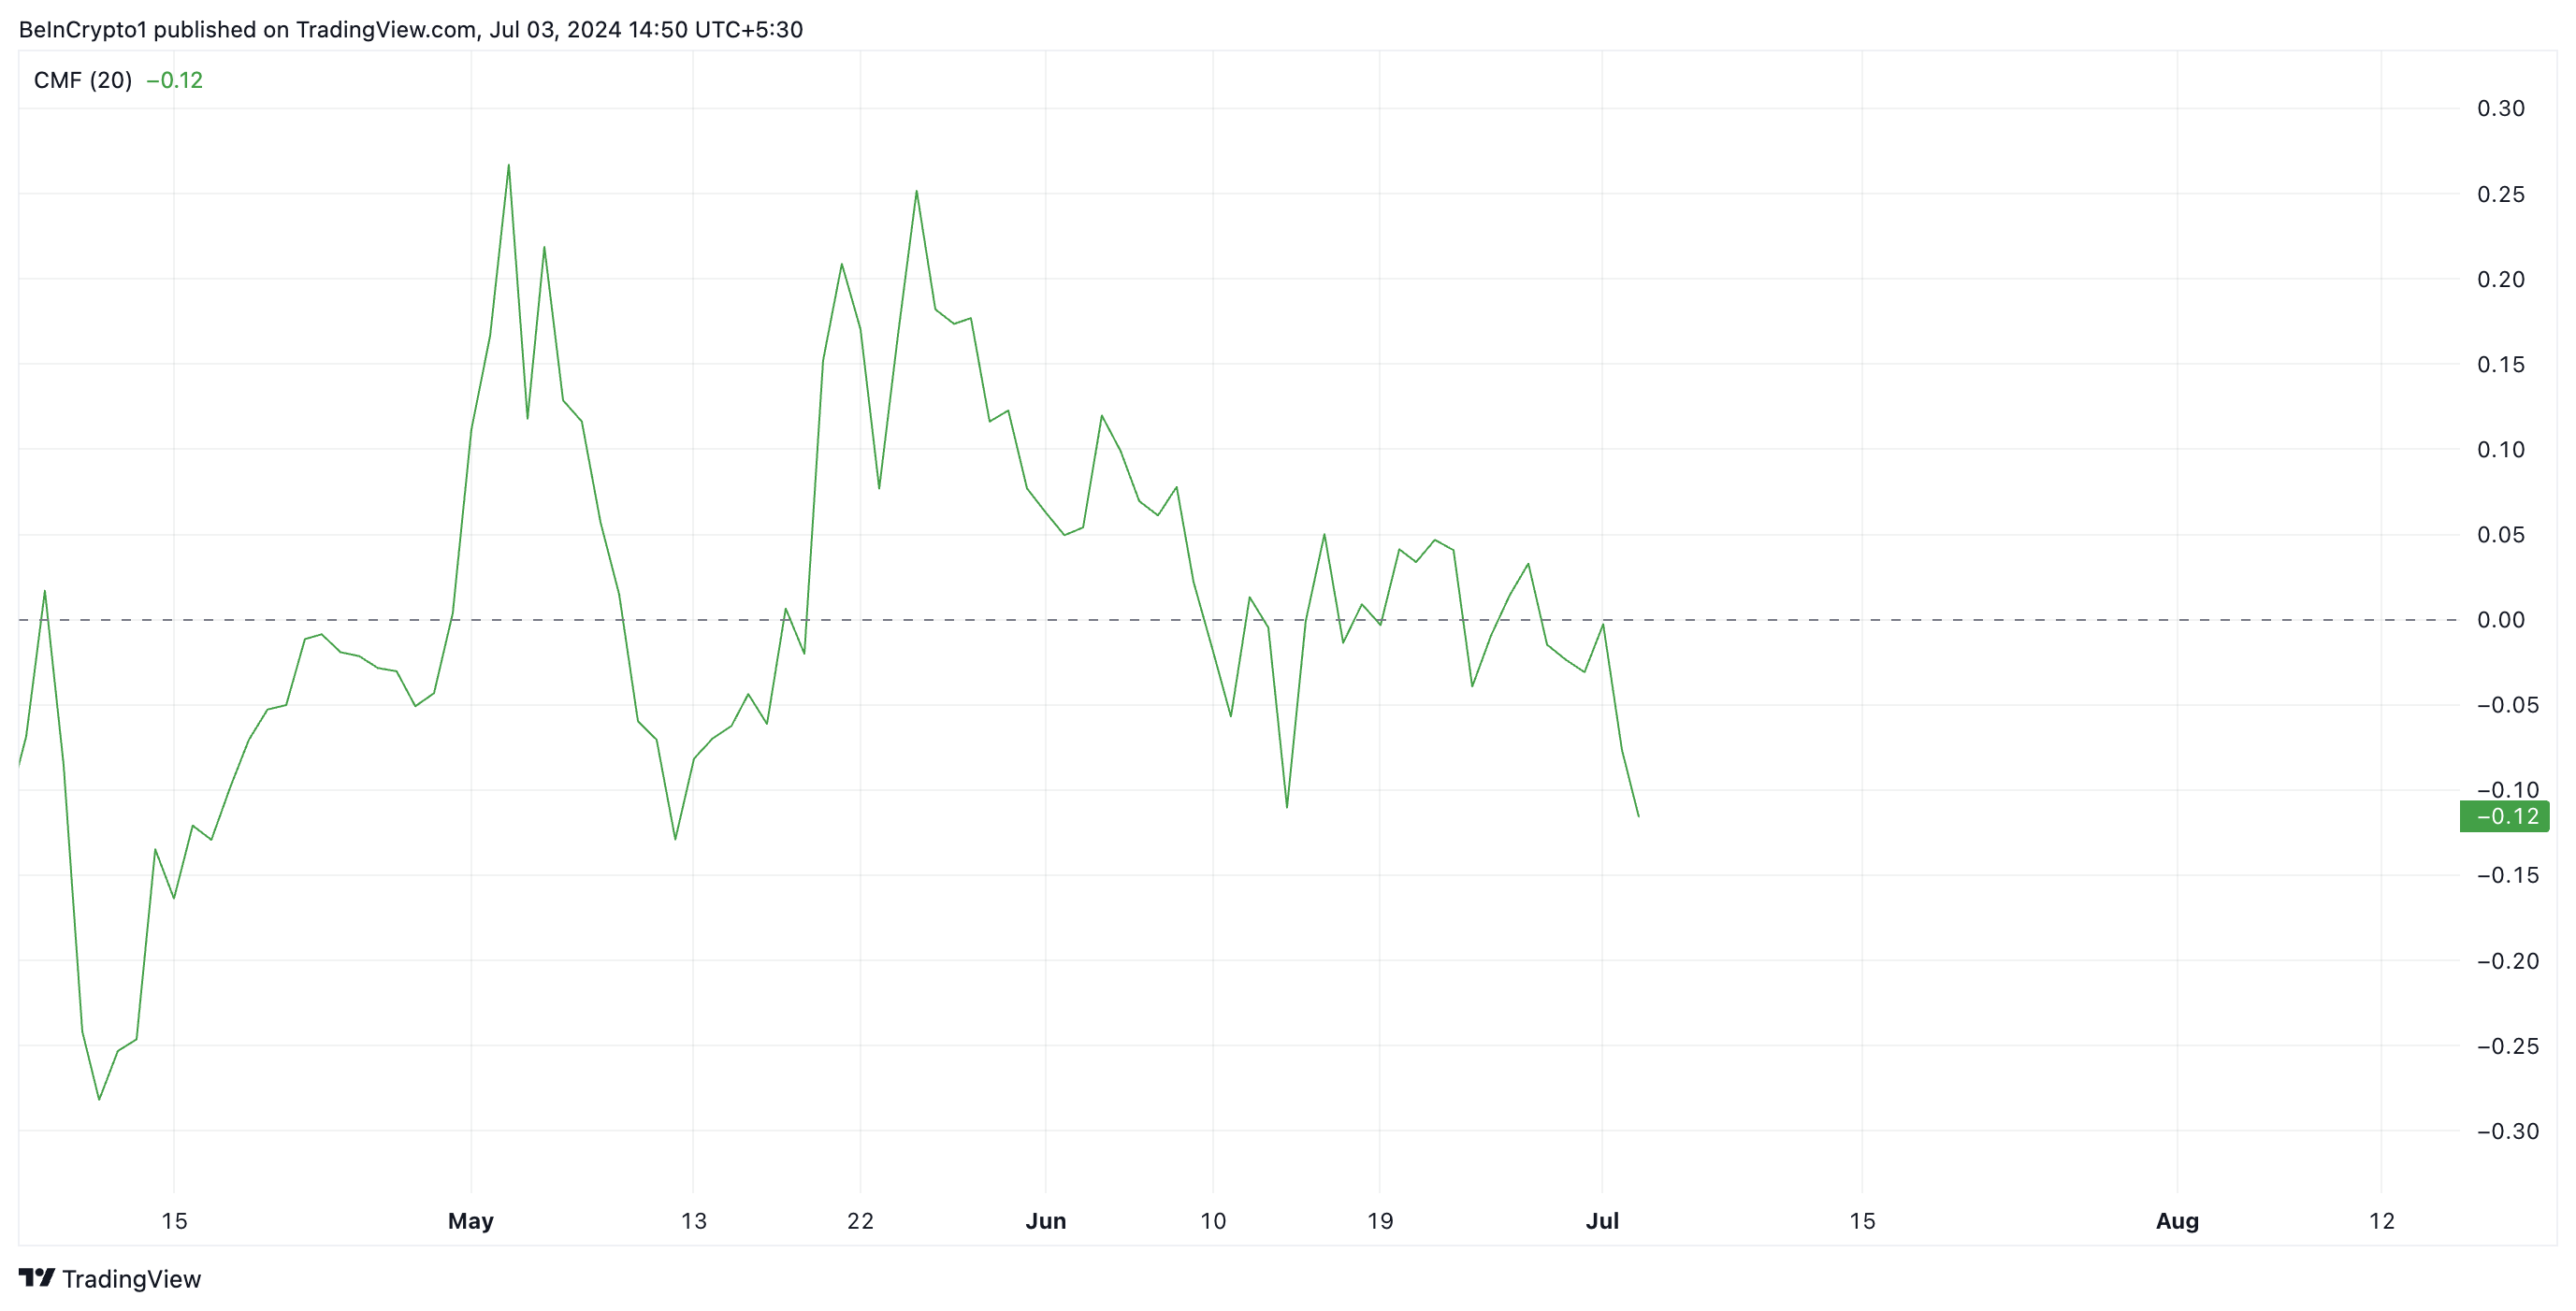
This indicator tracks how money flows into and out of an asset. A negative CMF value indicates market weakness, as it suggests liquidity outflow. A CMF value during a period of price decline is a major indicator of a continued price fall.
UNI Price Prediction: Price May Fall Under Support
The decline in UNI’s demand by market participants heightens the risk of its price falling below support. At press time, its Relative Strength Index (RSI) is trending downward and sits below the neutral 50 mark, currently at 42.91.
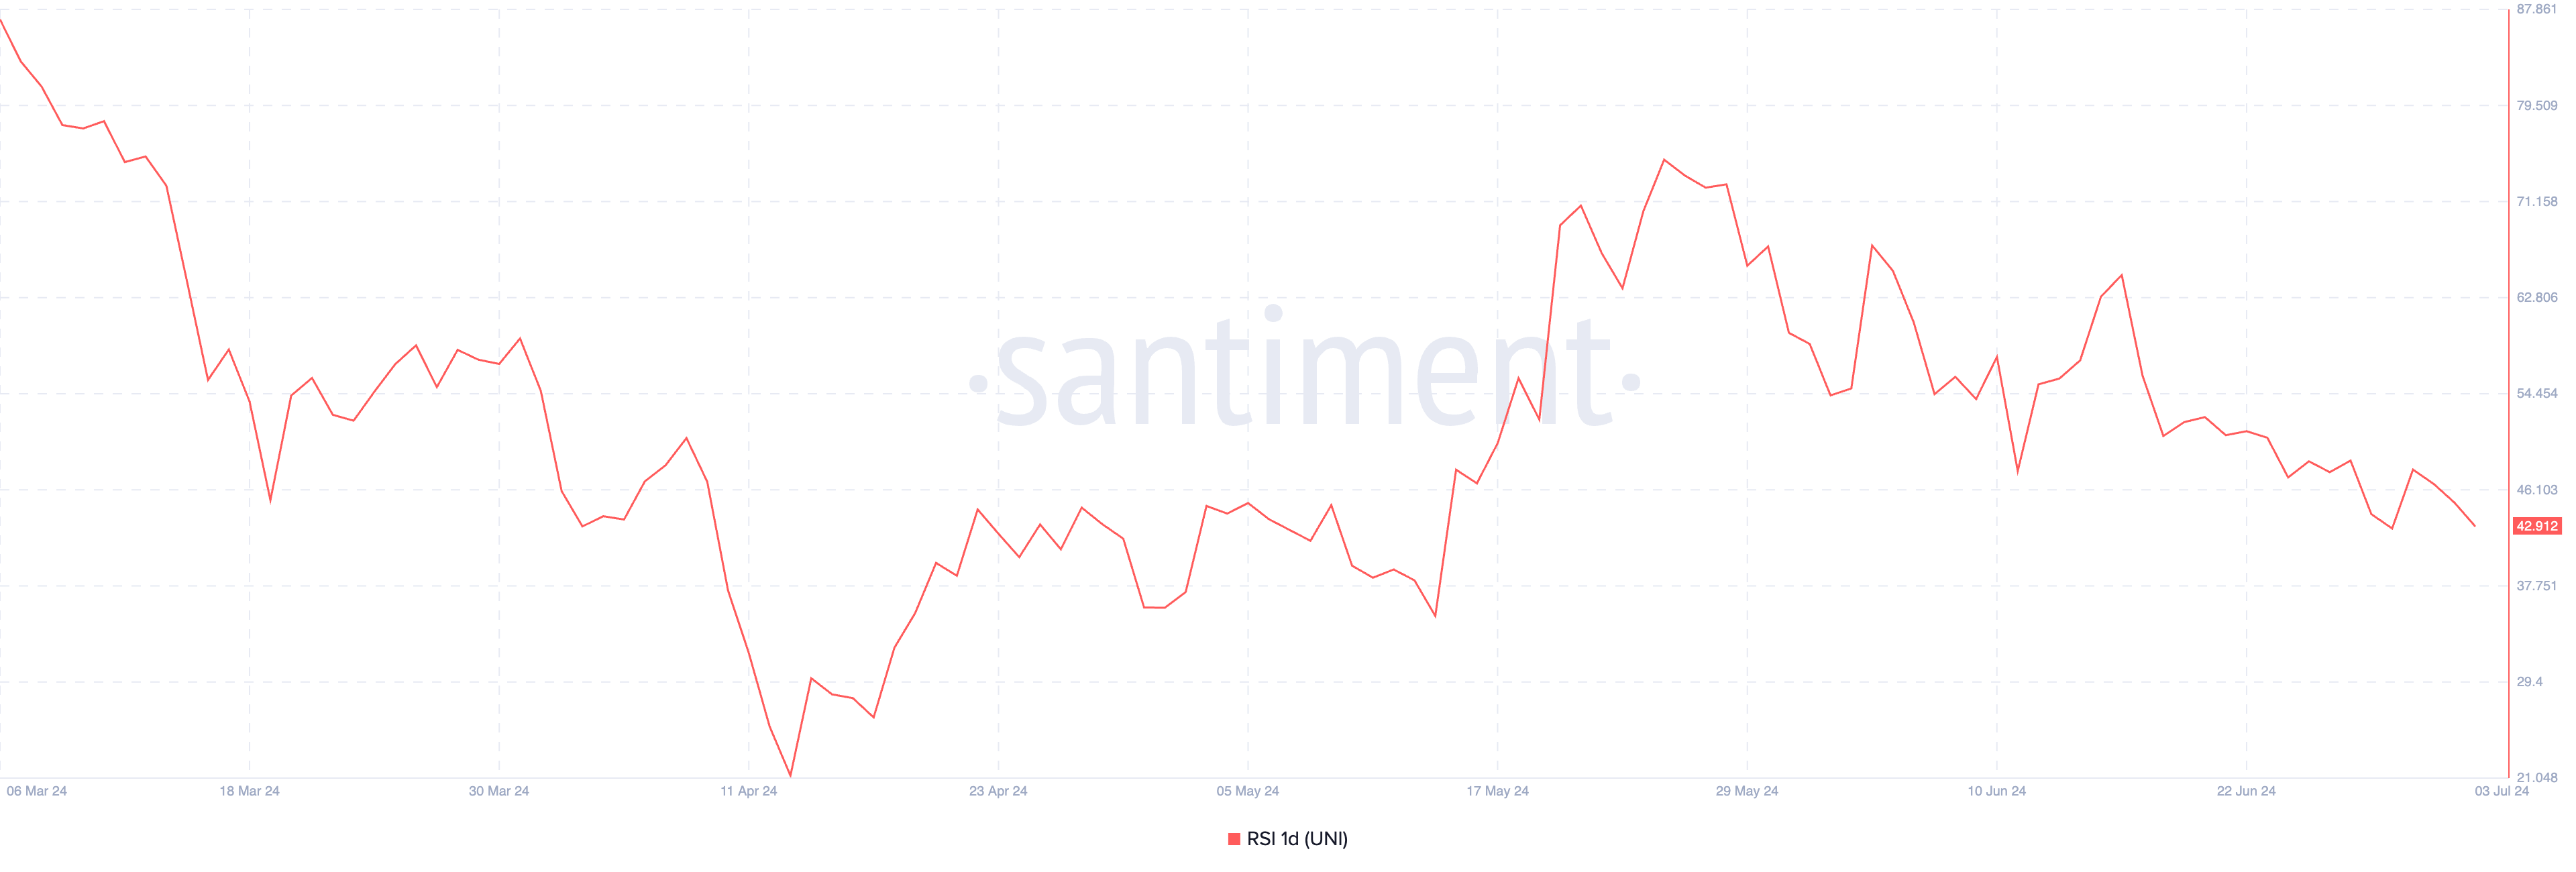
This indicator tracks overbought and oversold conditions in an asset’s market. At 42.91, UNI’s RSI shows that selling pressure outweighs buying activity among traders.
If this trend continues, the token’s price will fall under support to exchange hands at $8.69.
Read More: Uniswap (UNI) Price Prediction 2023/2025/2030
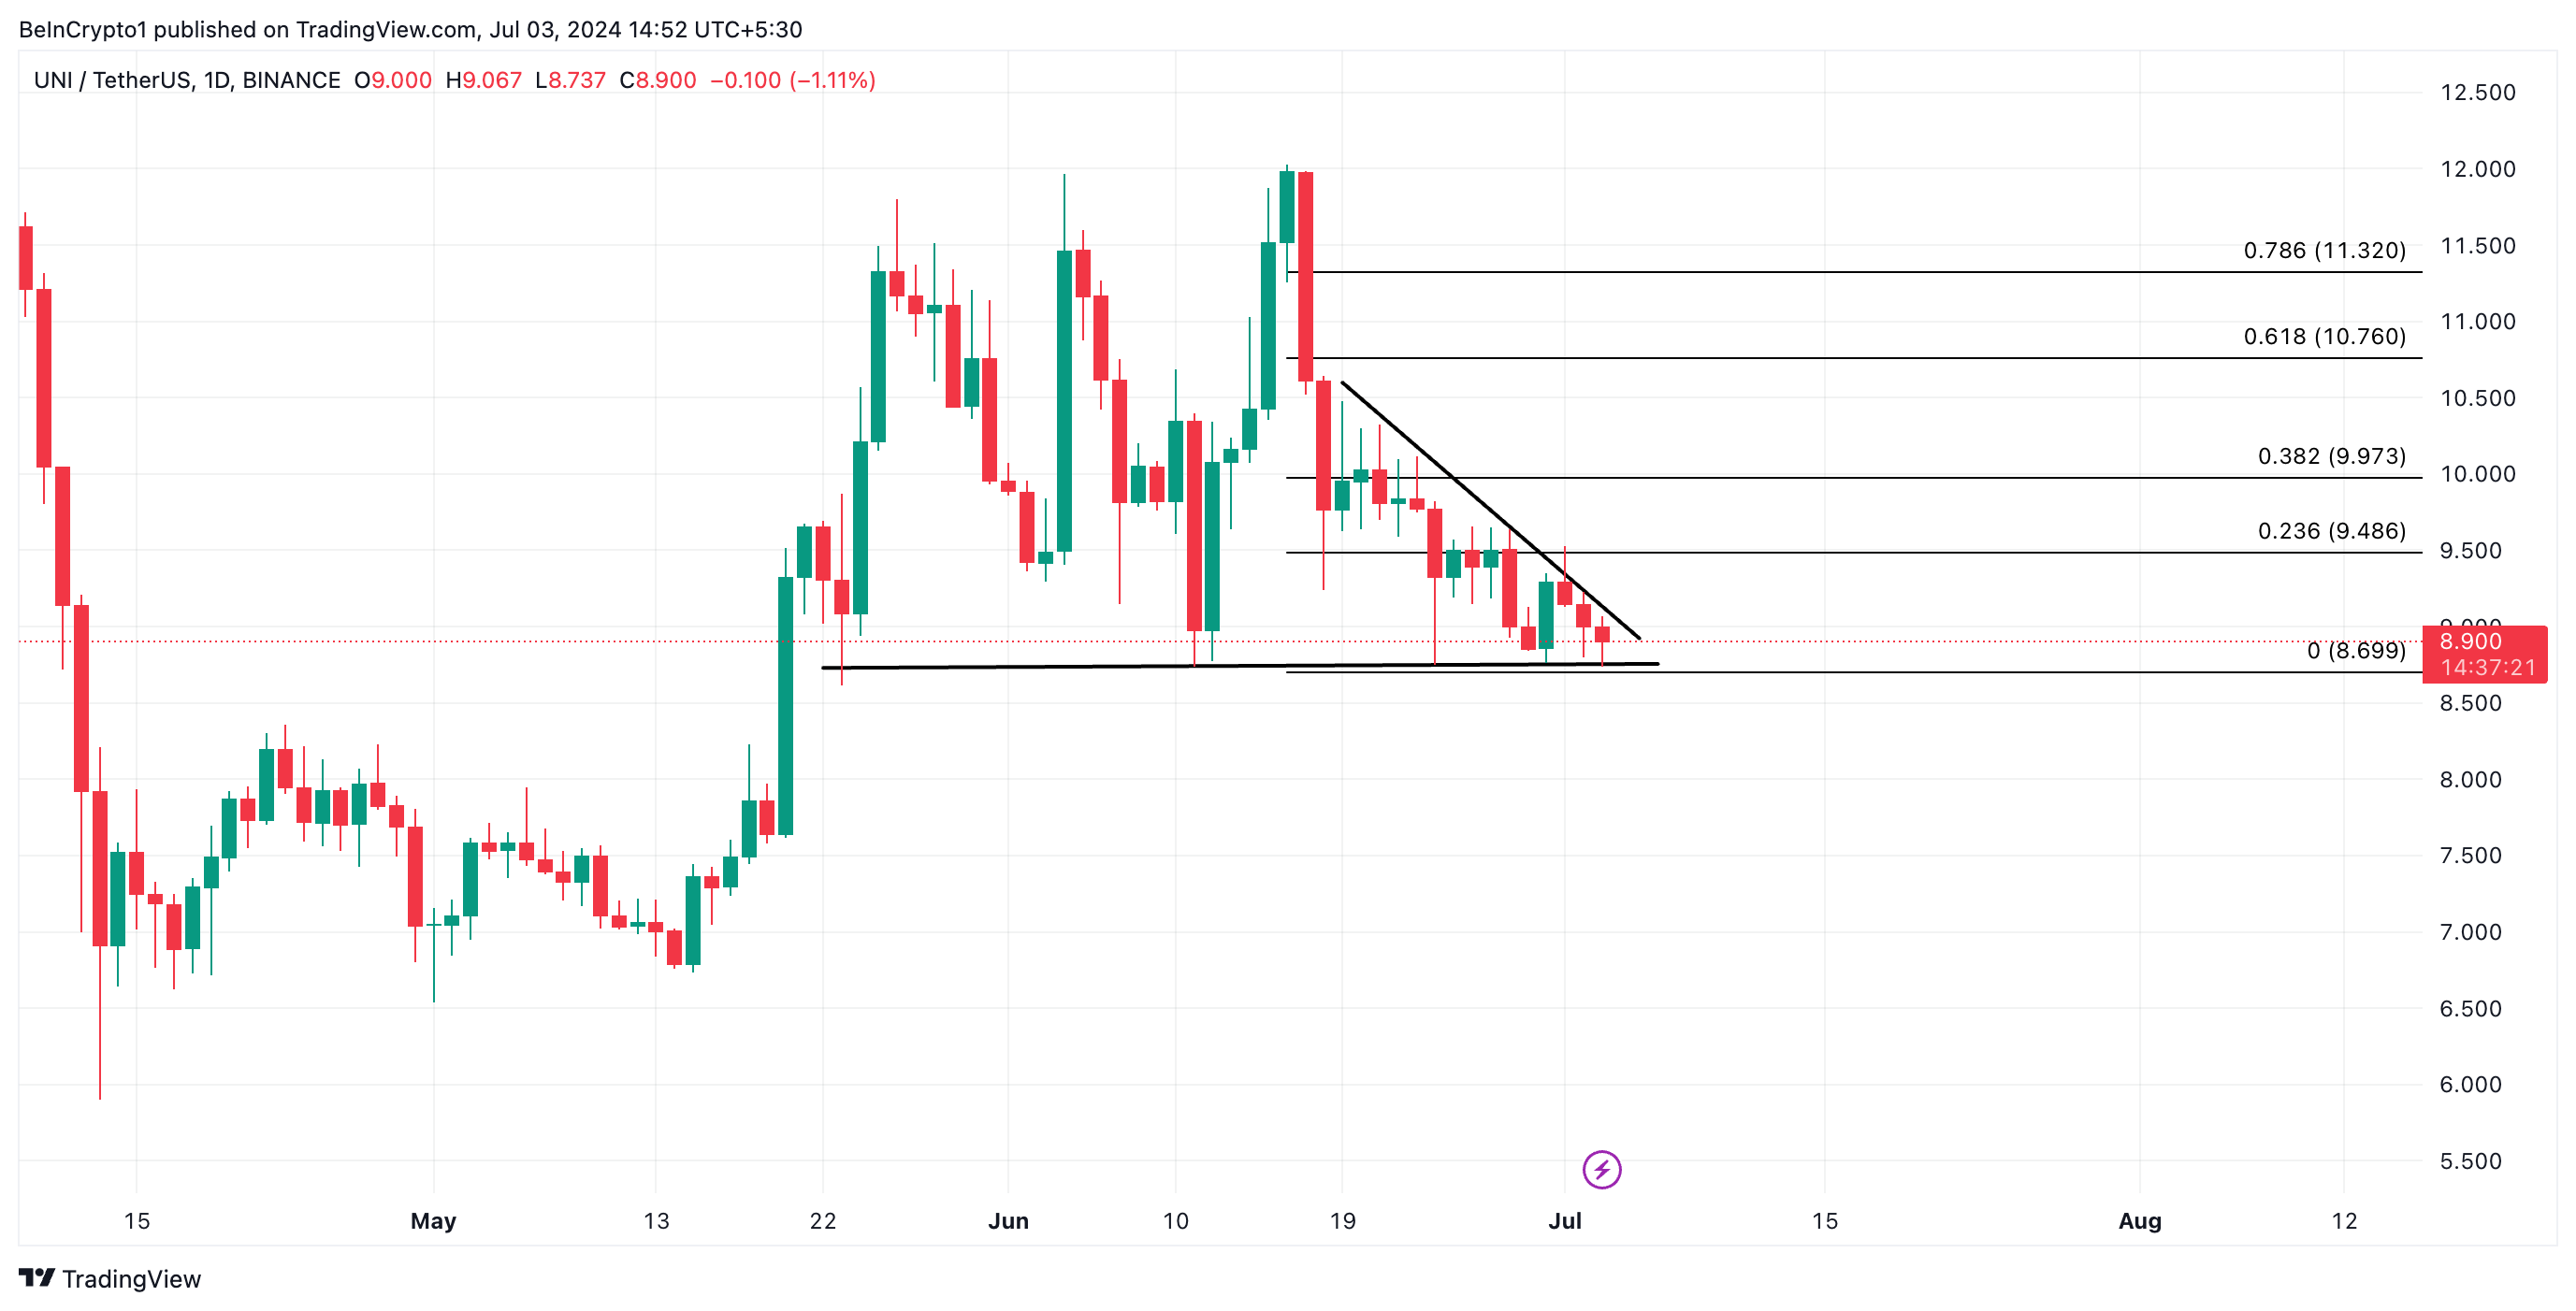
However, if demand begins to climb, this downward projection is invalidated, and UNI’s price will rally toward $9.48.



