


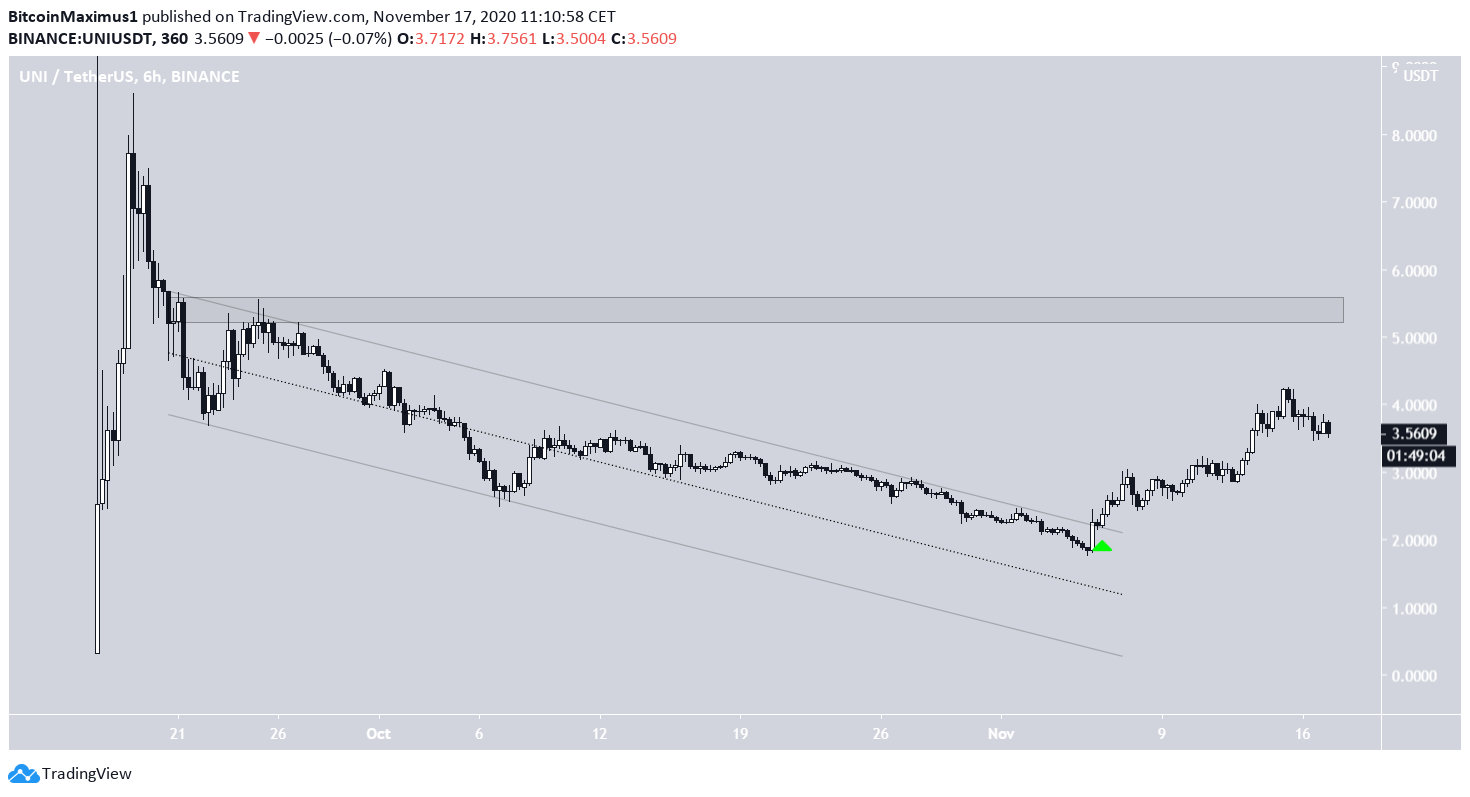
The Uniswap (UNI) price has been increasing since it broke out of a descending channel on Nov 5. The price is currently trading inside an important support area which will be crucial in maintaining the current upward trend.
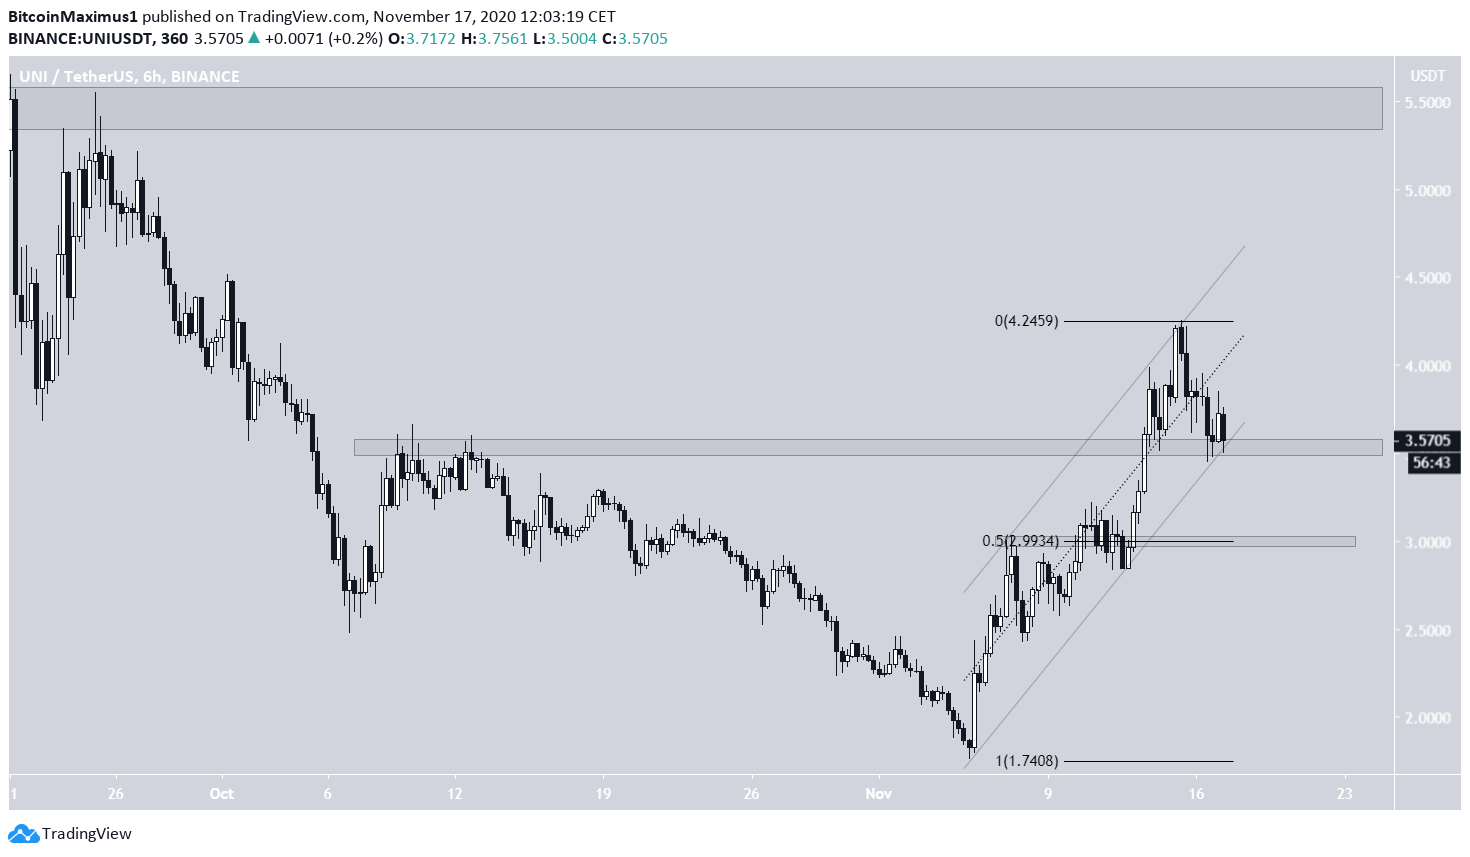
The UNI price had been trading inside a descending parallel channel since Sept 20. On Nov 5, the price reached a low of $1.75 and began an upward move, breaking out from the channel the next day.
Since then, the price has reached a local high of $4.25.
The closest major resistance area is found at $5.50.
UNI at Crucial Support
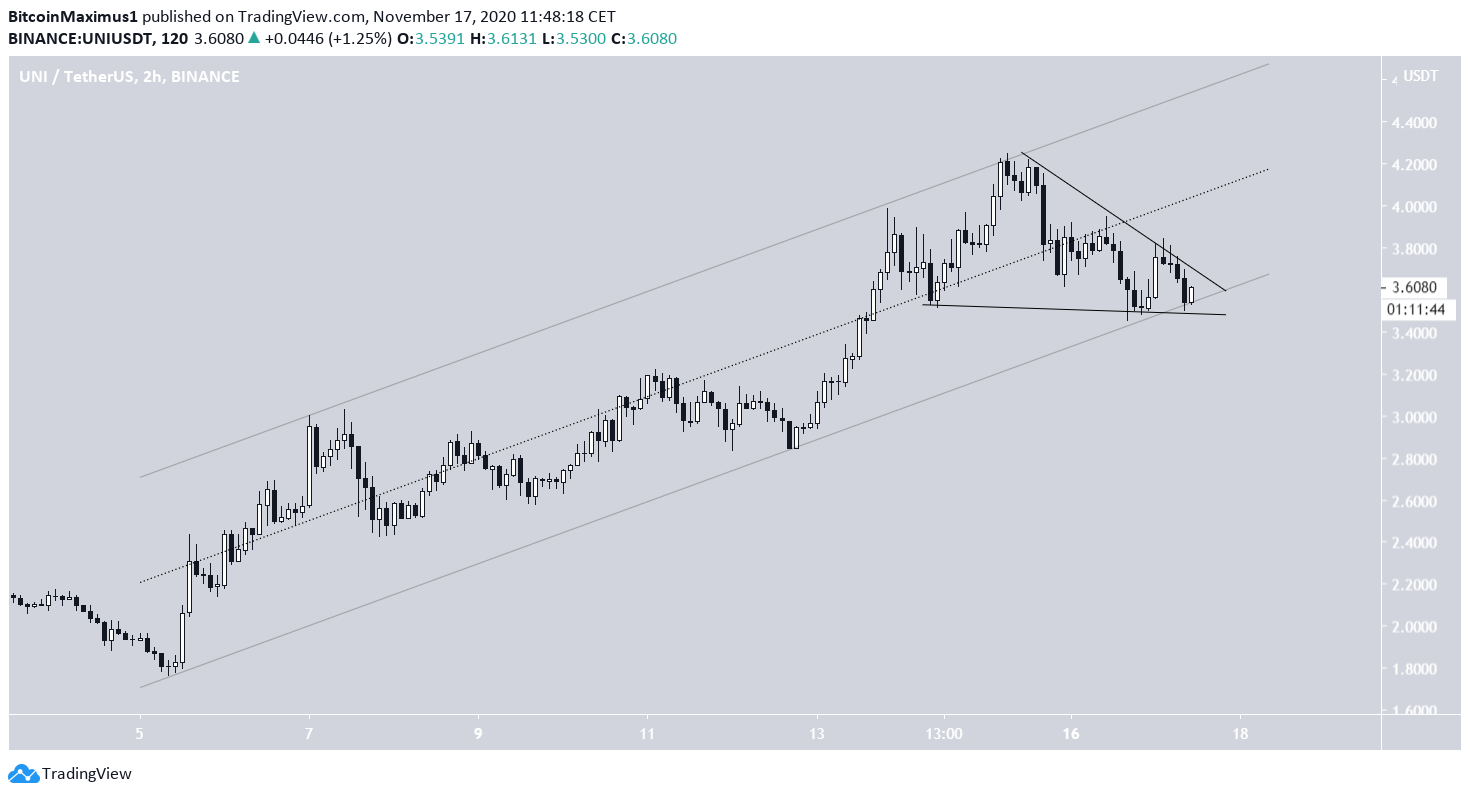
A look at the two-hour chart shows that UNI is trading inside a shorter-term ascending parallel channel of which it is currently at the support line.
Furthermore, the price is possibly trading inside a descending wedge, which is normally considered a bullish reversal pattern.
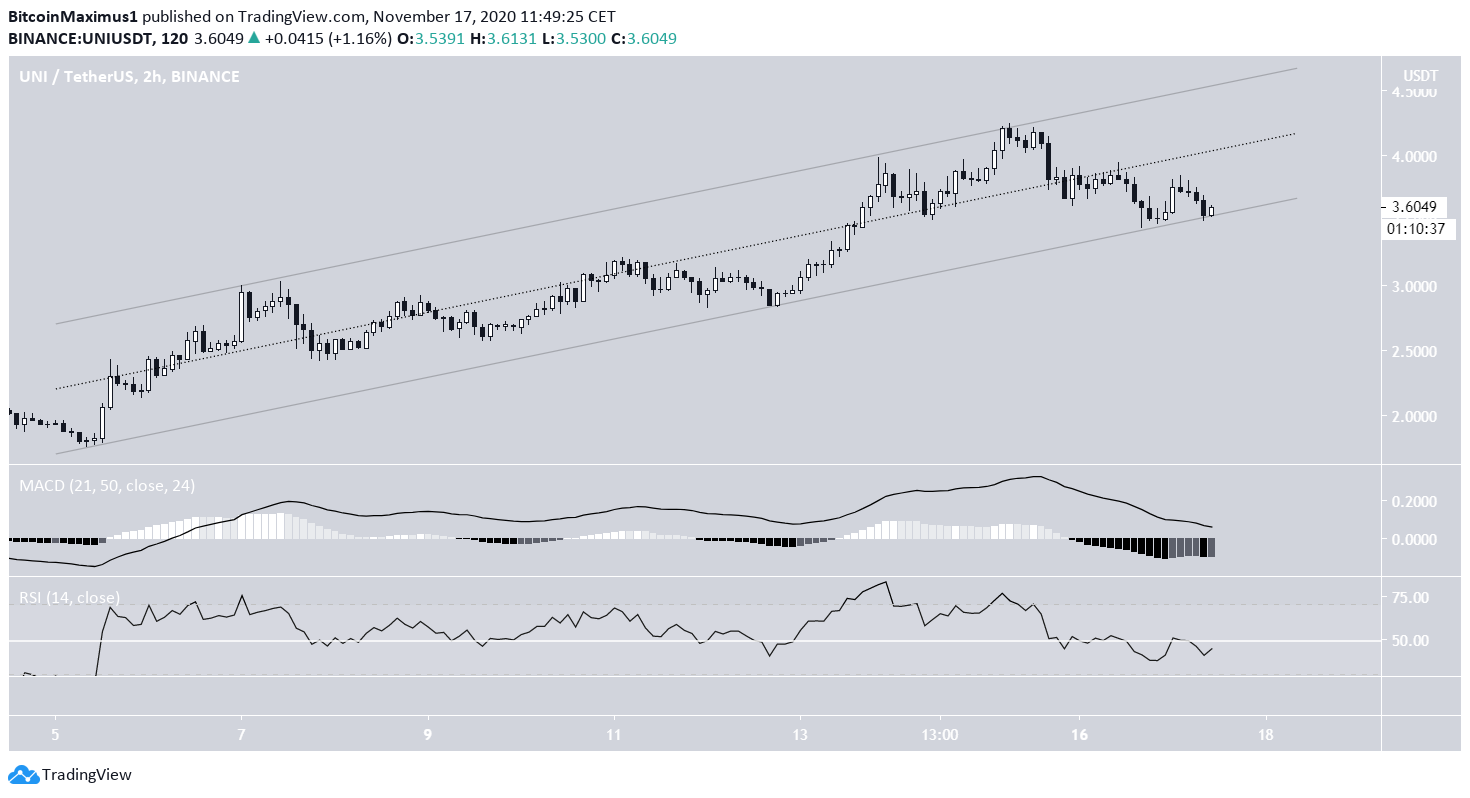
However, since the MACD is decreasing and the RSI is below 50 there are no clear reversal signs just yet. On the other hand, there is no bullish divergence present either.
Therefore, while the UNI price is at a suitable spot for a bounce, there are no clear signs that it will do so.
Future Movement
Cryptocurrency trader @PostyXBT tweeted a UNI chart, stating that as long as the $3.60 support area holds, the price could go all the way to $4.65.
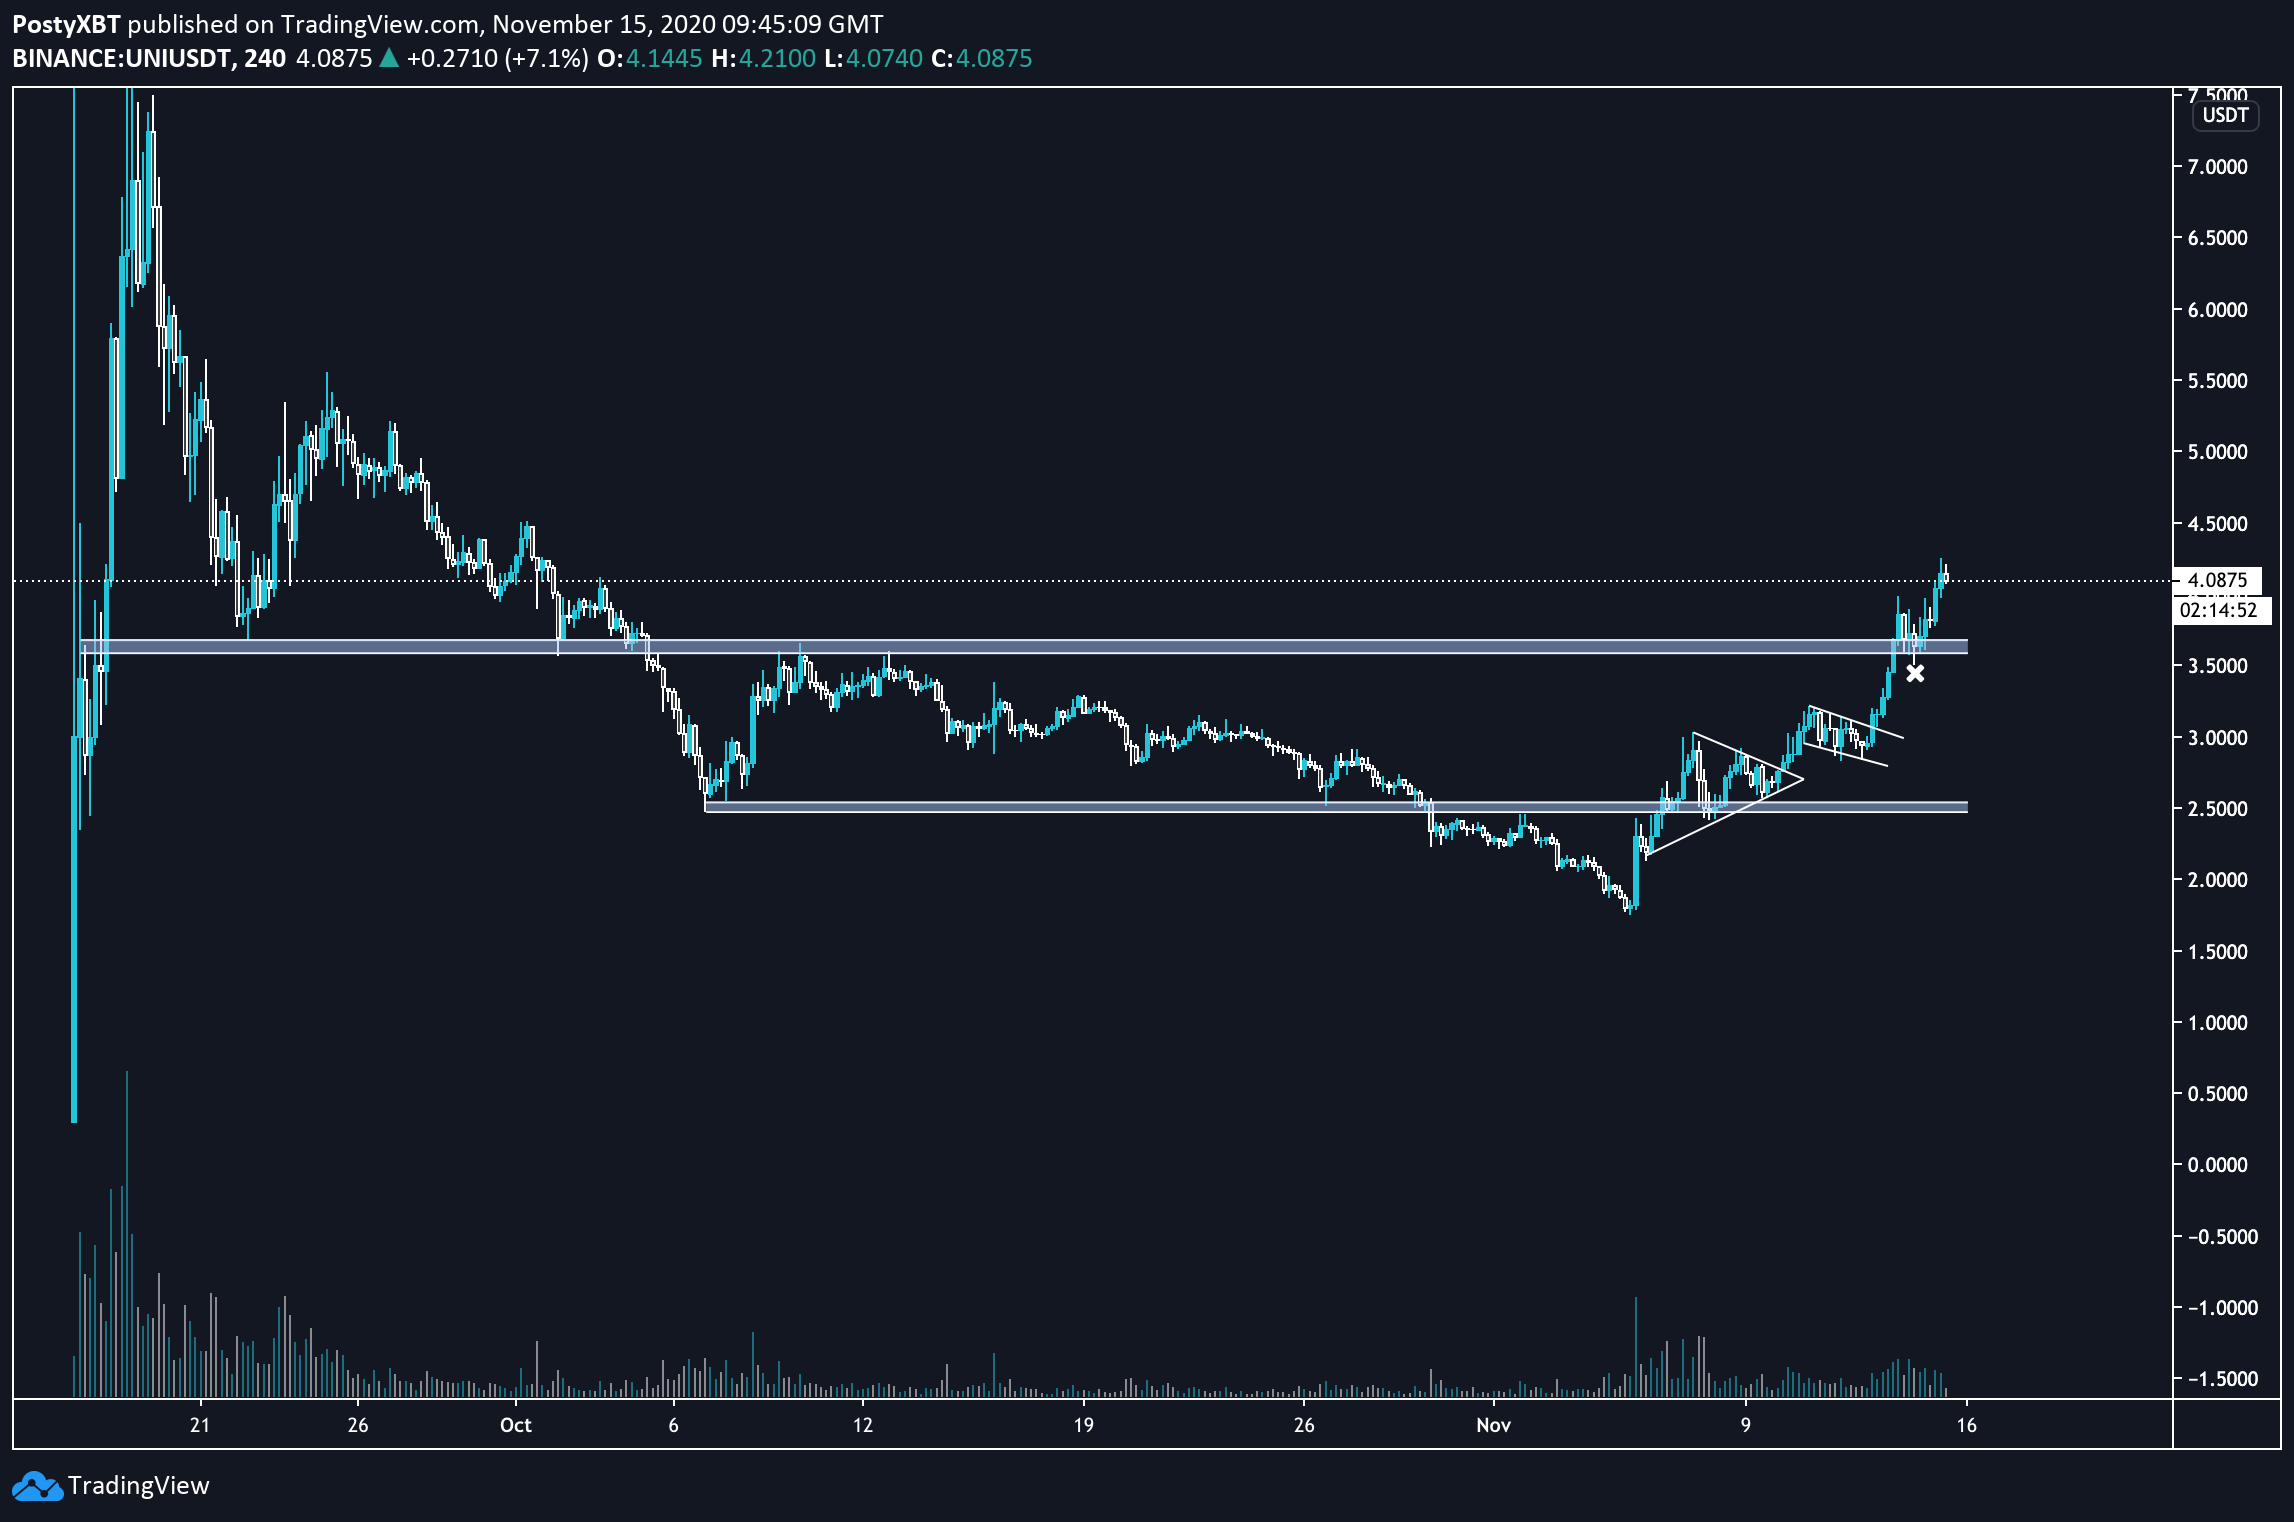
At the time of press, UNI had returned to the $3.60 level once more. The level is now likely to act as support, and also coincides with the support line from the aforementioned ascending channel.
Therefore, it is likely to initiate an upward move, even though technical indicators do not yet suggest such a move will occur. A price increase could likely take UNI toward the next resistance area at $5.50.
In a bearish scenario, a breakdown could cause a drop towards $3, which is the 0.5 Fib retracement level of the recent rally.
Conclusion
The UNI price is in the process of validating a crucial level of support. Despite this, there are no bullish reversal signs yet.
Whether or not UNI breaks down from this level will be key in determining the direction of the trend.
For BeInCrypto’s latest Bitcoin analysis, click here!
Disclaimer: Cryptocurrency trading carries a high level of risk and may not be suitable for all investors. The views expressed in this article do not reflect those of BeInCrypto


