


Uniswap (UNI) went live on Sept. 17, 2020, and despite only being around for a short amount of time, it has already completed its first market cycle and has now begun the second one.
The UNI rally has turned parabolic and could mean that it’s approaching the top of the current upward move.
First Major UNI Cycle
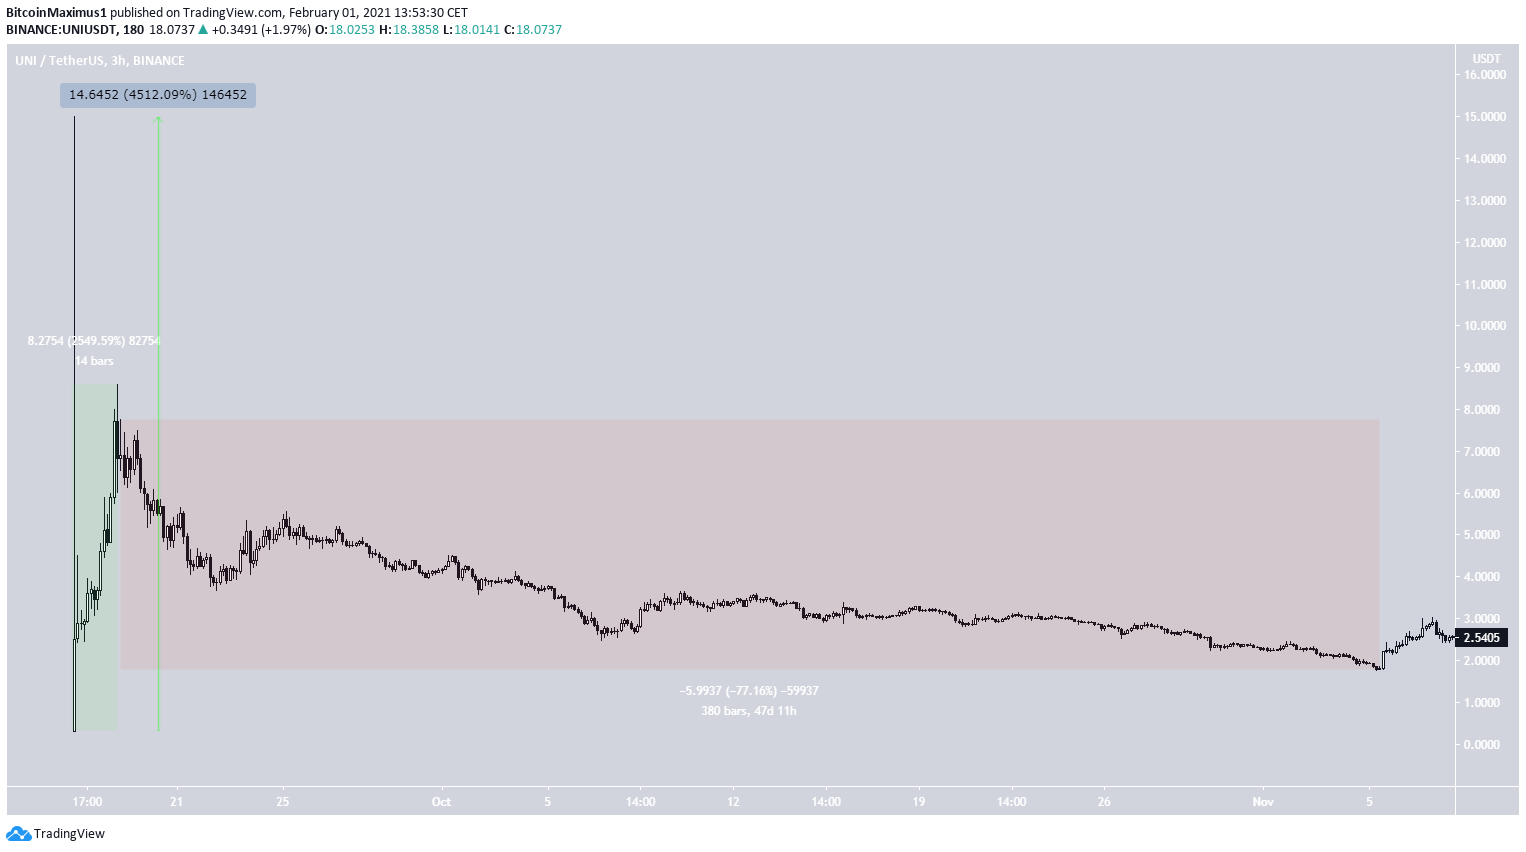
The first major cycle for UNI began moments after its launch in September. A massive increase followed immediately afterward, leading to a high of $15 in a matter of hours.
However, since that price was not sustainable, it only left a long upper wick in its wake. The real high might actually be around $8.16, reached roughly 42 hours after listing.
Immediately after this high, UNI began a long corrective period, in which it fell by 77% in 47 days, leading to a low of $1.75 on Nov. 5.
While the rate of increase after listing was huge, the ensuing downward movement had a more gradual slope. There was a decline of roughly 2% a day.
UNI’s Current Movement
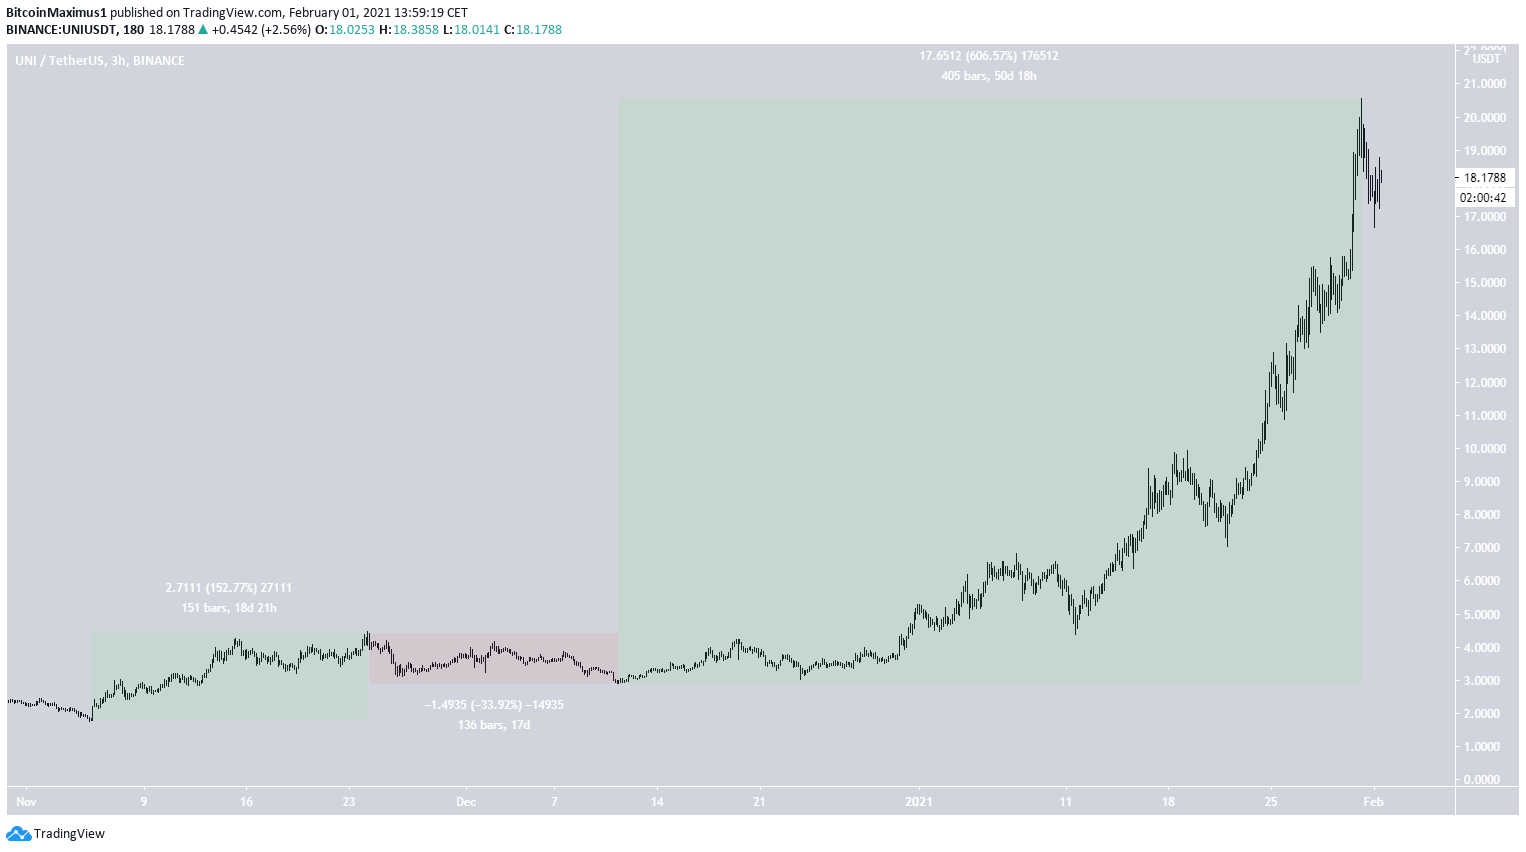
The movement since the Nov. 5 low can be divided into two sections. The first was an upward move of 152% which was followed by a fall of 34%. Both these moves took around 18 days to develop.
Since then, UNI has been on an absolute tear, increasing 600% in 50 days in a near parabolic movement. On Feb 4, it reached an all-time high price of $21.60.
This is now the longest cycle in the token’s short price history and is slightly longer than the original correction of 47 days.
Future Movement
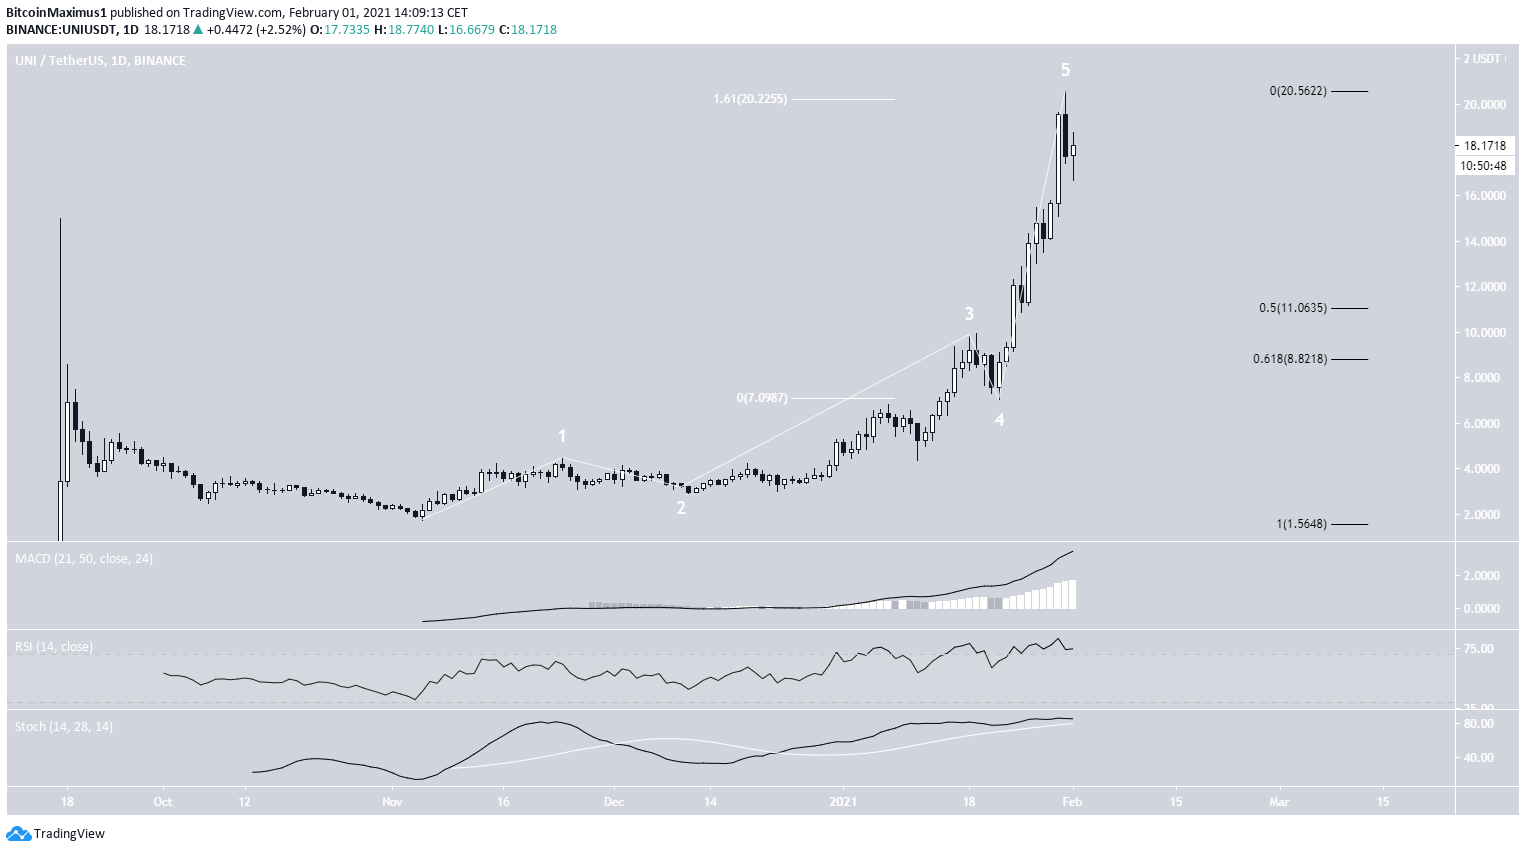
Despite bullish technical indicators, UNI seems to be in the fifth and final wave of a bullish impulse which began in November 2020. Wave 5 has already extended significantly, reaching the 1.61 length of waves 1-3 combined.
Therefore, it’s likely that it is close to reaching the top of its current cycle and may soon see a significant correction. If one occurs, UNI could fall all the way to the 0.5 – 0.618 Fib retracement levels between $8.80 and $11.
For BeInCrypto’s latest Bitcoin (BTC) analysis, click here


