

Matic Network (MATIC) is trading above a long-term rising support line but has yet to move above a crucial resistance area.
Loom Network (LOOM) is trading inside a bullish pattern but has yet to break out.
Long-Term Outlook
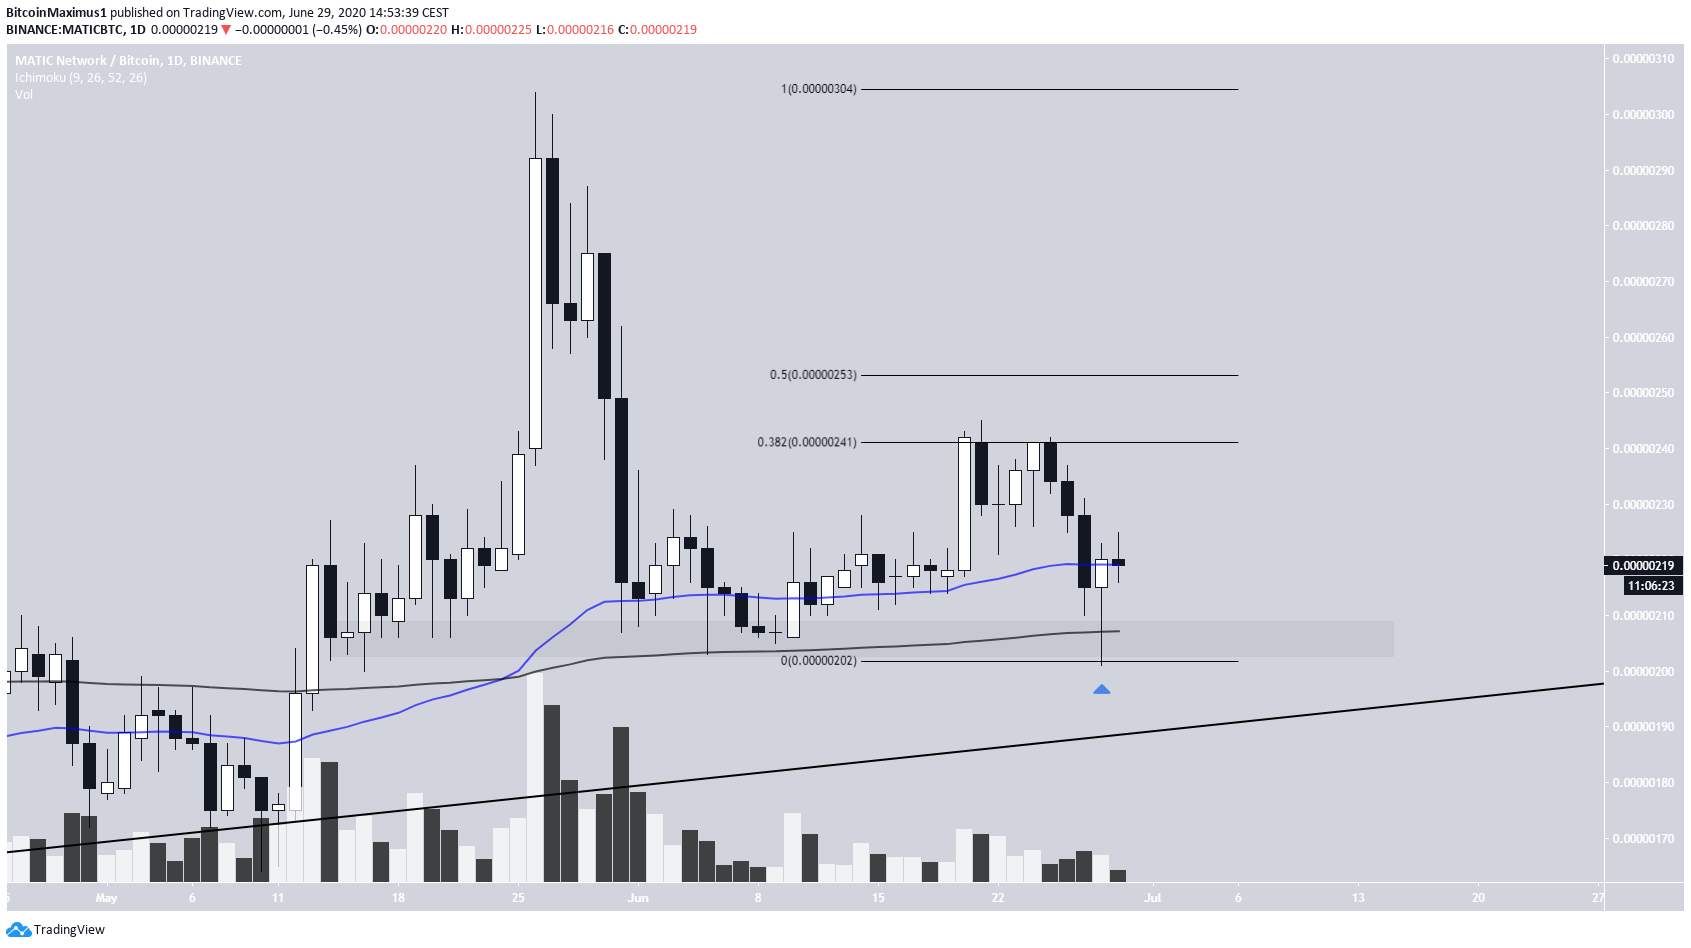
The MATIC price has been following a long-term rising support line since its inception in May 2019. At the time of writing, it was trading slightly above this support line. Technical indicators are bullish. The weekly RSI is back above 50, and the price is trading above the 50-week moving average (MA), which due to the lack of sufficient data, is the longest weekly MA chart that can be plotted. However, the price is still facing considerable resistance at 300 satoshis. Despite having twice touched prices above here, it proceeded to create long upper wicks and then close below. Therefore, until the price successfully clears this area, we cannot with certainty state that the trend is bullish.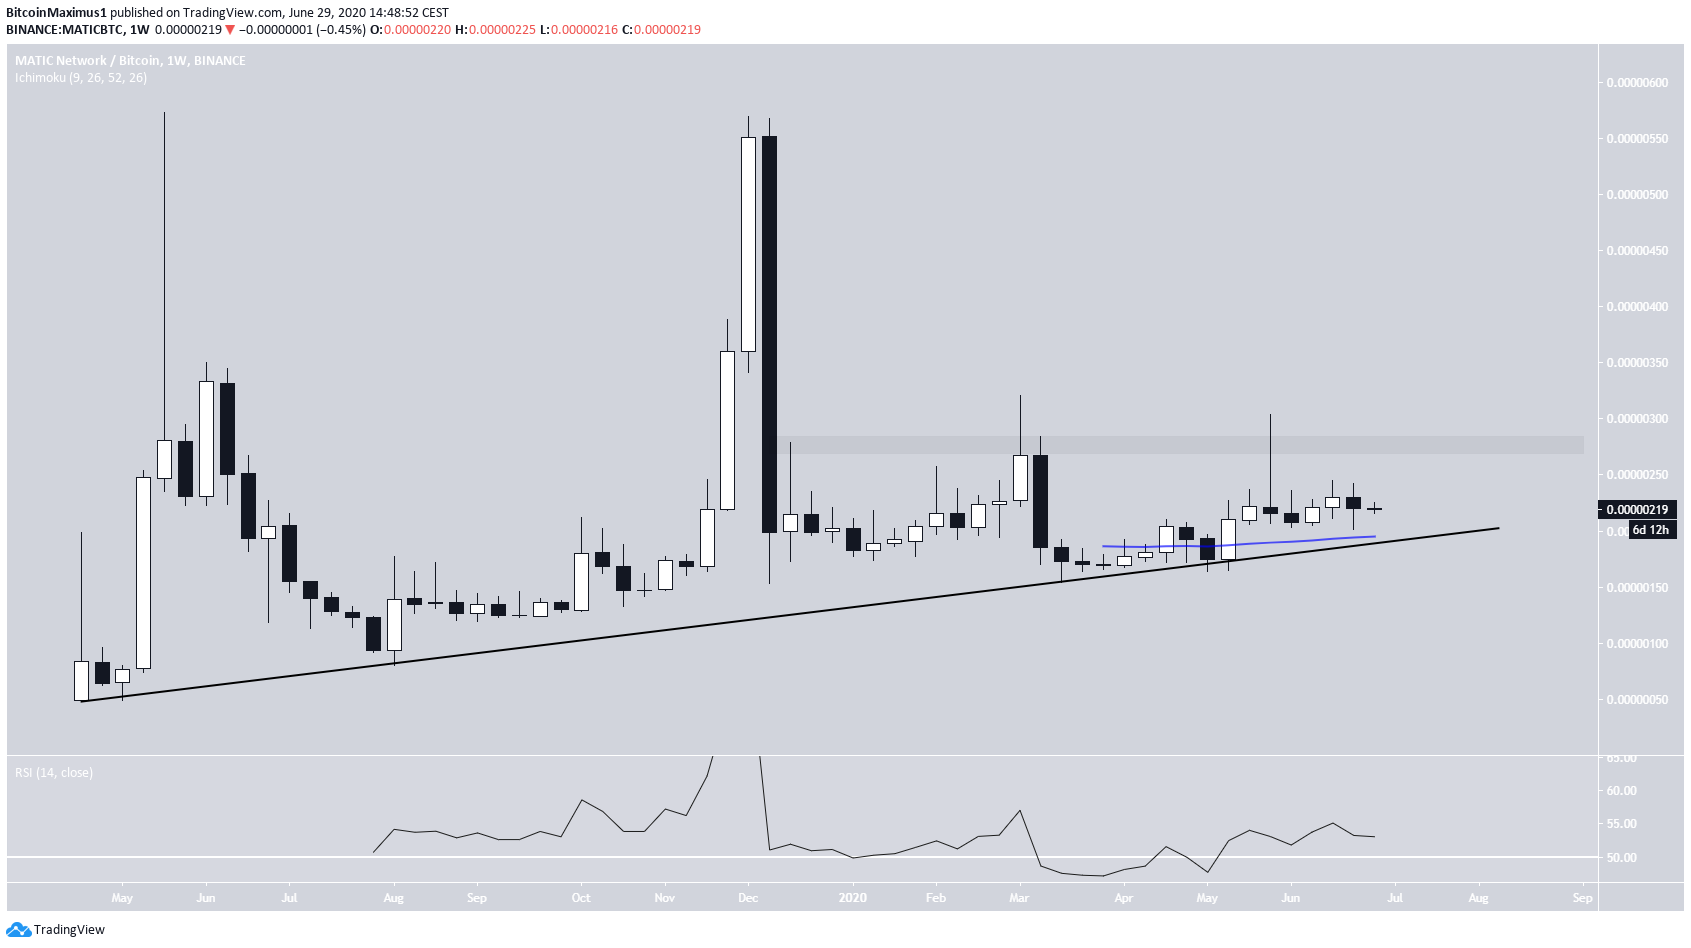
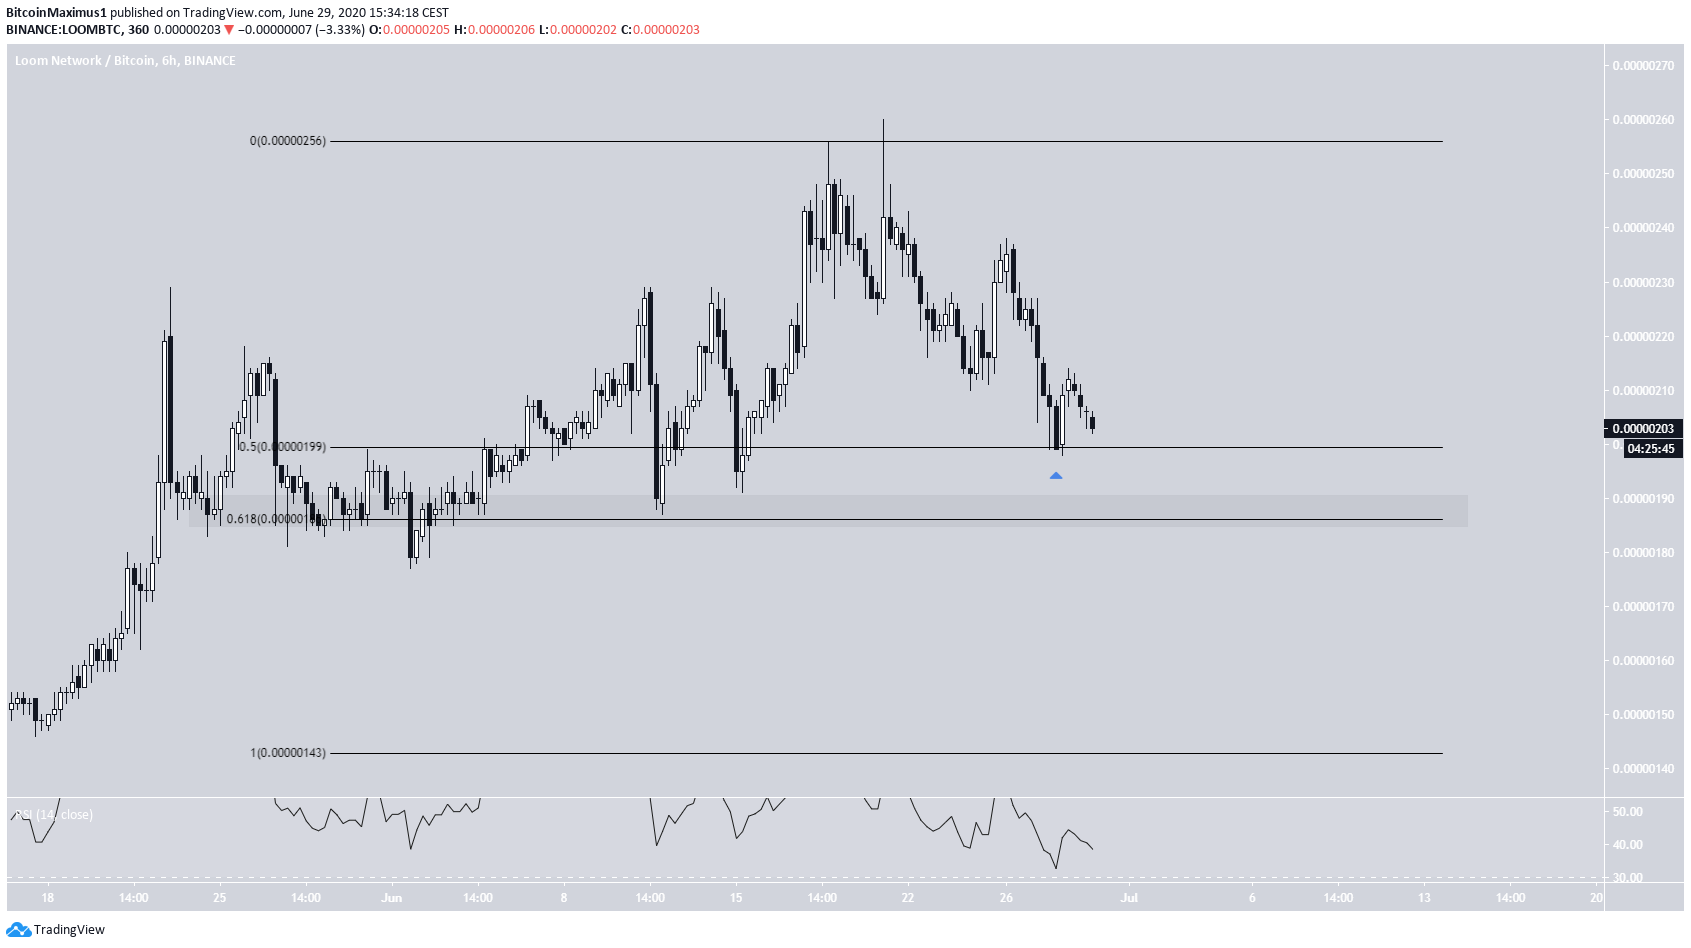
Loom Network (LOOM)
The LOOM price has been trading inside a long-term descending wedge since October 2019. At the time of writing, it was trading slightly below the resistance line of the pattern, after it was rejected by the 200-day moving average (MA) on June 21. This decline was also preceded by considerable bearish divergence on the daily RSI. Currently, the price is trading slightly above the 50-day MA, which has been a remarkably good predictor of the trend so far. The RSI is at 50, so we cannot determine yet whether the trend is bullish or bearish.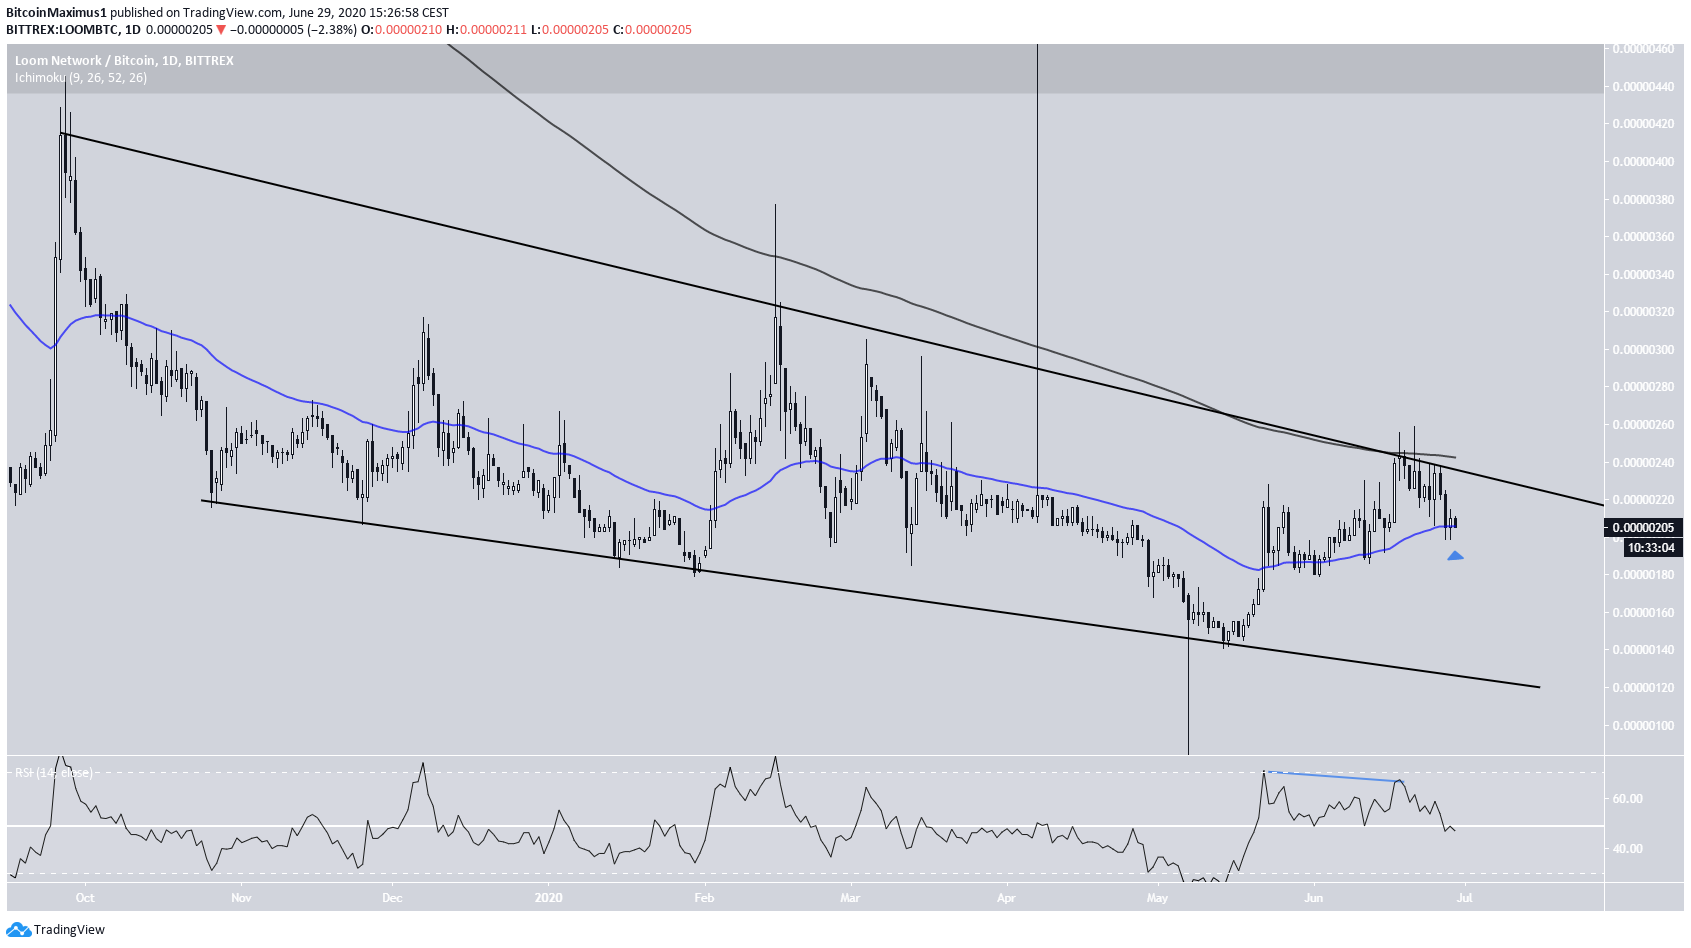
Top crypto projects in the US | April 2024
Trusted
Disclaimer
In line with the Trust Project guidelines, this price analysis article is for informational purposes only and should not be considered financial or investment advice. BeInCrypto is committed to accurate, unbiased reporting, but market conditions are subject to change without notice. Always conduct your own research and consult with a professional before making any financial decisions. Please note that our Terms and Conditions, Privacy Policy, and Disclaimers have been updated.

Valdrin Tahiri
Valdrin discovered cryptocurrencies while he was getting his MSc in Financial Markets from the Barcelona School of Economics. Shortly after graduating, he began writing for several different cryptocurrency related websites as a freelancer before eventually taking on the role of BeInCrypto's Senior Analyst.
(I do not have a discord and will not contact you first there. Beware of scammers)
READ FULL BIO
Sponsored
Sponsored