


The TRON (TRX) price has moved above a minor resistance area and is in the process of increasing above a long-term resistance.
Readings in multiple time frames support the continuation of the upward movement. However, a weekly close above the long-term resistance is required to confirm the validity of the breakout.
TRON Price Reaches Crucial Resistance
The TRX price has increased since November 2022. In February 2023, it reached a new yearly high of $0.073. However, the price has fallen since.
The yearly high was combined with a rejection from a descending resistance line that has been in place for 364 days. When the price follows such a long-term resistance line, the trend is considered bearish as long as the price does not break out from the line.
Currently, the TRX price trades slightly above the resistance line but has not reached a weekly close above it. The weekly Relative Strength Index (RSI) supports the continuation of the increase since it is above 50 and moving upwards.
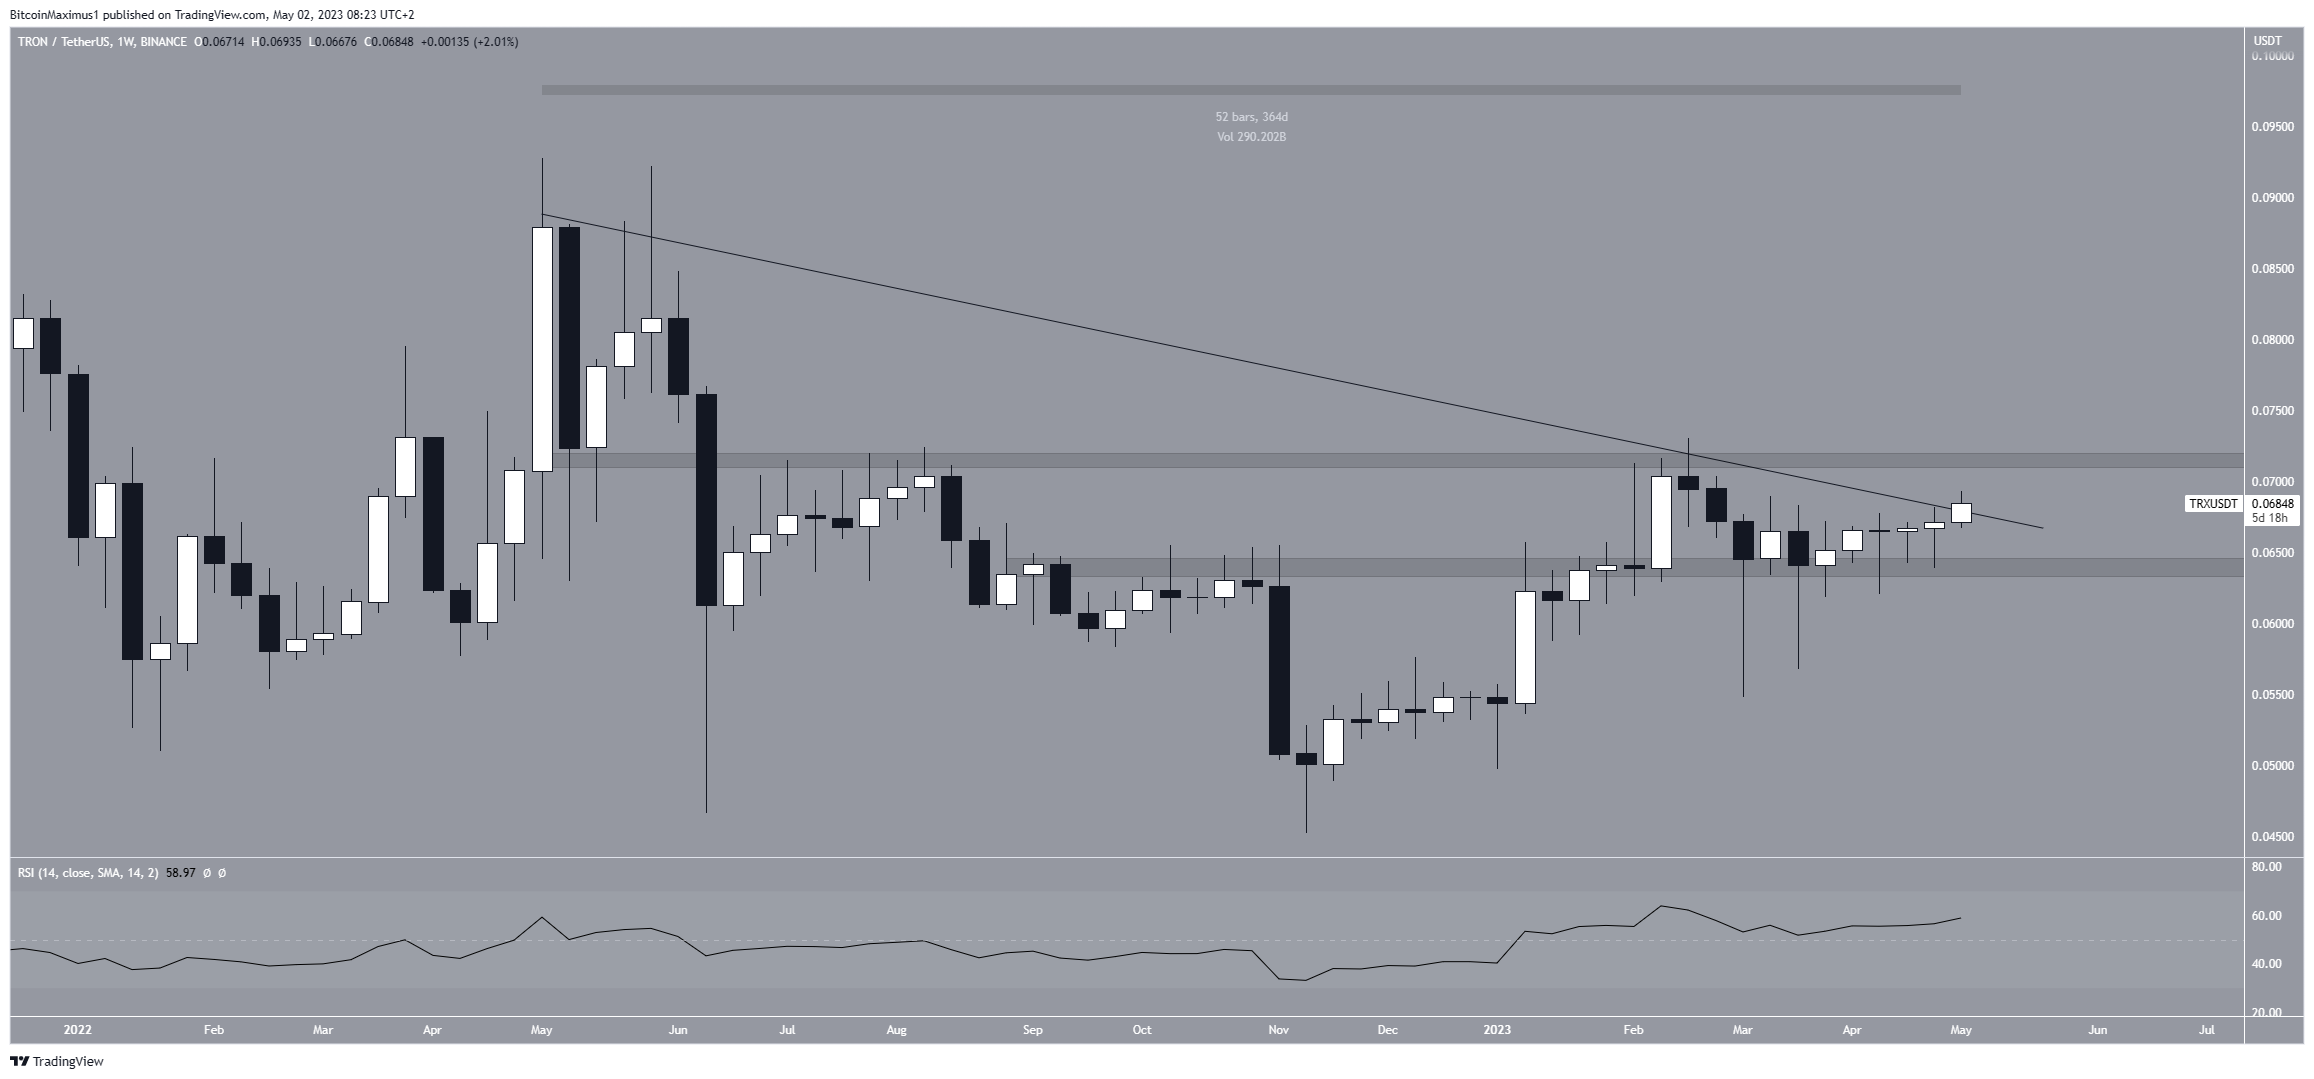
Market traders use the RSI as a momentum indicator to identify overbought or oversold conditions and to decide whether to accumulate or sell an asset.
Readings above 50 and an upward trend indicate that bulls still have an advantage, whereas readings below 50 suggest the opposite. The closest resistance area is at $0.072, while the closest support area is at $0.064.
TRX Price Prediction: Will Bulls Be Successful in Breakout Attempt?
The technical analysis from the daily time frame gives a bullish TRX price prediction. Both the RSI and the price action support this possibility.
Firstly, the TRX price has moved above the $0.067 minor horizontal resistance area. When combined with the short-term ascending support line, this creates an ascending triangle.
The ascending triangle is considered a bullish pattern, boding well for the future price and leading to breakouts most of the time. A breakout that travels the entire pattern’s height would take TRX to $0.082.
Similarly to the weekly one, the daily RSI is above 50 and increasing. Hence, it supports the ongoing upward movement.
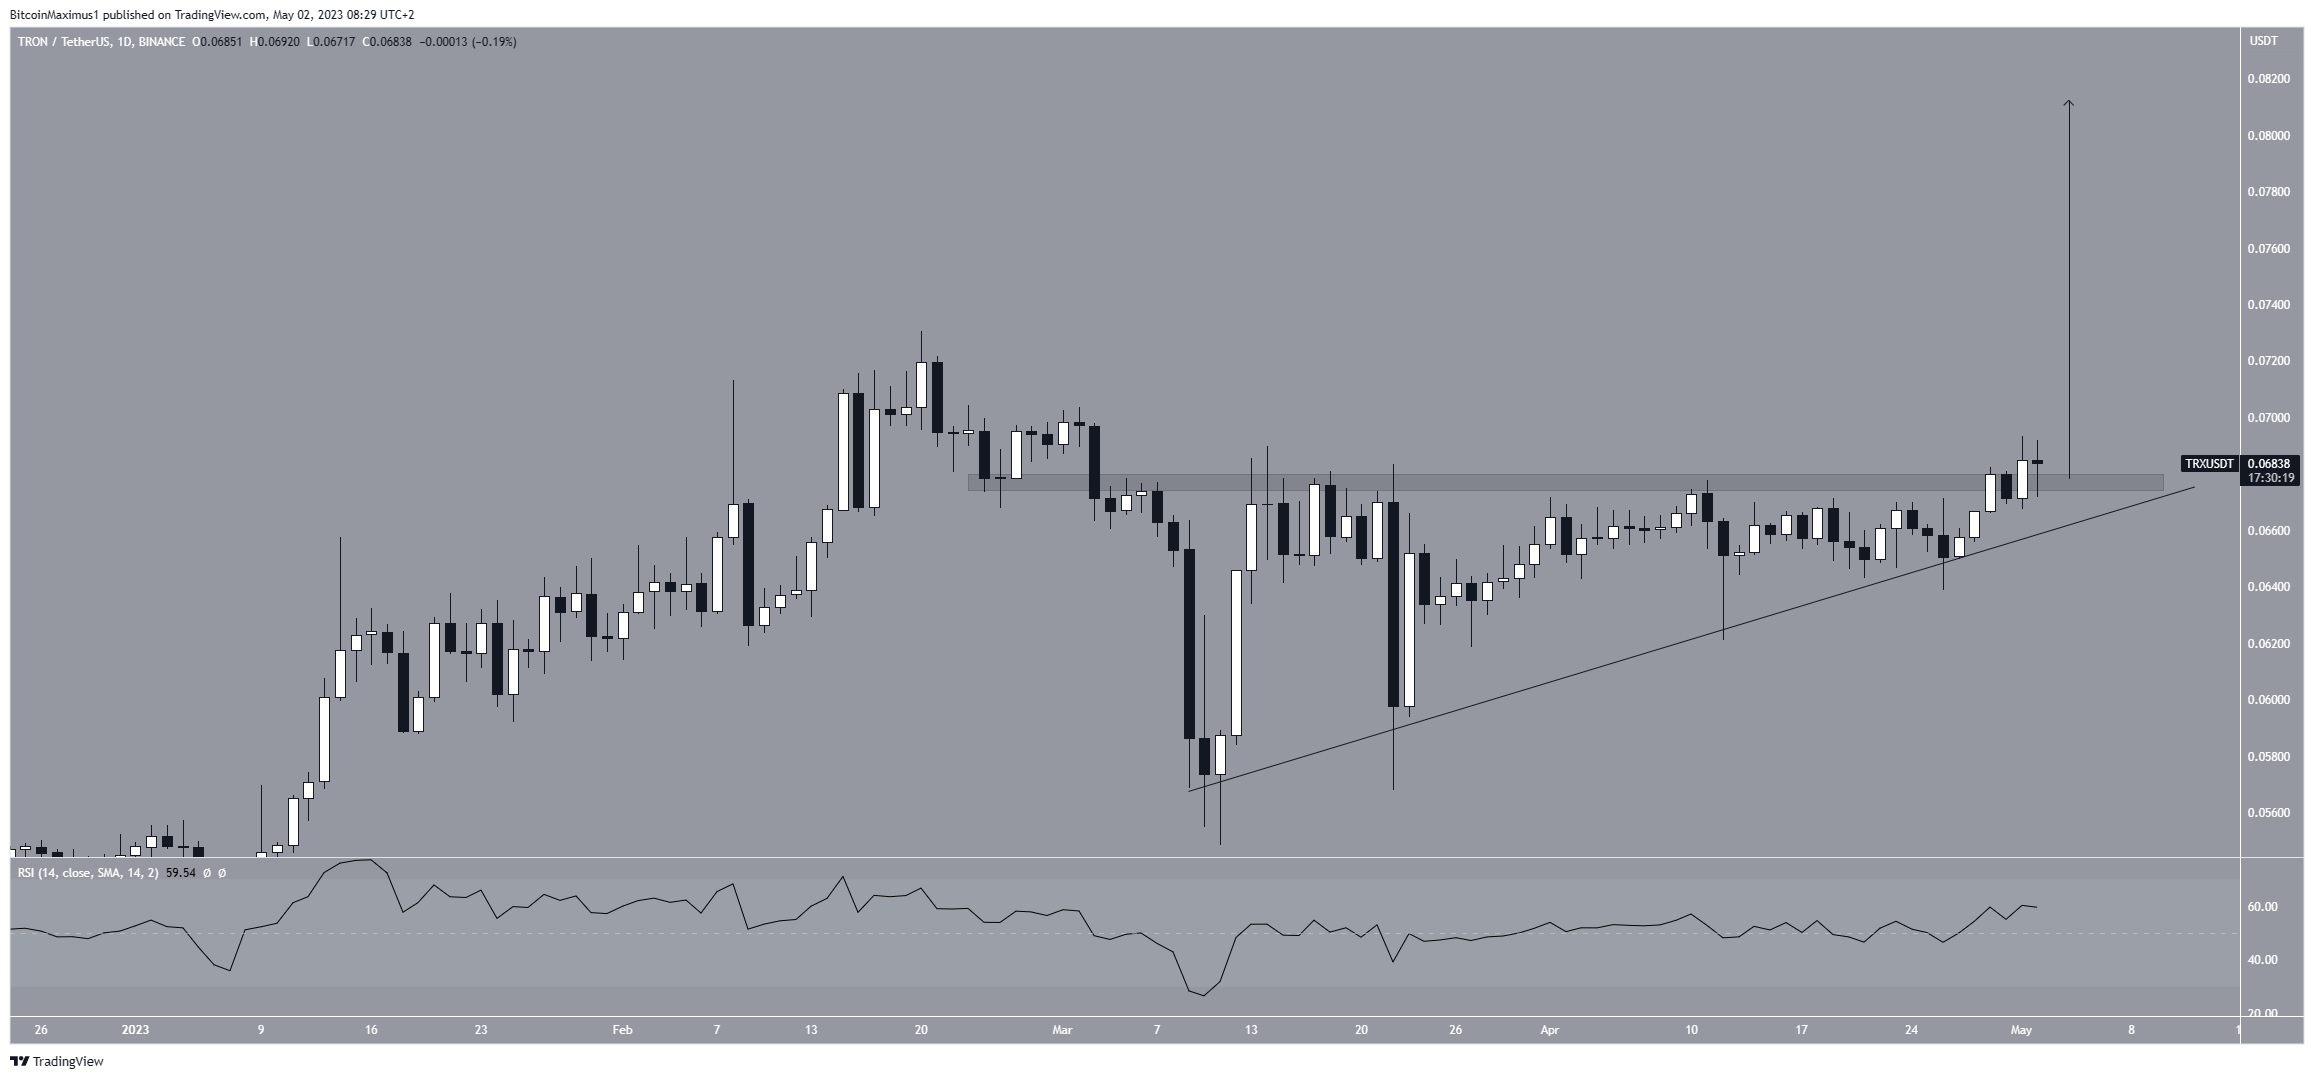
Despite these bullish signs, a close below the ascending support line will invalidate this bullish TRON price forecast. This will mean that the breakout was invalid, and a drop to at least $0.064 will follow.
For BeInCrypto’s latest crypto market analysis, click here.


