
Official Trump (TRUMP) has struggled since launch, down more than 71% overall and nearly 89% below its all-time high. But the wave of hype surrounding the WLFI listings gave the token a brief lift yesterday, pushing the TRUMP price up by more than 5% before sellers stepped back in.
Now trading around $8.30, the token’s charts are sending mixed messages: while some metrics hint at a short-term rebound, the broader trend remains firmly under bearish control.
Accumulation Trend Hints at Rebound as Bears Lose Grip, But There’s a Catch
Despite TRUMP’s weakness, on-chain accumulation over the past week has been net positive. Top 100 addresses added roughly 0.78 million tokens, worth about $6.47 million at the current price.
Exchange balances dropped by nearly 0.45 million tokens, signaling outflows worth $3.74 million — another sign of accumulation. Whales holding between one and ten million tokens reduced their positions by around 0.06 million tokens, worth about $0.50 million.
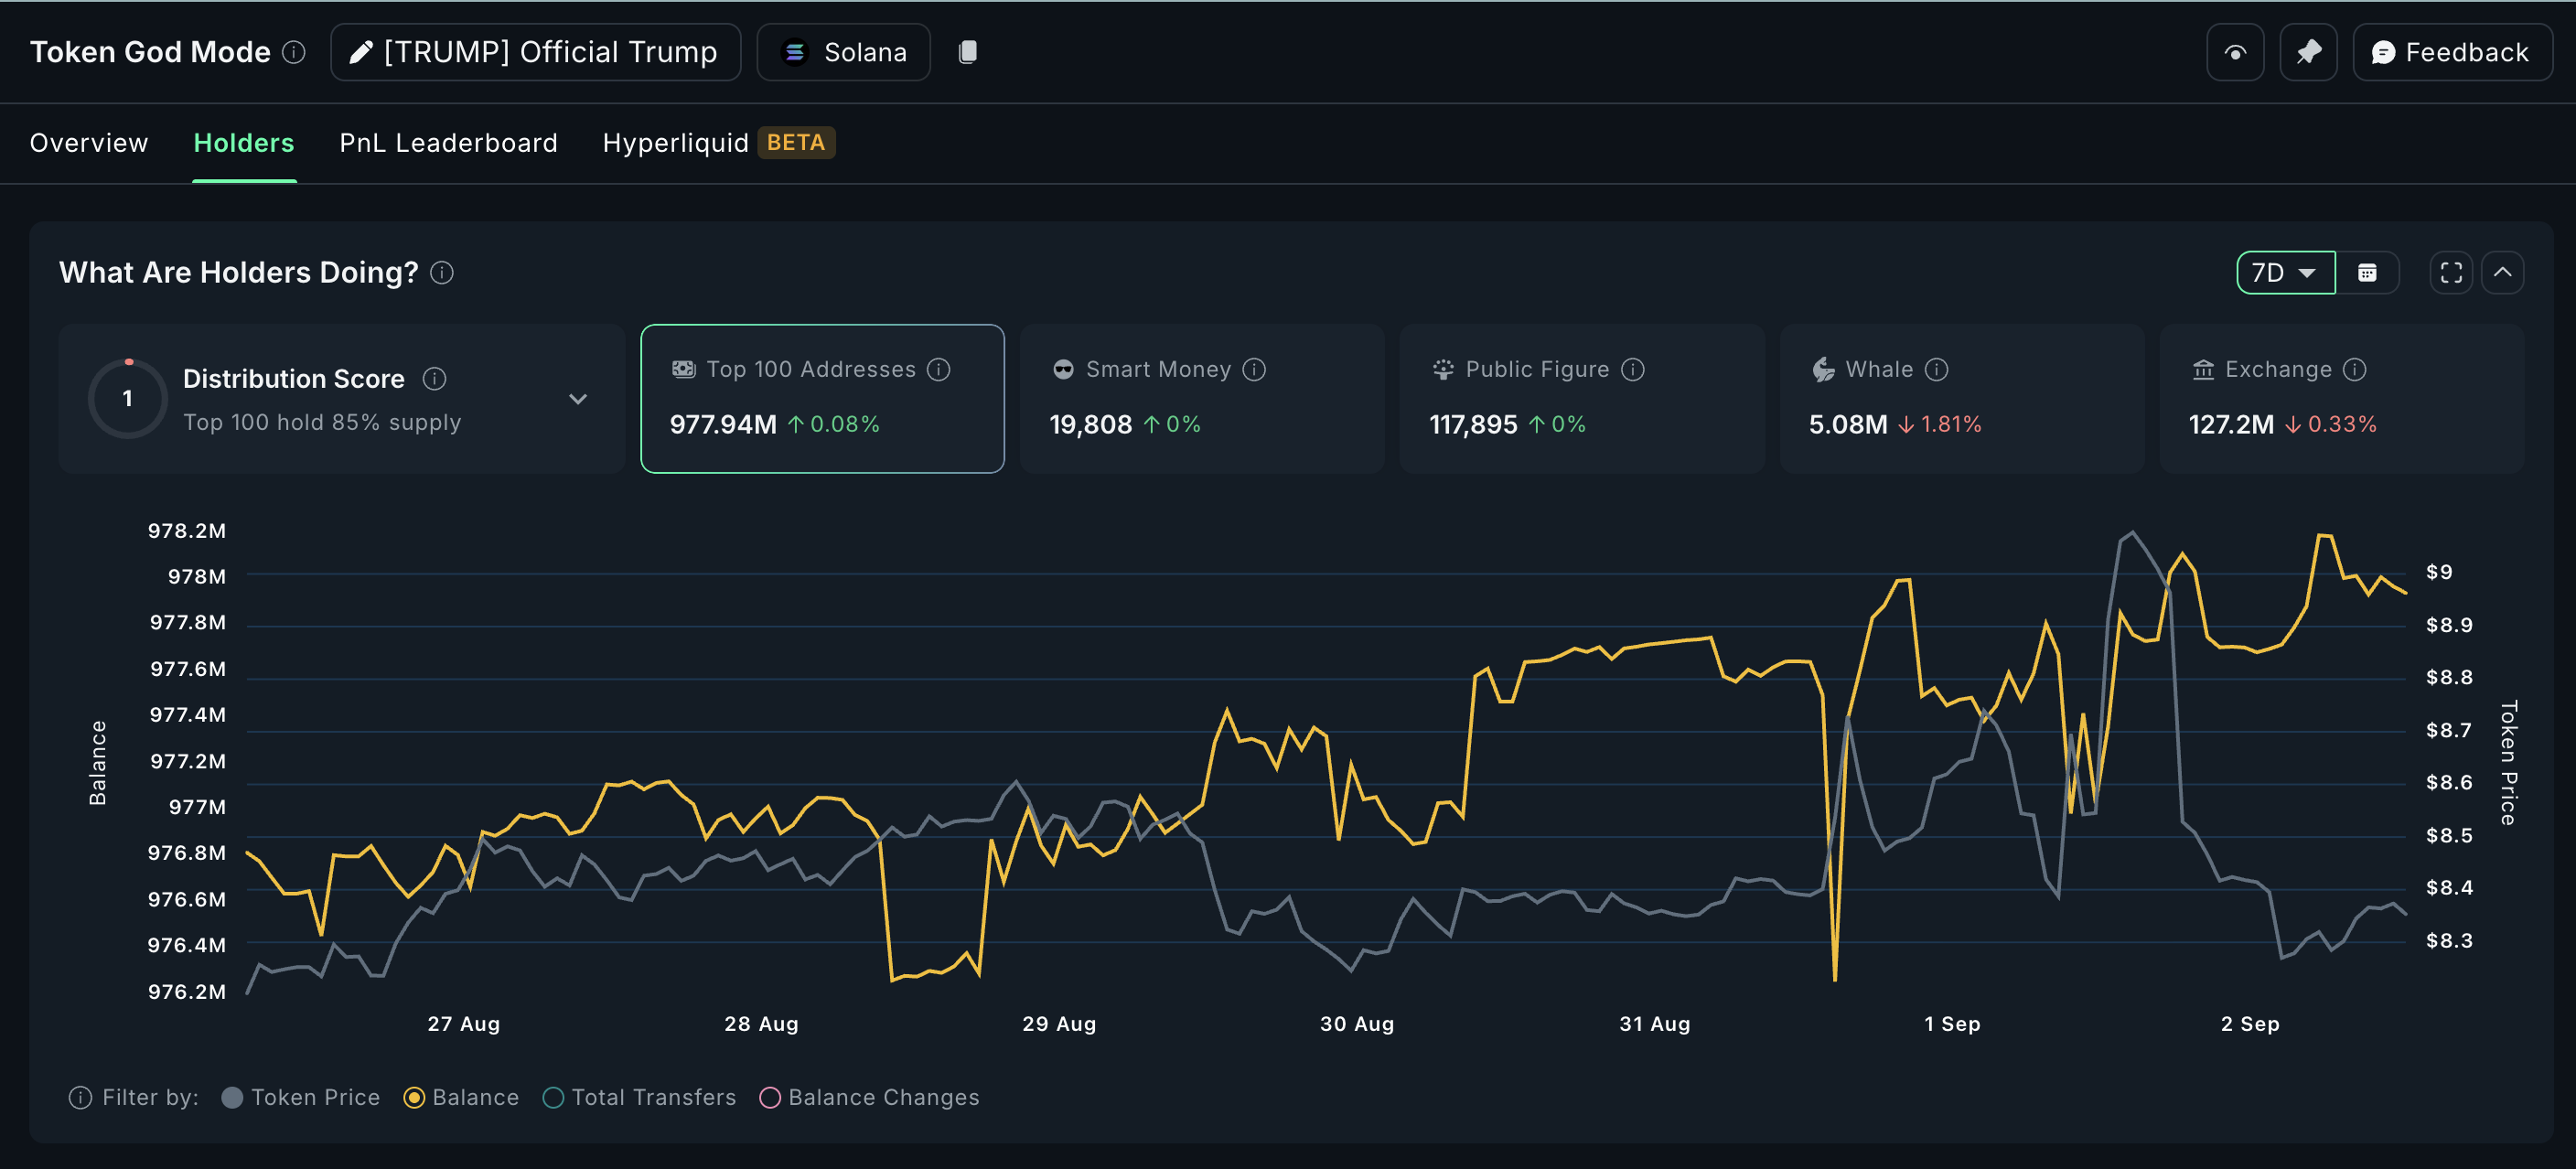
In total, the market saw net positive accumulation of $9.7 million worth of TRUMP over seven days.
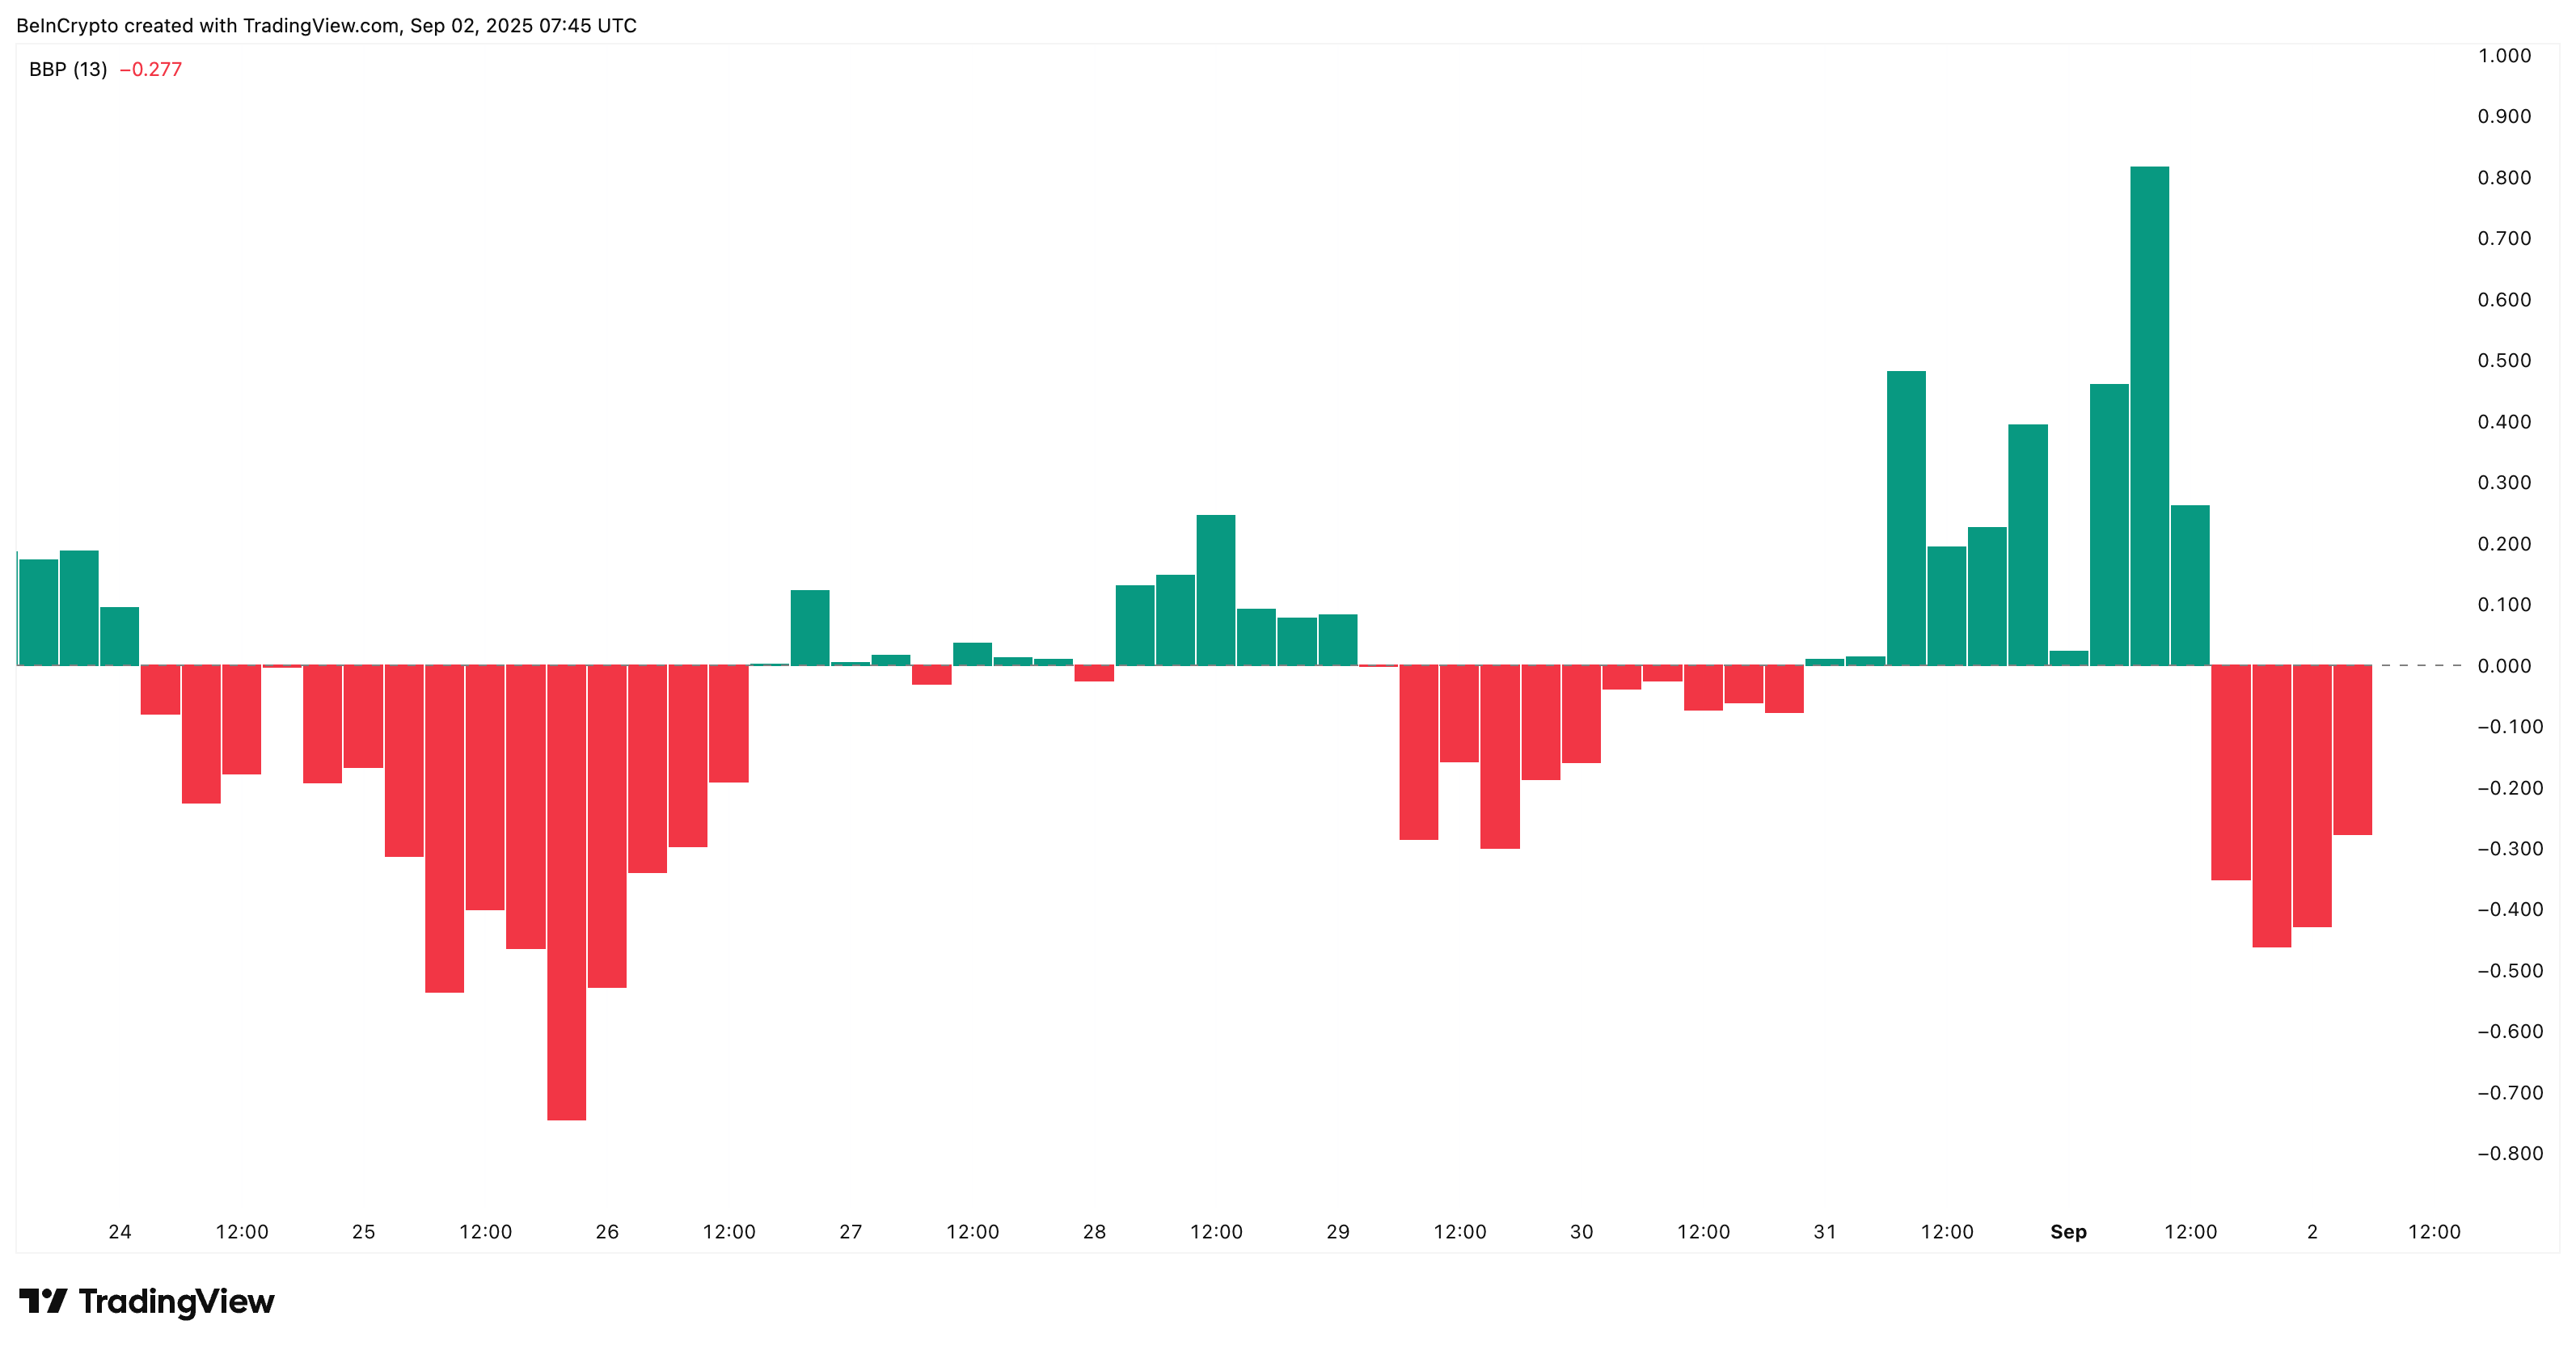
This aligns with the 4-hour chart, where bull–bear power — an indicator that measures whether buying or selling pressure dominates — has been steadily declining since September 1.
The combination of accumulation and weakening short-term bearish strength lays the foundation for a potential TRUMP price rebound. However, the accumulation signs have only been able to mildly defeat the bears, and that too on the 4-hour chart.
The plot thickens when we look at the daily chart.
Want more token insights like this? Sign up for Editor Harsh Notariya’s Daily Crypto Newsletter here.
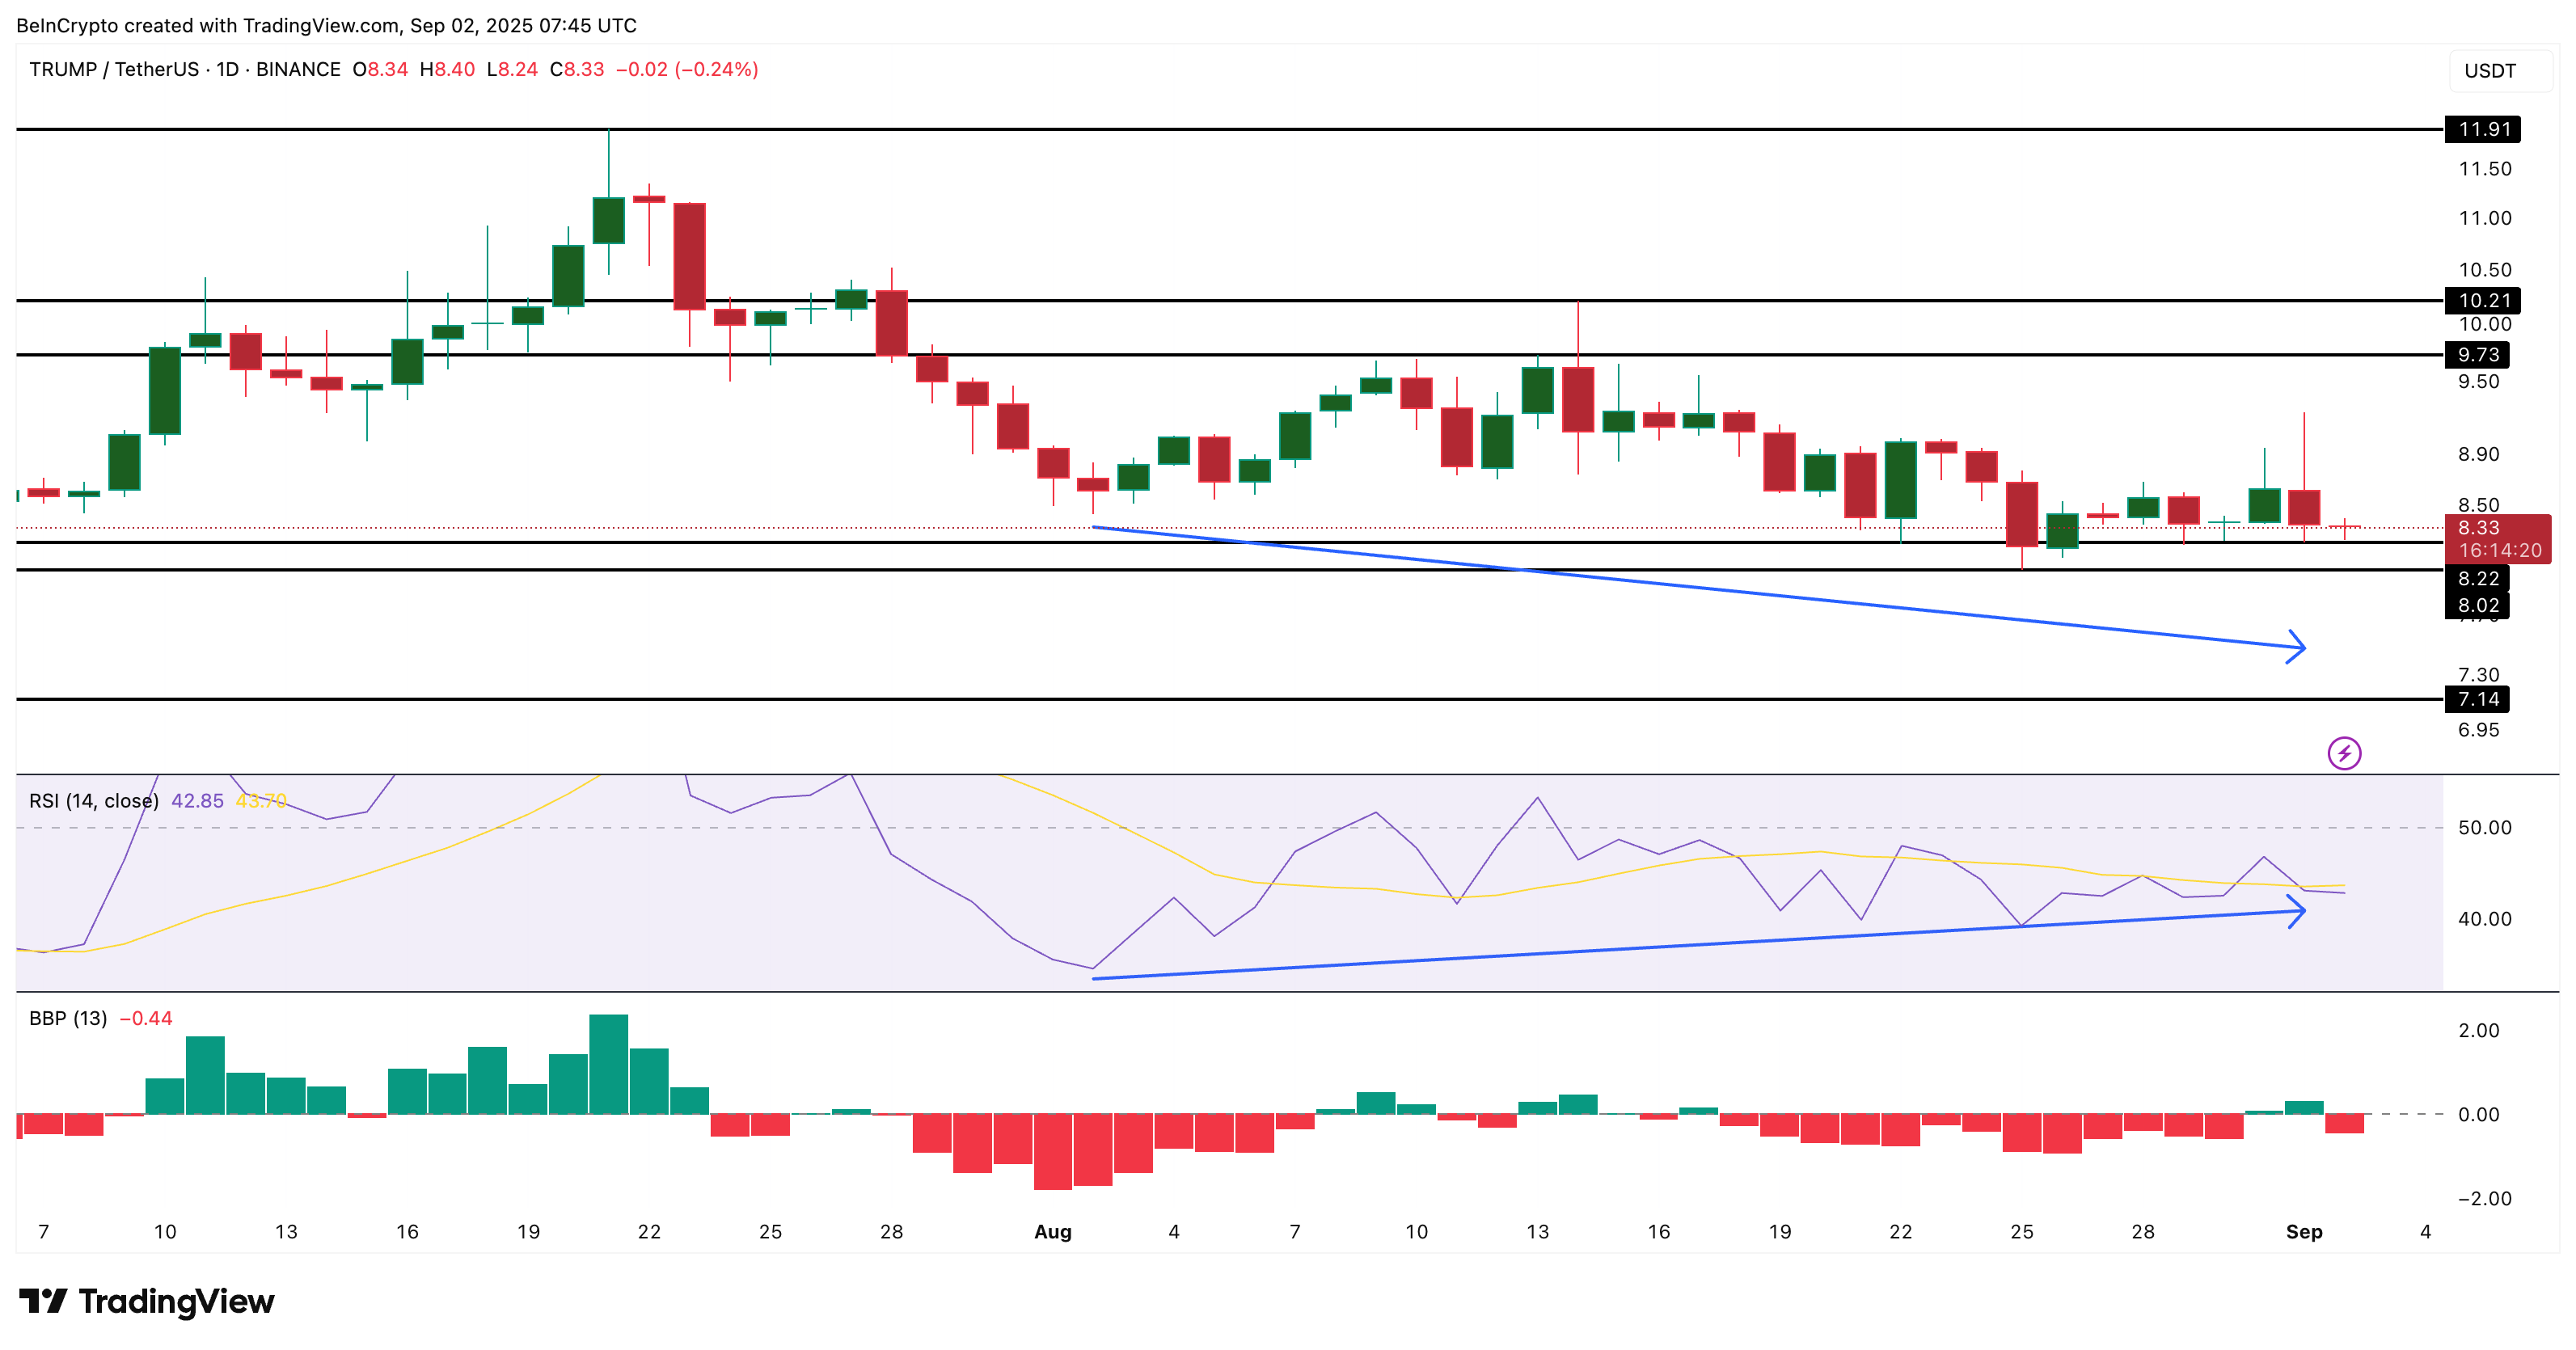
Bullish Divergence Meets Bearish Control on the Daily TRUMP Price Chart
On the daily chart, TRUMP’s price has formed a lower low while the RSI, or the Relative Strength Index, has printed a higher low. This bullish divergence often signals that sellers are losing steam and could precede a rebound. In simpler terms, the downtrend in price isn’t being matched by momentum — suggesting buyers are starting to resist.
The Relative Strength Index (RSI) is a momentum oscillator that tracks overbought and oversold conditions
Yet, this signal clashes with the broader picture.
Bearish power remains dominant on the daily chart, with sellers having flipped control from green to red. The result is a standoff: bulls have the technical signal, but bears still have the structural grip.
Until that grip loosens, any rebound sparked by the divergence is likely to be shallow and capped by resistance at $9.73. Only a clean daily close above that level could tilt control back to TRUMP buyers, while losing $8.22 first and then $8.02 would hand momentum decisively back to sellers.
