Tron (TRX) Highlights
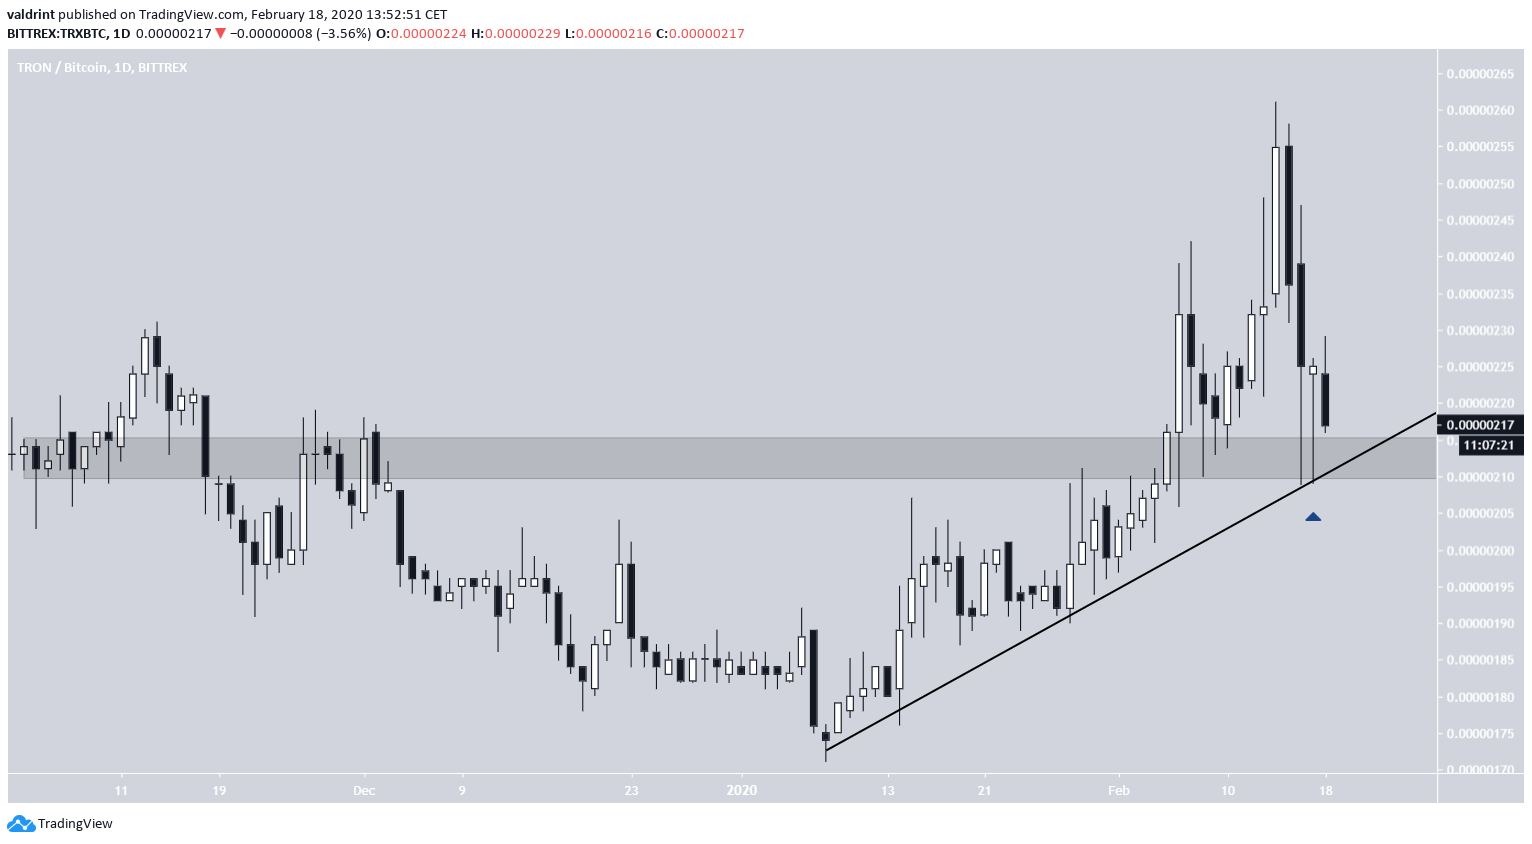
- The TRON price is following an ascending support line.
- There is support at 210-215 satoshis.
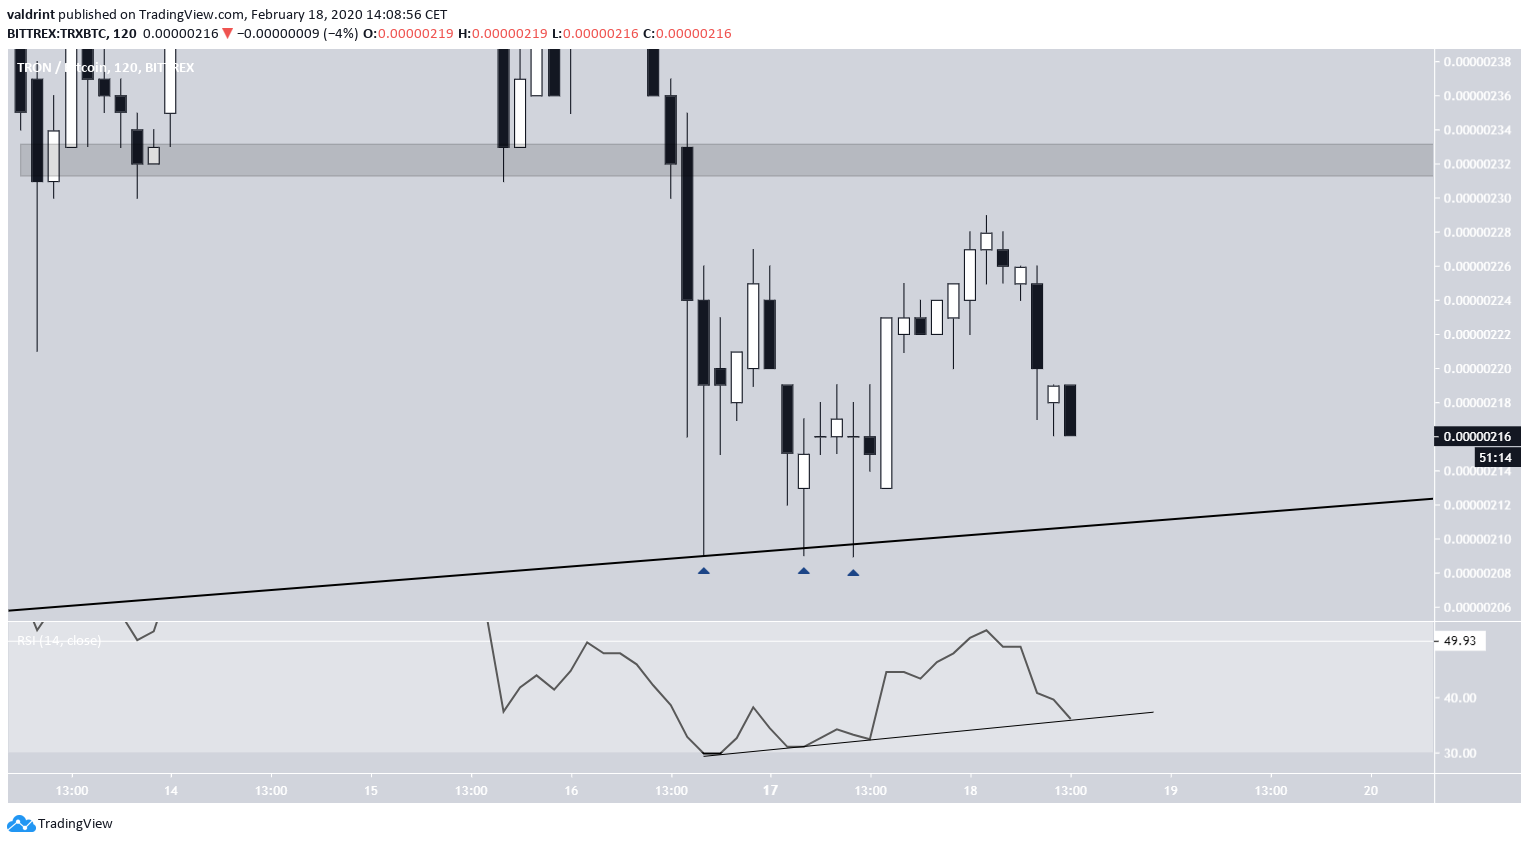
- There is resistance at 230-235 satoshis.
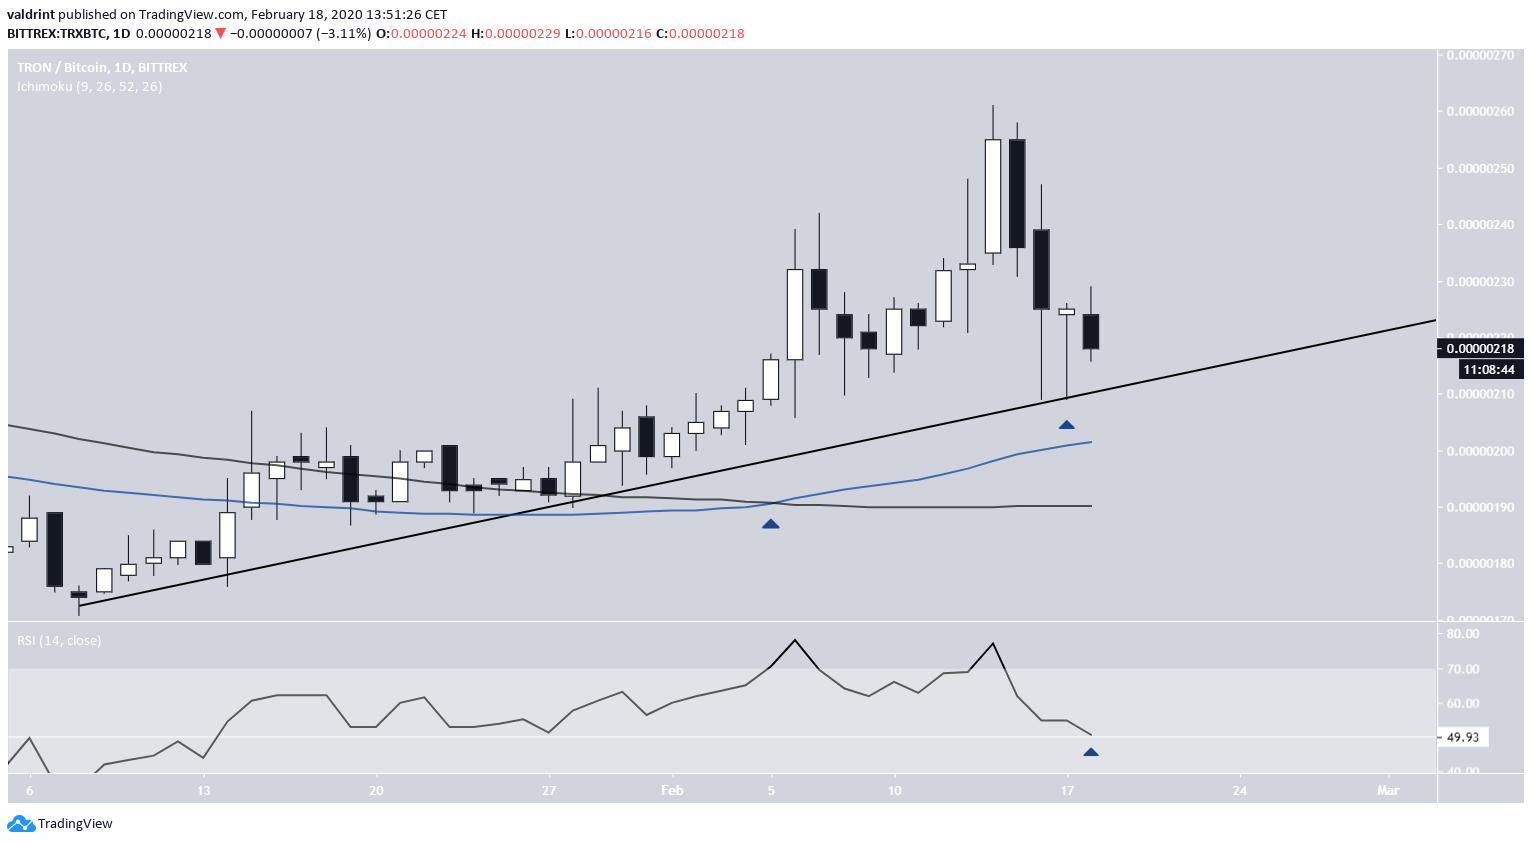
- A golden cross has transpired.
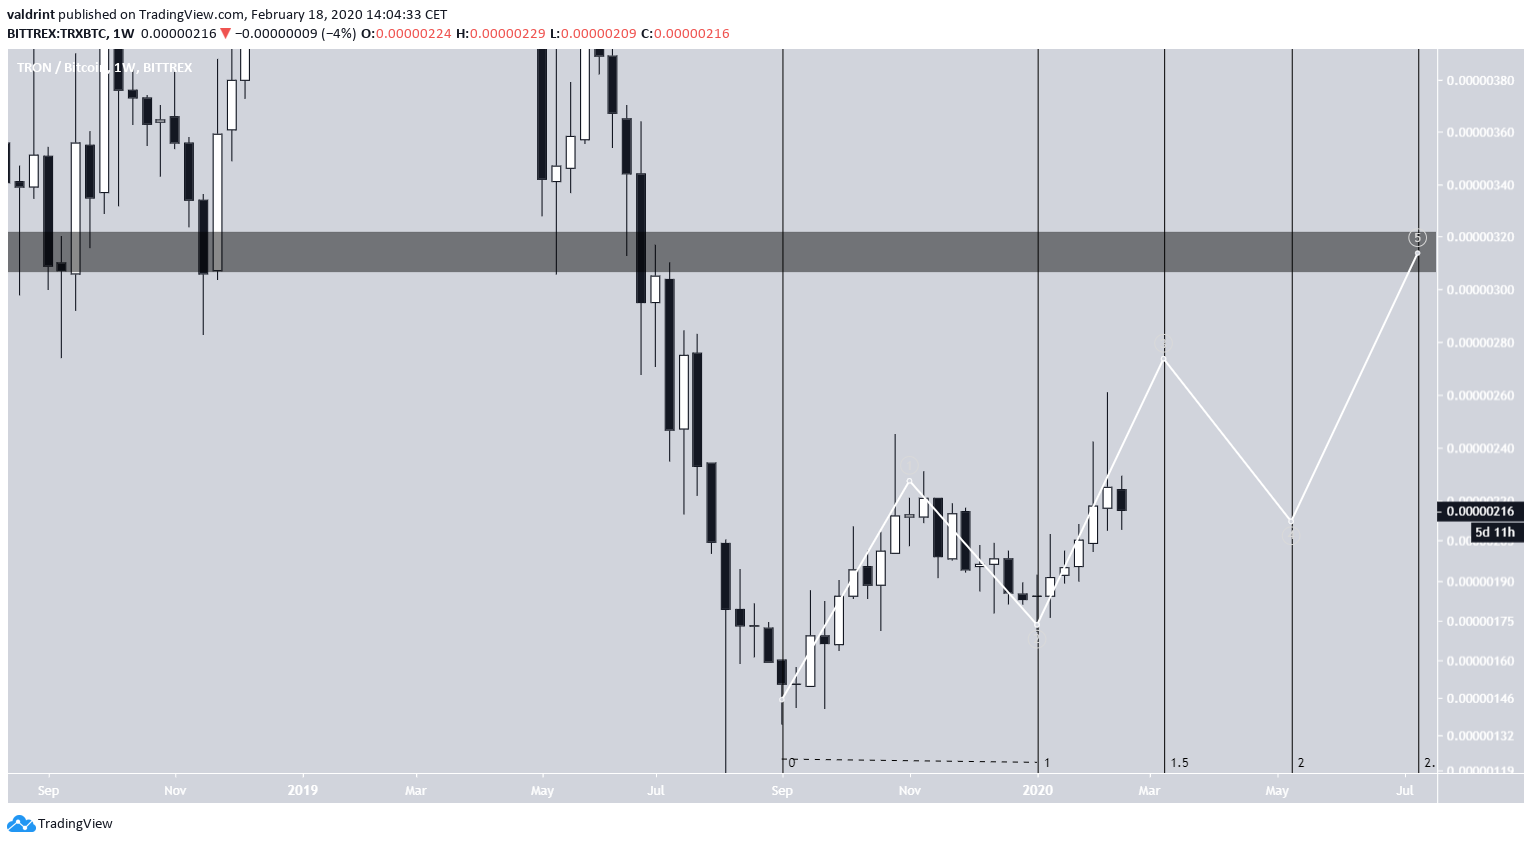
- The price is likely in the third wave of a five-wave Elliott formation.
Will TRON be able to reach the target, or will the price fail to initiate a rally? Continue reading below if you are interested in finding out.$TRX #TRON $ALTS: TRX retraced a bit, as many alts did. IMO this still looks pretty good on HTF charts and I still think dips are for buying. Still looks like an A&E bottom- wouldn't want to see 220 broken, though. Waiting on 250 sats to be tested again. pic.twitter.com/VXirbpXCCC
— Altcoin Sherpa (@AltcoinSherpa) February 18, 2020
Ascending Support Line
The TRON price has been following an ascending support line since January 8. While increasing along this line, the price reached the previously mentioned high of 261 satoshis on February 14. The ensuing decrease caused the price to validate the support line and the 210-215 satoshi support area. Once the price got there, it created a bullish hammer candlestick — a sign of buying pressure indicating that the price wants to move upwards. Technical indicators also provide a bullish outlook. The 50- and 200-day moving averages (MAs) have made a bullish cross, otherwise known as a golden cross. This suggests that the price has begun an upward trend.
Furthermore, the creation of a bullish hammer coincided with what looks like a possible RSI bounce at the 50-line, indicating that the price will head upwards.
A price breakdown below the ascending support line along with an RSI movement below 50 would invalidate this hypothesis.

Impending Increase
Lower time-frames show that the TRON price is expected to begin a reversal soon. Besides the visible lower wick strength, there is a developing bullish divergence in the short-term RSI. If this reversal begins, the closest area that can provide minor resistance is found at 233 satoshis.
Long-Term TRON Movement
The weekly chart shows that the price is, possibly, in the third wave of a five-wave Elliott formation. The recent decrease did nothing to dissuade this outcome. A possible outline of this movement would take the price near 270 satoshis by the end of the third wave before March 11 — and the price is on track to get there. While we do not necessarily agree with the double bottom outlined in the tweet, since the actual values for the two bottoms are vastly different, it looks as if the price movement is bullish either way. After the completion of the third wave, the final wave could be completed at the breakdown level of 320 satoshis in July. To conclude, the TRON price created a bullish hammer once it reached the ascending support line. We believe it will soon initiate a reversal and break out above last week’s high on its way towards 270 satoshis.
Disclaimer
In line with the Trust Project guidelines, this price analysis article is for informational purposes only and should not be considered financial or investment advice. BeInCrypto is committed to accurate, unbiased reporting, but market conditions are subject to change without notice. Always conduct your own research and consult with a professional before making any financial decisions. Please note that our Terms and Conditions, Privacy Policy, and Disclaimers have been updated.

