


The Tron (TRX) price has moved above a vital resistance area and validated it as support afterward.
The price has likely begun an upward trend.
Tron: Long-Term Resistance
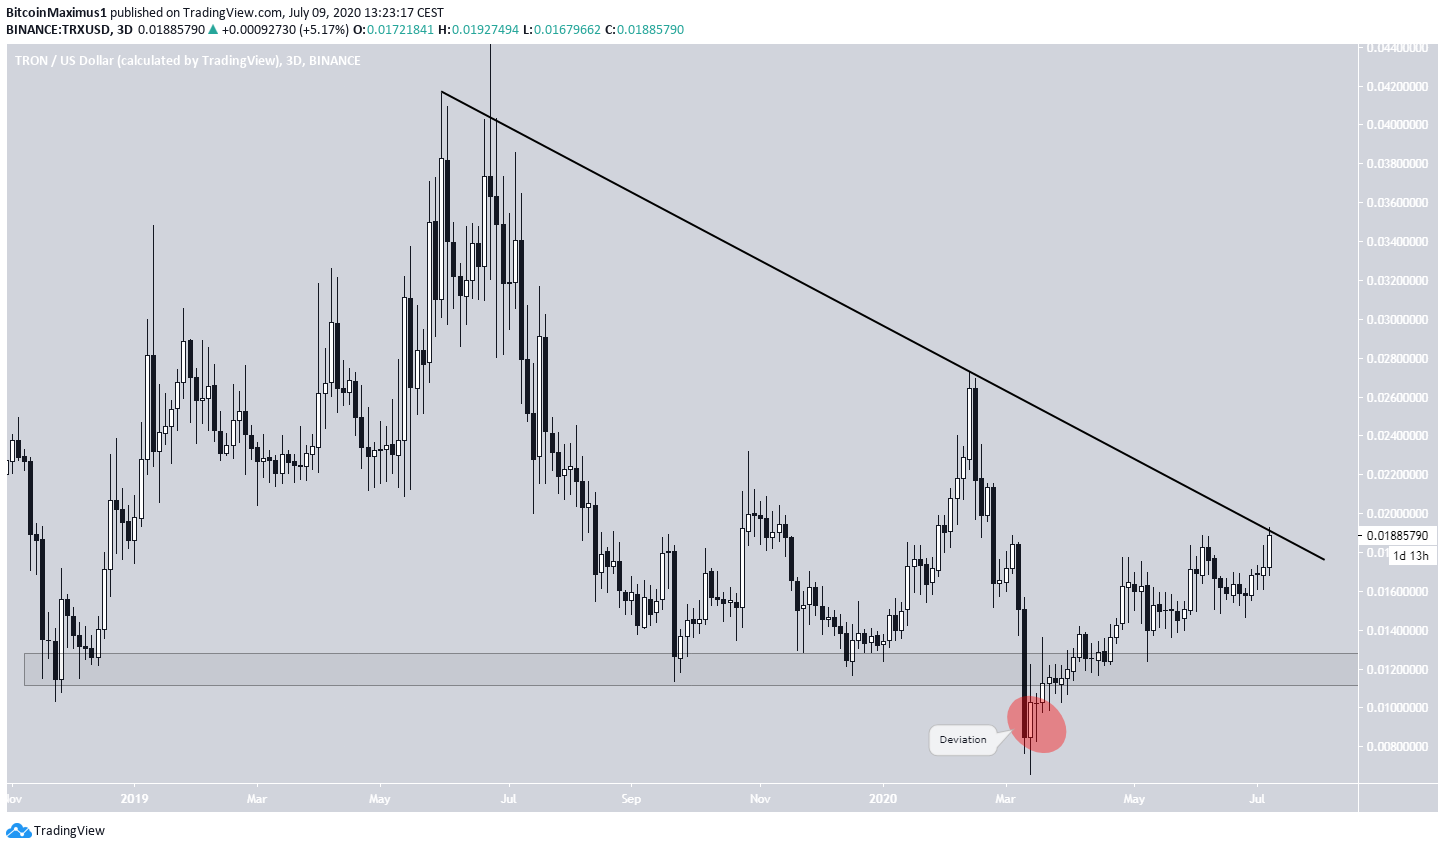
Since November 2018, the $0.012 area has been acting as the range low for TRX. The price briefly declined below this level on March 2020, but quickly reclaimed it and has been moving upwards since.
Whenever a long-term support/resistance area gets broken but is reclaimed afterward, it often means a reversal in the opposite direction is coming. TRX currently faces resistance from a descending resistance line that has been in place since May 14 and has rejected the price three times until now.
A breakout above this line could trigger a rapid acceleration of the upward move, taking the price to $0.026, the most recent high.
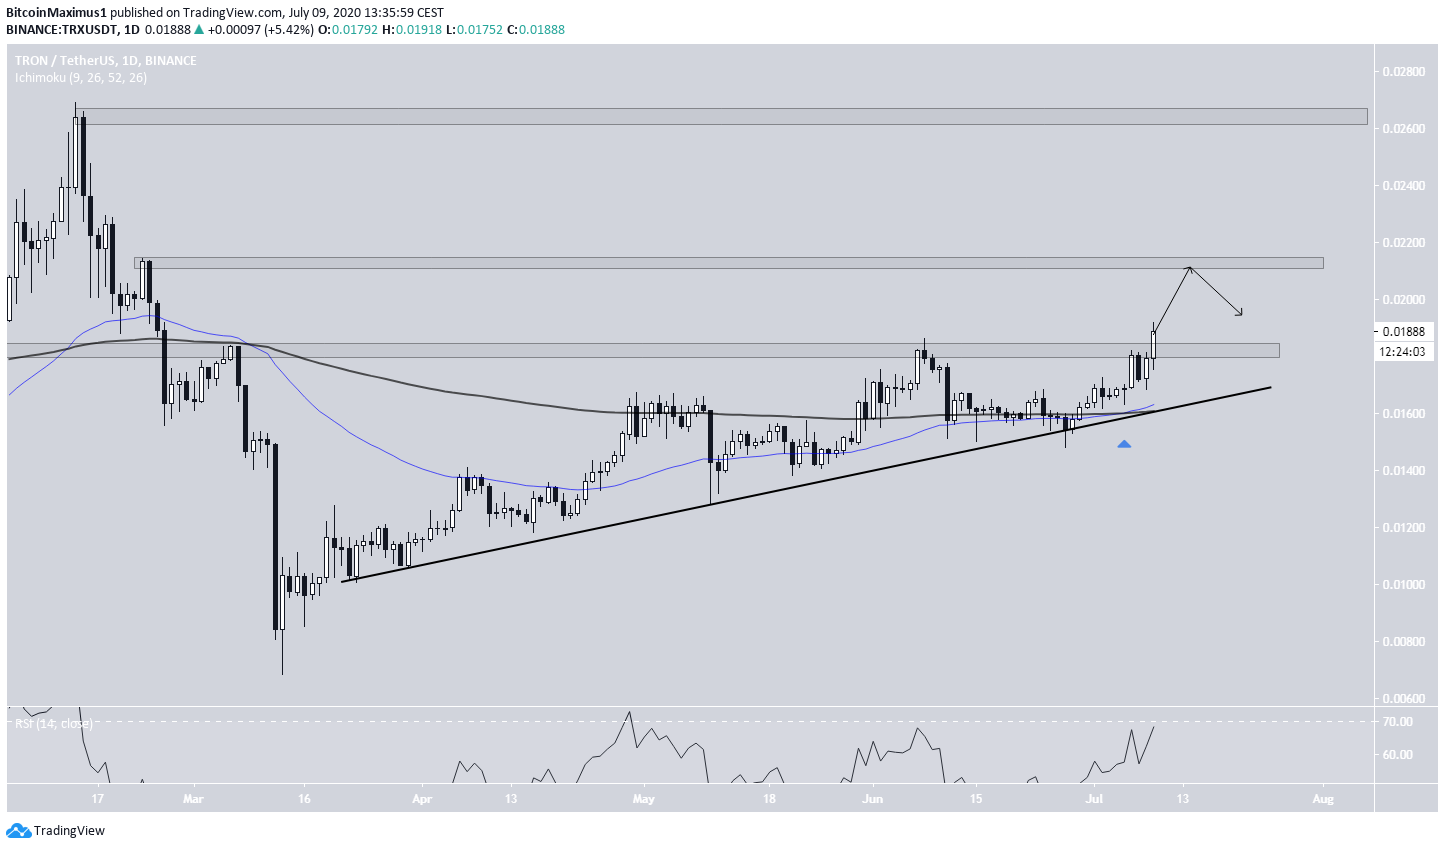
The daily chart shows that the price has already flipped the $0.018 area, which was previously acting as resistance.
Also, the price is following a rising support line and a bullish cross that formed between the 50 and 200-day moving averages (MA). Furthermore, there’s no bearish divergence on the RSI. On the contrary, it is gradually increasing.
Therefore, the TRX price should rally at least until it reaches the $0.0215 resistance area, and possibly higher towards the $0.026 area. This makes a breakout from the previously mentioned descending resistance line very likely.
Short-Term Movement
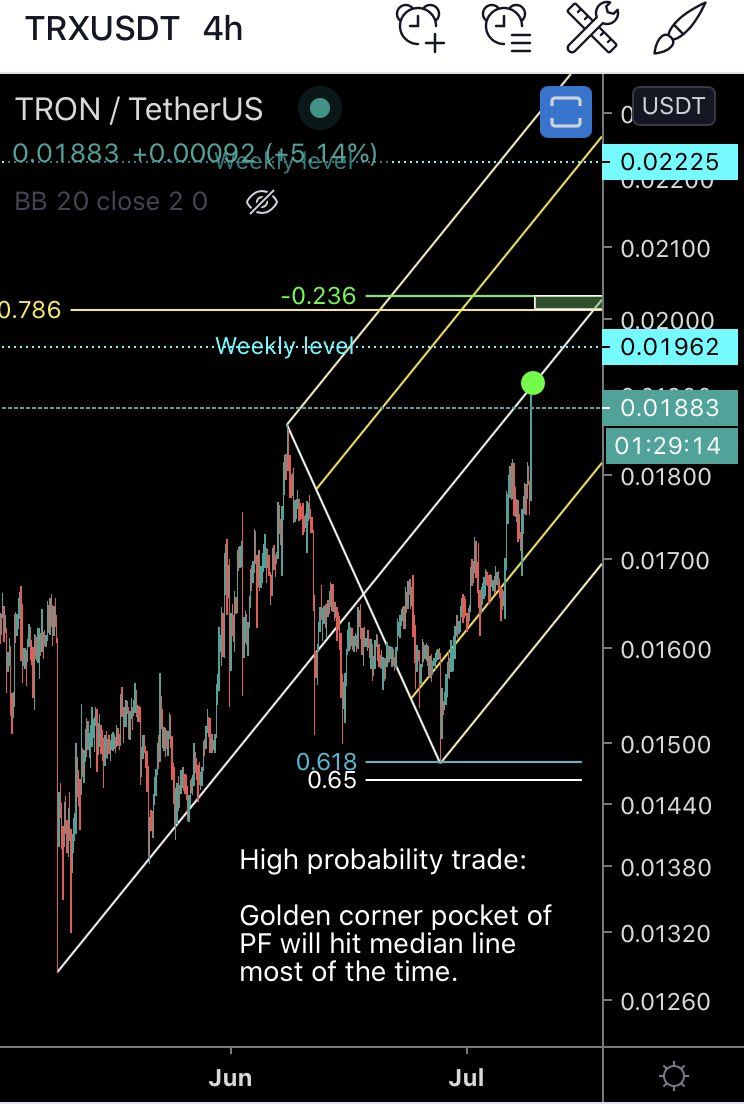
Cryptocurrency trader @Mesawine1 believes that the TRX price is likely to continue increasing and posted a target of $0.022.
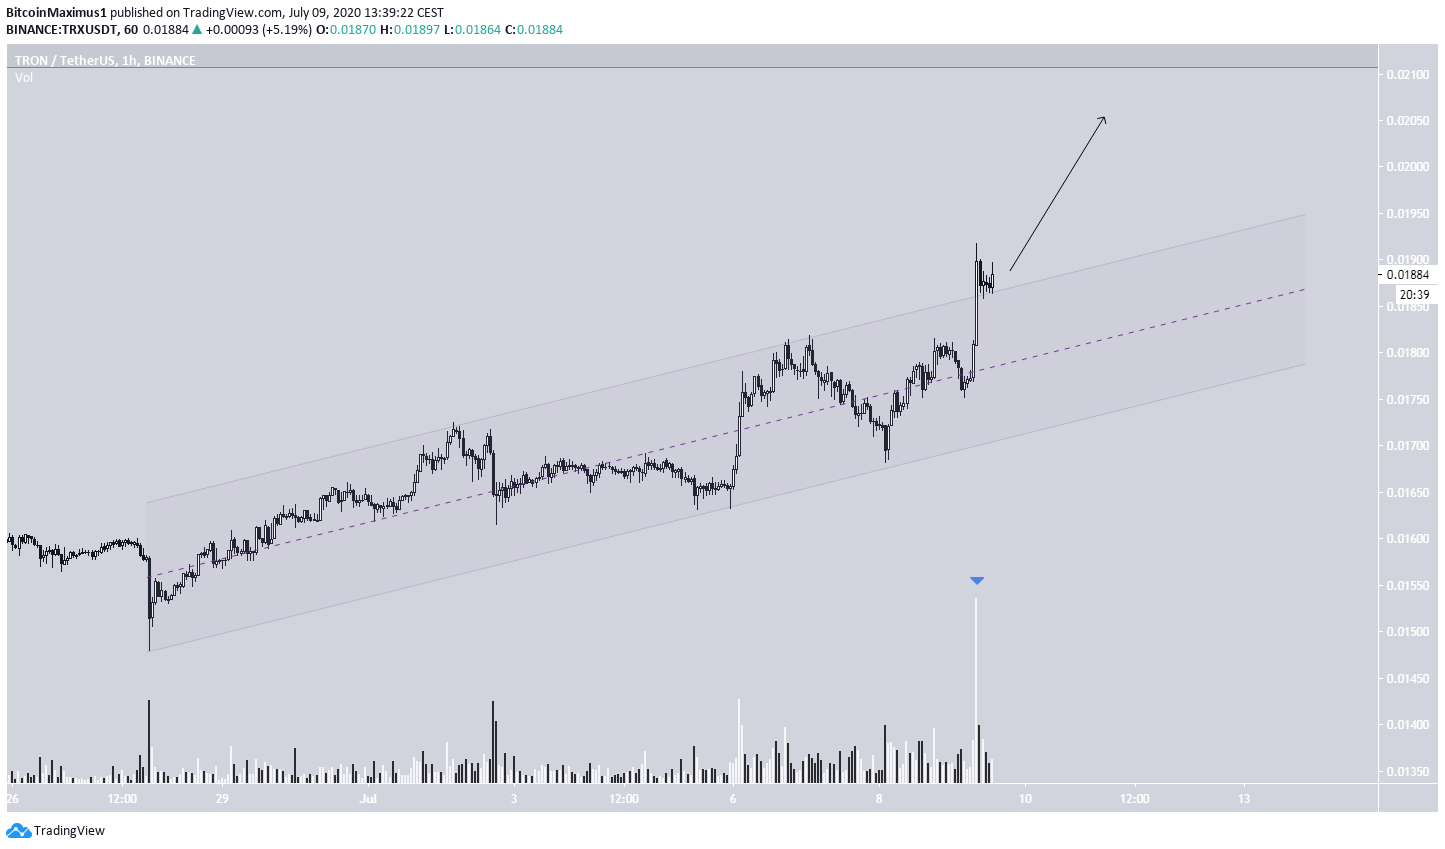
The hourly chart shows that the price has broken out from a short-term ascending, parallel channel. The breakout took place with significant volume, and the price validated it as support afterward.
This signals that the price is likely to move upwards towards the resistance areas outlined in the previous section.
To conclude, the TRX price has flipped an important resistance area and is moving upwards. Once the price breaks out from a long-term descending resistance line, the rate of increase should accelerate.


